Fig. 6
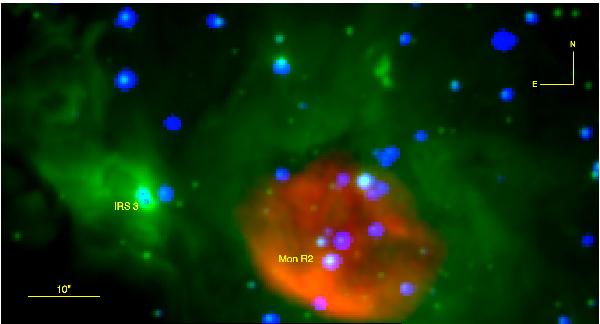
Trichromatic image of the Mon R2 central cluster region. Red, green, and blue colors correspond to VLA 6 cm radio, ESO NTT Ks-band infrared, and Chandra X-ray emission, respectively. The brightest infrared and maser source in the field (IRS3) is also indicated. The field of view shown is fully inside the 95% confidence ellipse for 2FGL J0607.5−0618c. It corresponds to 0.75 × 1.40 arcmin2 with north up and east left.
Current usage metrics show cumulative count of Article Views (full-text article views including HTML views, PDF and ePub downloads, according to the available data) and Abstracts Views on Vision4Press platform.
Data correspond to usage on the plateform after 2015. The current usage metrics is available 48-96 hours after online publication and is updated daily on week days.
Initial download of the metrics may take a while.