Free Access
Fig. 3
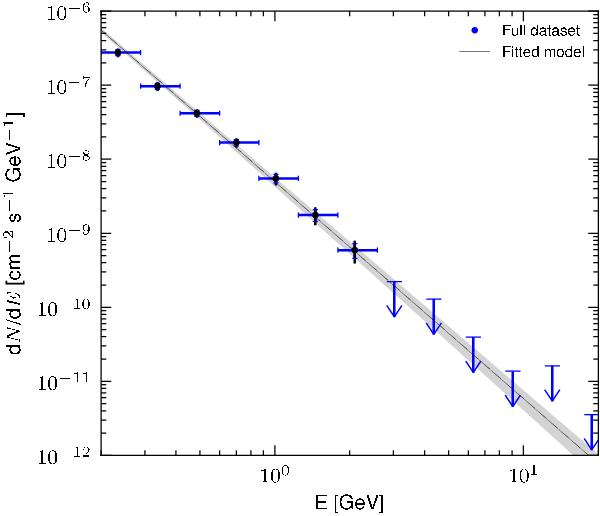
Fermi LAT spectrum of 2FGL J0607.5−0618c resulting from our binned likelihood analysis. The shaded region represents the final power-law fit and its uncertainty resulting from this work. Black error bars display the estimated systematic error.
Current usage metrics show cumulative count of Article Views (full-text article views including HTML views, PDF and ePub downloads, according to the available data) and Abstracts Views on Vision4Press platform.
Data correspond to usage on the plateform after 2015. The current usage metrics is available 48-96 hours after online publication and is updated daily on week days.
Initial download of the metrics may take a while.