Fig. 2
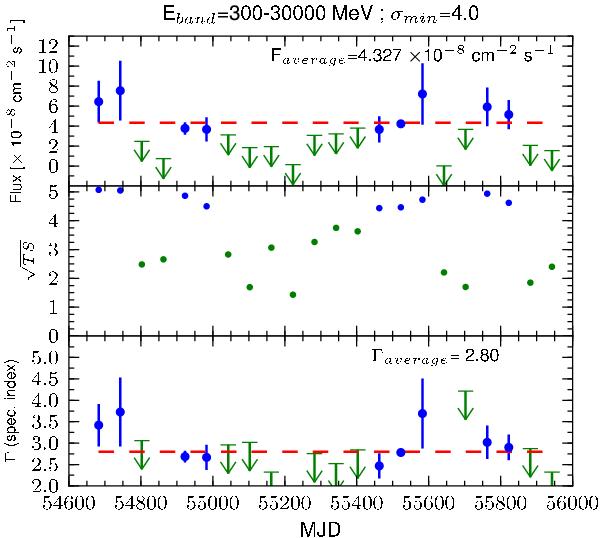
Light-curve study of the source 2FGL J0607.5–0618c in the 0.3−300 GeV energy range.
Upper panel: Fermi LAT light curve of 2FGL
J0607.5–0618c sampled with 60-day bin intervals. Middle panel: value
of  for each light-curve bin. Lower panel: fitted spectral index Γ for
each light-curve bin. Bins with
for each light-curve bin. Lower panel: fitted spectral index Γ for
each light-curve bin. Bins with  (σmin) show their flux value and spectral index as arrow
upper limits. Horizontal dashed lines represent average values.
(σmin) show their flux value and spectral index as arrow
upper limits. Horizontal dashed lines represent average values.
Current usage metrics show cumulative count of Article Views (full-text article views including HTML views, PDF and ePub downloads, according to the available data) and Abstracts Views on Vision4Press platform.
Data correspond to usage on the plateform after 2015. The current usage metrics is available 48-96 hours after online publication and is updated daily on week days.
Initial download of the metrics may take a while.