Fig. 5
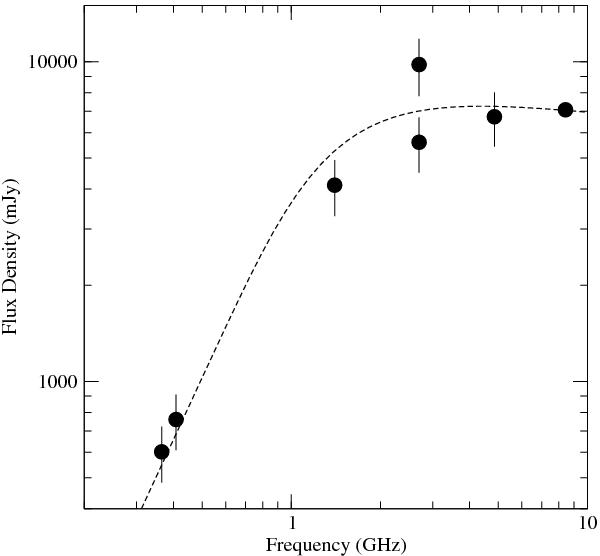
Radio spectrum of the Mon R2 central region, where the absorbed cluster is located, assembled by collecting detections from different surveys included in the SPECFIND V2.0 catalog supplemented with an archival 8.4 GHz detection with the VLA. The dashed line is a free-free thermal spectrum fit from Eq. (1).
Current usage metrics show cumulative count of Article Views (full-text article views including HTML views, PDF and ePub downloads, according to the available data) and Abstracts Views on Vision4Press platform.
Data correspond to usage on the plateform after 2015. The current usage metrics is available 48-96 hours after online publication and is updated daily on week days.
Initial download of the metrics may take a while.