| Issue |
A&A
Volume 555, July 2013
|
|
|---|---|---|
| Article Number | A142 | |
| Number of page(s) | 26 | |
| Section | Catalogs and data | |
| DOI | https://doi.org/10.1051/0004-6361/201220496 | |
| Published online | 15 July 2013 | |
Moderately luminous Type II supernovae ⋆,⋆⋆
1
Astrophysics Research Centre, School of Mathematics and Physics, Queen’s
University Belfast,
Belfast,
BT7 1NN,
UK
e-mail:
This email address is being protected from spambots. You need JavaScript enabled to view it.
2
Dipartimento di Fisica ed Astronomia, Università di
Catania, Sezione Astrofisica, via
S. Sofia 78, 95123
Catania,
Italy
3
INAF – Osservatorio Astrofisico di Catania, via S. Sofia 78,
95123
Catania,
Italy
4
INAF – Osservatorio Astronomico di Padova, Vicolo
dell’Osservatorio 5, 35122
Padova,
Italy
5
Bonino-Pulejo Foundation, via Uberto Bonino 15/C,
98124
Messina,
Italy
6
Università di Padova, Dipartimento di Fisica ed Astronomia G.
Galilei, Vicolo dellOsservatorio,
3, 35122
Padova,
Italy
7
INAF – Osservatorio astronomico di Capodimonte, Salita Moiariello
16, 80131
Napoli,
Italy
8
Departamento de Ciencias Fisicas, Universidad Andres
Bello, Avda. Republica
252, Santiago,
Chile
9
Institut de Ciències de l’Espai (IEEC-CSIC), Facultat de Ciències,
Campus UAB,
08193
Bellaterra,
Spain
10
Fundación Galileo Galilei-INAF, Telescopio Nazionale Galileo,
Rambla José Ana Fernández Pérez 7, 38712
Breña Baja,
Spain
11
Max-Planck-Institut für Astrophysik, Karl-Schwarzschild-Str. 1, 85741
Garching,
Germany
Received:
4
October
2012
Accepted:
17
May
2013
Abstract
Context. Core-collapse Supernovae (CC-SNe) descend from progenitors more massive than about 8 M⊙. Because of the young age of the progenitors, the ejecta may eventually interact with the circumstellar medium (CSM) via highly energetic processes detectable in the radio, X-ray, ultraviolet (UV) and, sometimes, in the optical domains.
Aims. In this paper we present ultraviolet, optical and near infrared observations of five Type II SNe, namely SNe 2009dd, 2007pk, 2010aj, 1995ad, and 1996W. Together with few other SNe they form a group of moderately luminous Type II events. We investigate the photometric similarities and differences among these bright objects. We also attempt to characterise them by analysing the spectral evolutions, in order to find some traces of CSM-ejecta interaction.
Methods. We collected photometry and spectroscopy with several telescopes in order to construct well-sampled light curves and spectral evolutions from the photospheric to the nebular phases. Both photometry and spectroscopy indicate a degree of heterogeneity in this sample. Modelling the data of SNe 2009dd, 2010aj and 1995ad allows us to constrain the explosion parameters and the properties of the progenitor stars.
Results. The light curves have luminous peak magnitudes (−16.95 < MB < −18.70). The ejected masses of 56Ni for three SNe span a wide range of values (2.8 × 10⁻² M⊙ < M(56Ni)< 1.4 × 10⁻¹ M⊙), while for a fourth (SN 2010aj) we could determine a stringent upper limit (7 × 10⁻³ M⊙). Clues of interaction, such as the presence of high velocity (HV) features of the Balmer lines, are visible in the photospheric spectra of SNe 2009dd and 1996W. For SN 2007pk we observe a spectral transition from a Type IIn to a standard Type II SN. Modelling the observations of SNe 2009dd, 2010aj and 1995ad with radiation hydrodynamics codes, we infer kinetic plus thermal energies of about 0.2–0.5 foe, initial radii of 2–5 × 1013 cm and ejected masses of ~5.0–9.5 M⊙.
Conclusions. These values suggest moderate-mass, super-asymptotic giant branch (SAGB) or red super-giants (RSG) stars as SN precursors, in analogy with other luminous Type IIP SNe 2007od and 2009bw.
Key words: supernovae: general / supernovae: individual: SN 2009dd / supernovae: individual: SN 2007pk / supernovae: individual: SN 2010aj / supernovae: individual: SN 1995ad / supernovae: individual: SN 1996W
This paper is based on observations made with the following facilities: the Italian Telescopio Nazionale Galileo, the Liverpool Telescope, the North Optical Telescope, the William Herschel (La Palma, Spain), the Copernico telescope (Asiago, Italy), the Calar Alto Observatory (Sierra de los Filabres, Spain), the orbital telescope Swift (NASA), the Hale Telescope at the Palomar Observatory, and the ESO Telescopes at the La Silla and Paranal Observatories.
The spectra (FITS files) are available at the CDS via anonymous ftp to cdsarc.u-strasbg.fr (130.79.128.5) or via http://cdsarc.u-strasbg.fr/viz-bin/qcat?J/A+A/555/A142
© ESO, 2013
1. Introduction
Type II Supernovae (SNe) are a very heterogeneous class of stellar explosions that stem from the collapse of the core of massive stars (ZAMS mass ≳8 M⊙, e.g. Smartt 2009; Pumo et al. 2009, and reference therein), in most cases a red supergiant (RSG). Stars with H-rich envelope at the explosion are thought to produce Type II “plateau” (IIP) SNe (Barbon et al. 1979), which show a nearly constant luminosity (plateau phase) lasting up to 4 months, during which the envelope recombines, releasing the internal energy. The length of the plateau primarily depends on the envelope mass (e.g. Pumo & Zampieri 2011). If the H envelope mass is very low, the light curve shows a linear, uninterrupted decline after maximum. These SNe are historically called as Type II “linear” (SNe IIL, Barbon et al. 1979). Intermediate cases have been found with light curves showing less pronounced plateaus, e.g. SNe 1992H (Clocchiatti et al. 1996).
A common feature of SN IIP and IIL is the linear tail of the late light curve powered by the energy release of the radioactive decay of 56Co to 56Fe with the characteristic slope of 0.98 mag/100 d, indicating complete γ-ray and e+ trapping. In some cases the observed decline rate is significantly modified by dust formation within the ejecta, which absorbs light at optical wavelengths and re-emits photons in the near-infrared (NIR), by the interaction of the ejecta with the circumstellar medium (CSM) which converts kinetic energy into radiation, or by incomplete γ-ray trapping.
During the first few days after the explosion the spectra of most SNe IIP and IIL approximate a black-body from UV through IR wavelengths. The spectra become progressively dominated by broad P Cygni profiles of Balmer lines with a strong Hα emission, while metal lines arise during the plateau. The late-time spectra are dominated by relatively narrow emission lines of H and prominent forbidden transitions of Ca ii, O i, Fe ii and Mg I (e.g. Turatto 2003).
A different subclass of Type II SNe is constituted by objects showing narrow emission lines already at early phases (SNe IIn, Schlegel 1990). Their spectral appearance and slow luminosity evolution are attributed to the interaction of the fast ejecta with a slowly expanding, dense CSM which generates a forward shock in the CSM and a reverse shock in the ejecta. The shocked material emits energetic radiation whose spectrum depends primarily on the density and velocity of both the CSM and the ejecta (Chevalier & Fransson 1994). Thus the study of SNe IIn provides clues to the mass-loss history of their progenitors. Typical mass loss rates are of the order of 10-6−10-5M⊙ yr-1, but this value can increase significantly and exceed 10-4M⊙ yr-1 (e.g. in SNe 1988Z and 1995N, Chugai 1994; Zampieri et al. 2005).
Sometimes normal SNe II, most often of the linear sub-type, e.g. SNe 1979C (Milisavljevic et al. 2009, and references therein), 1980K (Milisavljevic et al. 2012, and references therein), 1986E (Cappellaro et al. 1995) show the onset of ejecta-CSM interaction at late stages, after an otherwise normal evolution from the photospheric to nebular phase. This is interpreted as evidence that the ejecta, after a phase of free expansion, reach a dense gas shell ejected by the progenitor a few 102−103 yr before the explosion. Recently also a few SNe with overall normal spectral features have shown weak but unequivocal evidence of ejecta-CSM interaction from early times, reviving the interest for the studies of interacting SNe. Among them we recall the Type IIP SNe 1999em and 2004dj (Chugai et al. 2007) or the atypical Type II SN 2007od (Inserra et al. 2011) and SN 2009bw (Inserra et al. 2012a), the last two belonging to the bright tail of the Type IIP SN luminosity distribution.
In this paper we present the spectroscopic and photometric observations of five bright objects, the Type II SNe 2009dd, 2007pk and 2010aj, plus unpublished archival data of SNe 1995ad and 1996W. The plan of the paper is the following: in Sect. 2 we introduce the SNe and their host galaxy properties, estimating distances and reddening. Photometric data, light and colour curves as well as the estimates of 56Ni masses are presented in Sect. 3; in Sect. 4 we describe and analyse the spectra; a discussion is presented in Sect. 5, while a short summary follows in Sect. 6.
Throughout the paper we adopt H0 = 73 km s-1 Mpc-1, Ωm = 0.27 and Ωλ = 0.73.
2. SNe and their host galaxies
In this section the selected SNe and their host galaxies are presented individually.
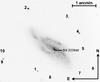 |
Fig. 1 R band image of SN 2009dd in NGC 4088 obtained with CAHA+CAFOS on November 19th, 2009. The sequence of stars used to calibrate the optical and NIR magnitudes is indicated. |
-
1.
SN 2009dd (Fig. 1) wasdiscovered in the Sbc galaxy NGC 4088(Hakobyan et al. 2012) by Cortini& Dimai (2009) on 2009 April 13.97. Elias-Rosaet al. (2009) classified the object asa young Type II SN with strongNa ID interstellar features suggesting significantabsorption inside the parent galaxy. Prompt observations with Swift+XRT revealed an X-ray source at the optical position of the SN with 4.5σ significance (Immler et al. 2009). Over the course of the Swift XRT observations, which lasted a month, the X-ray source continuously brightened from 8 × 1038 erg s-1 to 1.7 × 1039 erg s-1 (in the range 0.2–10 keV, Immler et al. 2009). During the same period no radio emission was detected at the SN position with 3σ upper limits of 0.35 mJy at 1.3 cm, and of 0.15 mJy at 3.5 cm (Stockdale et al. 2009). NED provides the velocity of the host galaxy corrected for Virgo infall, vVirgo = 1025 ± 15 km s-1 (from Mould et al. 2000), corresponding to a distance modulus μ = 30.74 ± 0.15 mag (d ~ 14.0 Mpc). The coordinates of SN 2009dd, measured on our astrometrically calibrated images on two different epochs, are
 ,
,
 (J2000). The object is
located in the galaxy inner region,
(J2000). The object is
located in the galaxy inner region,  west and 4″ south of the
nucleus of NGC 4088. This position, slightly revised with respect to the previous
determination (Cortini & Dimai 2009),
corresponds to a linear distance of ~0.3 kpc from the nucleus, deprojected as in Hakobyan et al. (2009a). The Galactic reddening
toward NGC 4088 is
Eg(B − V) = 0.02 mag
(Ag(B) = 0.085 mag, Schlegel et al. 1998). In our best resolution
optical spectra (cf. Sect. 3.2.1), the
interstellar Na ID (λλ5890,5896) lines of the Galaxy are
seen with average EWg(Na
ID)~ 0.13 Å. According to Turatto et al.
(2003) this corresponds to a galactic reddening
Eg(B − V) ~ 0.02 mag,
exactly the same as the Schlegel et al. (1998)
estimate. With the same method we estimate the reddening inside the parent galaxy. The
corresponding interstellar Na ID components have an average equivalent width
EWi(Na ID)~ 2.7 Å, providing
an Ei(B − V) ~ 0.43 mag
or Ai(B) ~ 1.81 mag. We may notice, that
while there have been conflicting reports on the reliability of the NaID line as
tracer of dust extinction, a most recent analysis of Poznanski et al. (2012), on a large sample of SDSS galaxy spectra, basically
confirmed the strong correlation between the two quantities. Therefore we have adopted
a total reddening to SN 2009dd
Etot(B − V) = 0.45
mag, consistent with the position of the SN inside the parent galaxy and what reported
in Elias-Rosa et al. (2009). A reasonable
assumption to estimate the metallicity is to consider that the SN has the same
metallicity of the closest H ii region. Extracting the spectrum of the region close to
SN from the latest, deep observation of SN 2009dd, we have determined the
N2 index (Pettini & Pagel
2004) to be N2 = −0.54. The relation (1) of Pettini & Pagel (2004) then provides the O
abundances which turns out to be
12 + log (O/H) = 8.59 ± 0.06 ± 0.41 (where the first error is
statistical and the second is the 95% spread of the N2 index
calibration relation), close to the solar abundance (8.69, Asplund et al. 2009).
west and 4″ south of the
nucleus of NGC 4088. This position, slightly revised with respect to the previous
determination (Cortini & Dimai 2009),
corresponds to a linear distance of ~0.3 kpc from the nucleus, deprojected as in Hakobyan et al. (2009a). The Galactic reddening
toward NGC 4088 is
Eg(B − V) = 0.02 mag
(Ag(B) = 0.085 mag, Schlegel et al. 1998). In our best resolution
optical spectra (cf. Sect. 3.2.1), the
interstellar Na ID (λλ5890,5896) lines of the Galaxy are
seen with average EWg(Na
ID)~ 0.13 Å. According to Turatto et al.
(2003) this corresponds to a galactic reddening
Eg(B − V) ~ 0.02 mag,
exactly the same as the Schlegel et al. (1998)
estimate. With the same method we estimate the reddening inside the parent galaxy. The
corresponding interstellar Na ID components have an average equivalent width
EWi(Na ID)~ 2.7 Å, providing
an Ei(B − V) ~ 0.43 mag
or Ai(B) ~ 1.81 mag. We may notice, that
while there have been conflicting reports on the reliability of the NaID line as
tracer of dust extinction, a most recent analysis of Poznanski et al. (2012), on a large sample of SDSS galaxy spectra, basically
confirmed the strong correlation between the two quantities. Therefore we have adopted
a total reddening to SN 2009dd
Etot(B − V) = 0.45
mag, consistent with the position of the SN inside the parent galaxy and what reported
in Elias-Rosa et al. (2009). A reasonable
assumption to estimate the metallicity is to consider that the SN has the same
metallicity of the closest H ii region. Extracting the spectrum of the region close to
SN from the latest, deep observation of SN 2009dd, we have determined the
N2 index (Pettini & Pagel
2004) to be N2 = −0.54. The relation (1) of Pettini & Pagel (2004) then provides the O
abundances which turns out to be
12 + log (O/H) = 8.59 ± 0.06 ± 0.41 (where the first error is
statistical and the second is the 95% spread of the N2 index
calibration relation), close to the solar abundance (8.69, Asplund et al. 2009). -
2.
SN 2007pk (Fig. 2), discovered in the Scd galaxy NGC 579 (Hakobyan et al. 2012) on 2007 November 10.31 UT, has been classified as a young “peculiar” Type IIn SN resembling SN 1998S at early phases (Parisky et al. 2007). Immler et al. (2007) reported a bright X-ray source within
 from the SN position
although, due to the large point-spread-function of the XRT instrument (18″ half-power
diameter at 1.5 keV) the error box include the galaxy nucleus. An X-ray flux of
(2.9 ± 0.5) × 10-13 erg cm-2 s-1 and a luminosity
of (1.7 ± 0.3) × 1040 erg s-1 have been calculated. No radio
emission has been detected with VLA in the 8.46 GHz band (Chandra & Soderberg 2007).
from the SN position
although, due to the large point-spread-function of the XRT instrument (18″ half-power
diameter at 1.5 keV) the error box include the galaxy nucleus. An X-ray flux of
(2.9 ± 0.5) × 10-13 erg cm-2 s-1 and a luminosity
of (1.7 ± 0.3) × 1040 erg s-1 have been calculated. No radio
emission has been detected with VLA in the 8.46 GHz band (Chandra & Soderberg 2007). 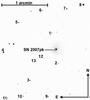
Fig. 2 R band image of SN 2007pk in NGC 579 obtained with NOT+ALFOSC on January 11th, 2008. The sequence of stars in the field used to calibrate the optical magnitude of the 2007pk is indicated.
NED provides a recession velocity of NGC 579 corrected for Virgo infall of vVirgo = 5116 ± 16 km s-1 (from Mould et al. 2000) corresponding to a distance modulus μ = 34.23 ± 0.15 mag. The coordinates of SN 2007pk,
 and
and
 (J2000) measured on our
astrometrically calibrated images are in fair agreement
(
(J2000) measured on our
astrometrically calibrated images are in fair agreement
( ) with those provided by
Parisky et al. (2007). The object is located
in an inner region of the spiral parent galaxy,
) with those provided by
Parisky et al. (2007). The object is located
in an inner region of the spiral parent galaxy,
 east and
 south (slightly revised
with respect to the determination of Parisky et al.
2007) from the nucleus of NGC 579. The position of SN corresponds to a linear
deprojected distance of ~2.5 kpc from the nucleus (cf. Hakobyan et al. 2009a). The Galactic reddening toward NGC 579 was estimated
as Eg(B − V) = 0.05 mag
(Ag(B) = 0.22 mag, Schlegel et al. 1998). We have measured the
intensity of the interstellar Na ID lines of the Galaxy in our best
resolution spectra, finding an average
EWg(Na ID)~ 0.57 Å. This corresponds to
a galactic reddening of
Eg(B − V) ~ 0.09 mag
(Ag(B) ~ 0.38 mag) according to Turatto et al. (2003), 1.8 times larger than the
above-mentioned estimate but still within the large uncertainty of the method. In
analogy we estimated the reddening inside the parent galaxy with the Na ID
components of the host galaxy. The derived
EWi(Na ID)~ 0.33 Å corresponds
to reddening
Ei(B − V) ~ 0.05 mag or
Ai(B) ~ 0.22 mag, about three times
less than the admittedly crude estimate of Pritchard
et al. (2012). Throughout this work we have adopted a total reddening to SN
2007pk
Etot(B − V) = 0.10 mag.
As for SN 2009dd we have measured the emission lines of the region adjacent to the SN
along the slit and determined the index N2 = −0.70 corresponding to
12 + log (O/H) = 8.50 ± 0.05 ± 0.41, again close to the solar
value.
south (slightly revised
with respect to the determination of Parisky et al.
2007) from the nucleus of NGC 579. The position of SN corresponds to a linear
deprojected distance of ~2.5 kpc from the nucleus (cf. Hakobyan et al. 2009a). The Galactic reddening toward NGC 579 was estimated
as Eg(B − V) = 0.05 mag
(Ag(B) = 0.22 mag, Schlegel et al. 1998). We have measured the
intensity of the interstellar Na ID lines of the Galaxy in our best
resolution spectra, finding an average
EWg(Na ID)~ 0.57 Å. This corresponds to
a galactic reddening of
Eg(B − V) ~ 0.09 mag
(Ag(B) ~ 0.38 mag) according to Turatto et al. (2003), 1.8 times larger than the
above-mentioned estimate but still within the large uncertainty of the method. In
analogy we estimated the reddening inside the parent galaxy with the Na ID
components of the host galaxy. The derived
EWi(Na ID)~ 0.33 Å corresponds
to reddening
Ei(B − V) ~ 0.05 mag or
Ai(B) ~ 0.22 mag, about three times
less than the admittedly crude estimate of Pritchard
et al. (2012). Throughout this work we have adopted a total reddening to SN
2007pk
Etot(B − V) = 0.10 mag.
As for SN 2009dd we have measured the emission lines of the region adjacent to the SN
along the slit and determined the index N2 = −0.70 corresponding to
12 + log (O/H) = 8.50 ± 0.05 ± 0.41, again close to the solar
value. -
3.
SN 2010aj was discovered in the Sc galaxy (Hakobyan et al. 2012) MGC-01-32-035 by Newton et al. (2010) on 2010 March 12.39 UT and was classified as a young Type II SN resembling the Type IIP SN 2006bp near maximum brightness (Cenko et al. 2010). The recession velocity of MGC-01-32-035 corrected for the Virgo infall is vVirgo = 6386 ± 20 km s-1 (Mould et al. 2000, from NED), corresponding to a distance modulus μ = 34.71 ± 0.15 mag.

Fig. 3 R band image of SN 2010aj in MGC-01-32-035 obtained with TNG+DOLORES on May 22th, 2010. The sequence of stars in the field used to calibrate the optical and NIR magnitudes of SN 2010aj is indicated.
The coordinates of SN 2010aj have been measured on our images at
 ,
,
 (J2000). The object is
located
(J2000). The object is
located  west and
 south of the centre of the
SABbc: parent galaxy (Fig. 3). The SN is centred
on an H ii region that becomes dominant after 350 d, as clearly seen from the
SN spectral evolution in Sect. 4. The linear
deprojected distance is ~ 7.2 kpc from the nucleus. The Galactic reddening in the
direction to MGC-01-32-035 was estimated as
Eg(B − V) = 0.036 mag
(Ag(B) = 0.148 mag, Schlegel et al. 1998). The available spectra do
show neither the Na ID lines of the parent galaxy nor those of the Galactic
component. Throughout this paper, we will adopt a total reddening to SN 2010aj of
Etot(B − V) = Eg(B − V) = 0.036
mag, entirely due to the Galaxy. Also for this SN we measured the N2
index, N2(SN 2010aj)= −0.47, providing a metallicity of
12 + log (O/H) = 8.63 ± 0.06 ± 0.41, close to the solar value.
south of the centre of the
SABbc: parent galaxy (Fig. 3). The SN is centred
on an H ii region that becomes dominant after 350 d, as clearly seen from the
SN spectral evolution in Sect. 4. The linear
deprojected distance is ~ 7.2 kpc from the nucleus. The Galactic reddening in the
direction to MGC-01-32-035 was estimated as
Eg(B − V) = 0.036 mag
(Ag(B) = 0.148 mag, Schlegel et al. 1998). The available spectra do
show neither the Na ID lines of the parent galaxy nor those of the Galactic
component. Throughout this paper, we will adopt a total reddening to SN 2010aj of
Etot(B − V) = Eg(B − V) = 0.036
mag, entirely due to the Galaxy. Also for this SN we measured the N2
index, N2(SN 2010aj)= −0.47, providing a metallicity of
12 + log (O/H) = 8.63 ± 0.06 ± 0.41, close to the solar value.
-
4.
SN 1995ad (Fig. 4) was discovered by Evans et al. (1995) on 28.8 UT of September in the SBc galaxy NGC 2139 (Hakobyan et al. 2009b). Based on a spectrum collected the day after with the ESO 1.5-m telescope in La Silla it was classified as a Type II close to maximum because of broad P Cygni profiles of Balmer and He i lines lying on a blue continuum (Tbb ~ 13 000 K, Evans et al. 1995). NED provides a heliocentric radial velocity of NGC 2139 corrected for the Virgo Infall of vVirgo = 1674 ± 14 km s-1, from which we infer a distance modulus μ = 31.80 ± 0.15 mag. The coordinates of the SN, measured on our astrometrically calibrated images on two different epochs, are
 and
and
 (J2000). The object is
located in an arm of the host galaxy, 25″ west and 5″ south of the nucleus of
NGC 2139. This position, slightly revised with respect to a previous determination
(McNaught & Pollas 1995), corresponds
to a deprojected distance of ~2.8 kpc from the nucleus.
(J2000). The object is
located in an arm of the host galaxy, 25″ west and 5″ south of the nucleus of
NGC 2139. This position, slightly revised with respect to a previous determination
(McNaught & Pollas 1995), corresponds
to a deprojected distance of ~2.8 kpc from the nucleus. 
Fig. 4 R band image of SN 1995ad in NGC 2139 obtained with ESO 3.6 m+EFOSC1 on December 29th, 1995. The sequence of stars in the field used to calibrate the optical magnitudes of SN 1995ad is indicated.
The Galactic reddening has been estimated as Eg(B − V) = 0.035 mag (i.e. Ag(B) = 0.145 mag, Schlegel et al. 1998). The Na ID interstellar lines associated to the parent galaxy are not visible in the SN spectra. Therefore, hereafter, we consider only the Galactic contribution. To obtain the metallicity of the environment of this SN, we analysed the spectra obtained at the ESO1.5 m telescope on February 19 and 20, 1996 because of the better resolution than the latest available spectra. We measured the O3N2 and N2 indices (Pettini & Pagel 2004) of an H ii region close to the SN. The average relations then provide 12 + log (O/H) = 8.60 ± 0.05 ± 0.41, very close to solar.
-
5.
SN 1996W (Fig. 5) was discovered on April 10 UT and confirmed the following night at the Beijing Astronomical Observatory (BAO) (Li et al. 1996) as a Type II SN soon after the explosion, showing a blue continuum with strong and broad Hα (v ~ 14 300 km s-1) and Hβ. The recession velocity of the host SBc galaxy (Hakobyan et al. 2009b) NGC 4027 corrected for Virgo infall is vVirgo = 1779 ± 29 km s-1 (Mould et al. 2000, from NED), corresponding to a distance modulus μ = 31.93 ± 0.15 mag.
Table 1Instrumental configurations.
The coordinates of SN 1996W, measured on our astrometrically calibrated images on two different epochs, are
 and
and
 (J2000). The object is
located in an arm of the host galaxy, 17″ west and 34″ north of the nucleus of the
parent galaxy NGC 4027. This position, slightly revised with respect to previous
determination (Suntzeff et al. 1996),
corresponds to a deprojected distance of ~3.0 kpc from the nucleus.
(J2000). The object is
located in an arm of the host galaxy, 17″ west and 34″ north of the nucleus of the
parent galaxy NGC 4027. This position, slightly revised with respect to previous
determination (Suntzeff et al. 1996),
corresponds to a deprojected distance of ~3.0 kpc from the nucleus. 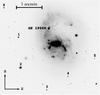
Fig. 5 R band image of SN 1996W in NGC 4027 obtained with the Dutch 0.9 m telescope on May 13th, 1996. The local sequence of stars used to calibrate the optical magnitude is indicated.
The Galactic reddening has been estimated as Eg(B − V) = 0.044 mag (Ag(B) = 0.145 mag Schlegel et al. 1998). In the spectra of SN 1996W the absorption features due to interstellar Na ID lines both from our Galaxy and of the host galaxy have been identified, suggesting a reddening Eg(B − V) ~ 0.05 and Ei(B − V) = 0.187 mag (Ai(B) = 0.77 mag), respectively. The total extinction Etot(B − V) = 0.23 mag (Atot(B) = 0.95 mag) was adopted. For the metallicity of the underlying H ii region as representative of the metallicity of the SN, we obtained an oxygen abundance of 12 + log (O/H) = 8.60 ± 0.06 ± 0.41, also in this case very close to solar.
Ultraviolet, optical and infrared photometry of SN 2009dd.
Ultraviolet and optical photometry of SN 2007pk.
Optical and infrared photometry of SN 2010aj.
Optical and infrared magnitudes of SN 1995ad.
Optical magnitudes of SN 1996W.
3. Photometry
3.1. Data summary
Optical observations of SNe 2009dd, 2007pk, 2010aj, 1995ad and 1996W were obtained with ground based telescopes and the Swift satellite (see Table 1).
Observations were reduced following standard procedures in the IRAF1 environment. Instrumental magnitudes were measured on the images corrected for overscan, bias and flat field.
Photometric zero points and colour terms were computed for all photometric nights through observations of Landolt standard fields (Landolt 1992). The average magnitudes of the local sequence stars were computed and used to calibrate the photometric zero points for the non-photometric nights. Magnitudes of the local sequence stars are reported in Tables A.1–A.5 along with their rms (in brackets). The calibrated optical magnitudes of the SNe are reported in Tables 2–6.
The i-band filter used at the 2.56-m Nordic Optical Telescope (NOT) is an interference filter with central wavelength 7970 Å, slightly different from the classical Gunn or Cousins I and more similar to Sloan i. In our analysis, however, it was calibrated as Cousins I. Also, for the LT Sloan photometry we subsequently applied an S-correction (Stritzinger et al. 2002; Pignata et al. 2004) to convert the SN magnitudes to the standard Johnson-Cousins photometric system, finding an average correction of ΔU ~ 0.04, ΔR ~ 0.01 and ΔI ~ −0.10. In the case of SN 2009dd the discovery magnitude reported in Cortini & Dimai (2009) has been revised and reported as R band in Table 2.
Swift U, B, V aperture magnitudes were transformed to Johnson system through the colour transformations by Li et al. (2006). After comparison with optical ground-based data, offsets were applied when necessary (cf. Sect. 3.2). The magnitudes of the SNe were obtained through a point spread function (PSF) fitting sometimes applied after template subtraction, depending on the background complexity and the availability of suitable template images. The uncertainties reported for each optical band in Tables 2–6 were estimated by combining in quadrature the errors of photometric calibration and those on the instrumental magnitudes. The latter were obtained through artificial star experiments. When the object was not detected, limiting magnitudes were estimated by placing artificial stars of different magnitudes at the expected SN position. Only significant limits are presented in Figs. 6–10.
Ultraviolet (uvw2, uvm2, uvw1; see Poole et al. 2008) observations, obtained by UVOT on board of the Swift satellite are available for twenty-four epochs in a period of 160 d in the case of SN 2009dd and for ten epochs in 23 d for SN 2007pk. We reduced these data using the HEASARC2 software. For each epoch all images were co-added, and then reduced following the guidelines presented by Poole et al. (2008).
The NIR images of the SN fields were obtained combining several sky-subtracted, dithered exposures. Photometric calibration was achieved relative to the 2MASS photometry of the same local sequence stars as used for the optical calibration. NIR photometry was obtained just at a single epoch for SNe 2009dd, 2010aj and 1995ad. In the case of SN 2009dd the K′ filter was used but was calibrated as K band.
The follow-up coverage of individual SNe is not exceptional. However, these objects taken together provide a fairly complete picture of the photometric evolutions of luminous Type II SNe.
3.2. Light curves
In this Section we present the photometric information for the full SN sample. The main data are reported in Table 9.
3.2.1. SN 2009dd
The optical monitoring of SN 2009dd started on April 14, 2009, the day after the discovery, and continued until October 2010. Because of the location of the SN very close to the galaxy nucleus, the optical photometric measurements of SN 2009dd were performed using the template subtraction technique (Table 2).
By comparing space and ground-based UBV magnitudes, computed interpolating the light curves with low-order polynomials at corresponding epochs, we found average differences (ground-space) ΔU ~ 0.20 ± 0.03, ΔB ~ 0.06 ± 0.03, ΔV ~ 0.10 ± 0.03. These corrections have been applied to all UVOT magnitudes and the resulting values are reported in Table 2.
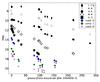 |
Fig. 6 Synoptic view of the light curves of SN 2009dd in uv and optical bands. Magnitude shifts for the different bands are in the legend. |
In Fig. 6 the uvw2, uvm2, uvw1, U, B, V, R, I light curves of SN 2009dd are plotted. NIR magnitudes are not shown because available at a single epoch. The light curves do not constrain the explosion epoch, that was determined through a comparison of the early spectra with a library of SN spectra performed with the GELATO code (Harutyunyan et al. 2008), and was found to be JD 2 454 925.5 ± 5.0 (April 04 UT).
Assuming the distance and extinction discussed in Sect. 2, we find  ,
,
 ,
,
 ,
,
 and
and  ,
where the reported errors include both measurement errors and the uncertainties on the
distance modulus.
,
where the reported errors include both measurement errors and the uncertainties on the
distance modulus.
An initial rapid decline is visible from U to V during the first 30 days (Δm(B) ~ 1.2 mag). It was followed by a plateau lasting about 50–70 days, more clearly visible in the R and I bands. The luminous peak, mV ~ 15.5 corresponding to MV ~ −16.6 is slightly higher than the average for SNIIP (MV ~ −15.9, Patat et al. 1994; Li et al. 2011) and fainter than the luminous IIP 1992H (MV ~ −17.3, Clocchiatti et al. 1996), 2007od (MV ~ −17.4, Inserra et al. 2011) or 2009bw (MV ~ −17.2, Inserra et al. 2012a). The rapid post plateau decline occurring at about 100 d signals the onset of the nebular phase. The drop in magnitude between the photospheric and the nebular phase is Δm(V) ~ 1.4 mag in ~20 d in the V band, somewhat lower than the value of 2 mag in normal SNe IIP. The late decline rates in the various bands are similar. During the 120–280 d interval the V band decline rate is 1.15 mag (100 d)-1, marginally higher than the decline rate expected from 56Co to 56Fe decay (0.98 mag (100 d)-1) in case of complete γ-ray trapping.
3.2.2. SN 2007pk
The optical photometric monitoring of SN 2007pk started on November 11th, 2007 and continued until January 2008. SN observations during the nebular phase turned out with only upper limits. Because of the proximity to the nucleus of the host galaxy and a nearby H ii region, also in this case the SN optical photometry was measured using the template subtraction technique. The Swift data have been treated as for SN 2009dd. The comparison of space and ground-based photometry at corresponding epochs pointed out systematic average differences (ground-space) Δ(U) ~ 0.20 ± 0.05, Δ(B) ~ 0.06 ± 0.02, Δ(V) ~ 0.07 ± 0.03. As before, Table 3 reports the corrected magnitudes. Our estimates of the Swift ultraviolet (uvw2, uvm2, uvw1) and optical (u, b, v, before transformation to the Johnson–Cousins system) photometry are in agreement with those presented by Pritchard et al. (2012).
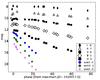 |
Fig. 7 Synoptic view of the light curves of SN 2007pk in all available bands. The magnitude shifts with respect to the values reported in Table 3 are listed in the insert. |
The light curves are plotted in Fig. 7. The very early observations show a rise to maximum. The somewhat slower rise and late peak in the R band might be an effect of the large errors affecting the measurements of Nov. 12, 2007. The B-band peak (JD 2 454 417.5 ± 1.0) is consistent with the phases derived from the spectral comparison performed with GELATO (Harutyunyan et al. 2008). Therefore, hereafter we will adopt JD 2 454 412.0 ± 5 (November 7.5 UT) as the best estimate for the explosion epoch.
Having adopted the distance and the extinction (Sect. 2), we can determine the absolute magnitudes at maximum:
 ,
,
 ,
,
 and
and 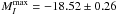 ,
where the associated errors include the uncertainty on the distance modulus and
measurement errors. Therefore, SN 2007pk is a bright SN II according to the criteria of
Patat et al. (1994) and Li et al. (2011). The average decline rate in the first 100 days post
maximum is
,
where the associated errors include the uncertainty on the distance modulus and
measurement errors. Therefore, SN 2007pk is a bright SN II according to the criteria of
Patat et al. (1994) and Li et al. (2011). The average decline rate in the first 100 days post
maximum is  (07pk)~ 3.6
mag (100 d)-1, closer to those of Type IIL than to those of Type IIP SNe
(Patat et al. 1994). On the contrary,
(07pk)~ 3.6
mag (100 d)-1, closer to those of Type IIL than to those of Type IIP SNe
(Patat et al. 1994). On the contrary,
 (07pk)~ 1.8
mag (100 d)-1 is typical of Type IIP, making SN 2007pk a transitional object
between the two subclasses.
(07pk)~ 1.8
mag (100 d)-1 is typical of Type IIP, making SN 2007pk a transitional object
between the two subclasses.
3.2.3. SN 2010aj
Our observations (cf. Table 4 and Fig. 8) cover a period of almost one year, although the SN has been detected only until ~100 days after discovery. Because of the complex background, the late time photometry was performed using the template subtraction. The large errors, estimated with the artificial stars method, are due to non ideal sky conditions.
 |
Fig. 8 Light curves of SN 2010aj in optical bands. The magnitude shifts with respect to the values reported in Table 4 are in the legend. |
The early magnitudes reported in the CBET, give a weak indication that the R band peak occurred around JD 2 455 269.5 (March 13 UT), in agreement with the spectral age reported by Cenko et al. (2010) and with the epoch provided by the GELATO comparisons. Then we adopted JD 2 455 265.5 ± 4.0 (March 10 UT) as epoch of the explosion.
The maximum absolute magnitudes are: 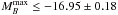 ,
,
 ,
,
 and
and 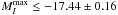 ,
where the reported errors include the uncertainties in our photometry, in the adopted
distance modulus, and in the interstellar reddening. Note that only in the
R band the reported value is the absolute magnitude at maximum, while
in the other bands they are the brightest measured magnitudes.
,
where the reported errors include the uncertainties in our photometry, in the adopted
distance modulus, and in the interstellar reddening. Note that only in the
R band the reported value is the absolute magnitude at maximum, while
in the other bands they are the brightest measured magnitudes.
The early post maximum decline in the R band is about 0.55 mag in 11 d. After about 15 days, the V, R and I light curves settle in a long slanted plateau with average magnitudes V ~ 18.2, R ~ 17.8 and I ~ 17.5 (MV ~ −16.6, MR ~ −17.0 and MI ~ −17.3), while the B band shows a monotonic decline. The plateau of SN 2010aj is, therefore, relatively luminous when compared with those of more typical SNe IIP and similar to those of SNe 2009bw (MV ~ −17.2, Inserra et al. 2012a) and 2009dd (MV ~ −16.6, cf. 3.2.1). The tail has been observed in the V, R, I bands and, with a single data point, in the B band. However, because of the early phase and short time baseline the measured decline rates, γR ~ 3.0 and γI ~ 2.1 mag (100 d)-1, are not indicative of the true decline in the tail. The drop between the photospheric and the nebular phase is Δ(R) ~ 2.5 mag in ~16 d, similar to that of SN 2009bw (~2.2 mag in ~13 d).
3.2.4. SN 1995ad
Observations of SN 1995ad started the day after the discovery by Evans et al. (1995, V ~ 14.25, about one week after the first (pre-discovery) detection (R ~ 15.7, Broughton 1998), and span a period of more than 400 days. SN magnitudes are reported in Table 5 and shown in Fig. 9. The pre-discovery detection together with spectroscopic constraints allow us to estimate the explosion epoch to about JD 2 449 981.0 ± 3 (on September 20).
 |
Fig. 9 Light curves of SN 1995ad in uv and optical bands. The magnitude shifts with respect to the original value reported in Table 5 are in the insert. |
Considering the adopted extinction and distance (Sect. 2), the SN reached at maximum  ,
,
 ,
,
 and
and  .
.
The light curves show a steep decline from the maximum to the plateau, the latter lasting about 50 days (with an average MV ~ −16.6) resembling those of SN 2007od, SN 1992H and SN 2010aj. Between day 60 and 90 the SN abruptly faded reaching the radioactive tail, marked by a decline very close to the 56Co to 56Fe decay rate (γV ~ 0.93 mag (100 d)-1 between 95–220 d). The available very late time photometry (t > 300 d) shows an increase of the luminosity decline, being larger in V than in the R band. This may be due to dust formation, as suggested by the detection of CO emission in the late-time NIR spectra (Spyromilio & Leibundgut 1996).
3.2.5. SN 1996W
Our photometric observations started a few days after the discovery. The SN magnitudes are reported in Table 6 along with photometry reported in the IAUC; the light curves are shown in Fig. 10. The early discovery magnitudes and the spectral comparison with GELATO agree in dating the explosion shortly before the discovery. Thus we adopt as epoch of the explosion JD 2 450 180.0 ± 3.
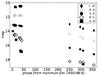 |
Fig. 10 Light curves of SN 1996W in all available bands. Shifts compared to the original values reported in Table 6 are in the legend. |
Assuming the distance and extinction values discussed in Sect. 2, we find  ,
,
 ,
,
 and
and  .
.
The available observations show a flat and bright (MV ~ −17.5) plateau in the VRI bands during the first ~40 days and instead a linear decline in the U and B bands until the SN disappeared behind the Sun. The SN was recovered after day 250. The late time decline rates in the various bands are γB ~ 0.50, γV ~ 0.86, γR ~ 0.92 and γI ~ 0.86 mag (100 d)-1, not dissimilar from that of the 56Co to 56Fe.
Main parameters of the SNe II used as reference.
3.3. Colour evolution
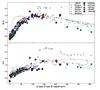 |
Fig. 11 Comparison of the dereddened colours of our sample of SNe and those of SNe 1987A, 2005cs, 1999em, 2004et, 2007od and 2009bw. The phase of SN 1987A is with respect to the explosion date. |
The colour curves of the five SNe, valuable to test their degree of homogeneity, are reported in Fig. 11 along with those of SN 1987A, the faint SN 2005cs, the normal SN 1999em and the luminous SNe 2004et, 2007od and 2009bw (Table 7). All these SNe IIP show quite similar colour evolutions with a rapid increase of the (B − V) colour as the SN envelope expands and cools down. After about 40 days the colour varies more slowly as the cooling rate decreases, reaching a value of ~1.5 mag at ~100 d. The remarkable exceptions to this uniform trend are SN 1987A, faster at early times, and SN 2005cs having a red spike at about 120 d, which seems to be a common feature in low-luminosity SNe IIP (Pastorello et al. 2004). After 150 days all SNe show a slow turn to bluer colours. Among the SNe presented in this paper, the (B − V) colour curve of SN 2009dd seems redder although this might be related to an underestimate of the colour excess.
The (V − I) colour increases for all SNe II during the first days past explosion; it remains roughly constant during the plateau phase (V − I ~ 0.7) and has a further increase during the post-plateau drop. Then it is fairly constant during the nebular phase (Fig. 11 bottom). The objects of our sample have similar colours at all epochs as other Type II SNe.
3.4. Bolometric light curves and Ni masses
Because of the incomplete UV-optical-NIR coverage, it is impossible to obtain true bolometric light curves. We computed the quasi-bolometric light curves by integrating the fluxes of the available UBVRI photometry (B to I for SN 1995ad). Broad band magnitudes were converted into fluxes at the effective wavelengths, then were corrected for the adopted extinctions (cf. Sect. 2), and finally the resulting spectral energy distributions (SED) were integrated over wavelengths, assuming zero flux at the integration limits. Fluxes were then converted to luminosities using the distances adopted in Sect. 2. The emitted fluxes were computed at phases in which R or V observations were available. When observations in other bands were unavailable in a given night, the magnitudes were obtained by interpolating the light curves using low-order polynomials, or were extrapolated using constant colours. Pre-maximum estimates are based mainly on single R- or V-band observations and should be regarded as most uncertain. The quasi-bolometric light curves of our sample are displayed in Fig. 12 along with those of the reference SNe of Table 7. We notice that the possible contribution to the total flux in the nebular phase from the NIR bands (likely 15%−20%, Inserra et al. 2011) was neglected.
The quasi-bolometric peaks of SN 2007pk, SN 2010aj and SN 1995ad are reached close to the R maximum and those of SN 2009dd and SN 1996W closer to the V maximum. The quasi-bolometric luminosities at maximum light are reported in Table 9. They range between 1.5 and 6.3 × 1042 erg s-1. The peak luminosities for all objects are moderately bright, only slightly fainter than those of the luminous SNe 2007od, 2004et, 1992H. Four out of five objects have long and bright plateaus, comparable in luminosity to that of SN 2009bw. Figure 12 points out the early transition (~80 d–100 d) to the radioactive tail of SN 2010aj, SN 2009dd and SN 1995ad (the end of the plateau of SN 1996W was missed). Instead SN 2007pk shows a peak luminosity higher than other objects of our sample and a linear decline during the photospheric phase though with a rate that is smaller than for the prototypical Type IIL SN 1979C.
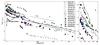 |
Fig. 12 Comparison of quasi-bolometric light curves of our sample (UBVRI-integrated for SN 2009dd, SN 2007pk, SN 2010aj and SN 1996W and BVRI-integrated for SN 1995ad) with those of other Type II SNe; most of them are bright and thus different from the general distribution in luminosity of Type II SNe. The phase is with respect to the maximum, only for SN 1987A is with respect to the explosion epoch. Minor misalignments in the epoch of maxima are due to the different epochs adopted for the maxima of the reference band light curve and the quasi-bolometric curve. On the right a blow up of the SNe of our sample in the first 80 d. |
The tails of the quasi-bolometric light curves of SN 2009dd, SN 1995ad and SN 1996W have slopes close to that of the decay of 56Co to 56Fe (cf. Table 9) allowing the determination of the ejected 56Ni mass. The observations of SN 2010aj ended just at the beginning of the radioactive tail, thus we feel confident to provide only an upper limit to the 56Ni mass, while not even this is available for SN 2007pk.
The 56Ni mass has been derived by comparing the late quasi-bolometric light
curves integrated over the same wavelength range as SN 1987A, assuming a similar
γ-ray deposition fraction  (1)where the
mass of 56Ni ejected by SN 1987A is
M(56Ni)87A = 0.075 ± 0.005
M⊙(Arnett 1996), and
L87A is the quasi-bolometric luminosity at comparable epoch.
The comparisons give M(56Ni)09dd ~ 0.029
M⊙,
M(56Ni)95ad ~ 0.028
M⊙and M(56Ni)96W ~ 0.14
M⊙. With the same assumption on the full thermalization of
the γ-rays, we cross-checked these results with the formula
(1)where the
mass of 56Ni ejected by SN 1987A is
M(56Ni)87A = 0.075 ± 0.005
M⊙(Arnett 1996), and
L87A is the quasi-bolometric luminosity at comparable epoch.
The comparisons give M(56Ni)09dd ~ 0.029
M⊙,
M(56Ni)95ad ~ 0.028
M⊙and M(56Ni)96W ~ 0.14
M⊙. With the same assumption on the full thermalization of
the γ-rays, we cross-checked these results with the formula ![Mathematical equation: \begin{equation} \label{eq:2} \textstyle M(^{56}{\rm Ni})_{\rm SN} = \left(7.866\times10^{-44}\right) L_{\rm t}\exp\left[\frac{(t-t_{0})/(1+z)-6.1}{111.26}\right] M_{\odot} \end{equation}](/articles/aa/full_html/2013/07/aa20496-12/aa20496-12-eq206.png) (2)from
Hamuy (2003), where
to is the explosion epoch, 6.1 d is the half-life of
56Ni, and 111.26 d is the e-folding time of the
56Co decay (Cappellaro et al. 1997;
Woosley et al. 1989). This method yields
M(56Ni)09dd ~ 0.027
M⊙,
M(56Ni)95ad ~ 0.025 M⊙and
M(56Ni)96W ~ 0.13 M⊙,
in agreement with the above determinations. For SN 2010aj we estimated an upper limit
M(56Ni)10aj < 0.007
M⊙, based on the last epoch in which the SN was detected.
(2)from
Hamuy (2003), where
to is the explosion epoch, 6.1 d is the half-life of
56Ni, and 111.26 d is the e-folding time of the
56Co decay (Cappellaro et al. 1997;
Woosley et al. 1989). This method yields
M(56Ni)09dd ~ 0.027
M⊙,
M(56Ni)95ad ~ 0.025 M⊙and
M(56Ni)96W ~ 0.13 M⊙,
in agreement with the above determinations. For SN 2010aj we estimated an upper limit
M(56Ni)10aj < 0.007
M⊙, based on the last epoch in which the SN was detected.
4. Spectroscopy
In this Section we present and discuss the spectral evolution of the five SNe of our sample (Table A.6).
The data were reduced (trimming, overscan, bias correction and flat-fielding) using standard IRAF routines. Optimal extraction of the spectra was adopted to improve the signal-to-noise ratio (S/N). Wavelength calibration was performed using spectra of comparison lamps acquired with the same configurations as the SN observations. Atmospheric extinction correction was based on tabulated extinction coefficients for each telescope site. Flux calibration was done using spectro-photometric standard stars observed in the same nights with the same set-up as the SNe. The flux calibration was checked against the photometry, integrating the spectral flux transmitted by standard BVRI filters and adjusted by a multiplicative factor when necessary. The resulting flux calibration is accurate to within 0.1 mag. The spectral resolutions in Table A.6 were estimated from the full widths at half maximum (FWHM) of the night sky lines. Whenever possible we used the spectra of standard stars to remove telluric features in the SN spectra.
4.1. Individual properties
In the following we will discuss the spectroscopic properties of the individual SNe showing relatively normal behaviors for four objects, with some evidences of weak ejecta-CSM interaction, and more marked signatures of interaction during the first months for SN 2007pk.
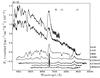 |
Fig. 13 Complete spectral evolution of SN 2009dd. Wavelengths are in the observer’s rest-frame. The phase for each spectrum is relative to the adopted explosion date (JD 2 454 925.5), late spectra have been multiplied by a factor 5 to emphasise the nebular lines. The ⊕ symbols mark the positions of the strongest telluric absorptions. The ordinate refers to the top spectrum; the other spectra are shifted downwards by 4 × 10-15 (second and third) and 1.4 × 10⁻¹⁵ (others) erg s-1 cm-2 Å-1. |
4.1.1. SN 2009dd
Seven spectra are available for this object tracing the evolution from about 11 d post explosion to about 14 months (Fig. 13). The first spectrum shows a blue continuum comparable to that of other young SNe II. It is characterised by the P Cygni features of the H Balmer series, He i λ5876, Fe ii multiplets (e.g. λλ4924, 5018, 5169) and H&K of Ca ii. On the blue side of the Hα emission, at about 6200 Å, three absorption features are present. The bluest absorption, at ~6174 Å is possibly identified as Si ii, with an expansion velocity comparable to those of the other metal ions. This line was also identified in other Type II SNe (e.g. SN 1992H, SN 2007od, SN 2009bw; Inserra et al. 2011, 2012a, and references therein). The middle feature is probably Fe iiλ6456 but the line strength would indicate a much higher optical depth than usual for metal lines at this stage. Alternatively, this line might be a high velocity component (HV) of Hα. Actually a tiny absorption blue ward of Hβ is visible at ~4620 Å but the resulting expansion velocity is larger than the putative Hα component (HV(Hα)= 13 800 km s-1 vs. HV(Hβ)= 14 800 km s-1). The presence of a HV feature could be a signature of early interaction of the ejecta with the CSM (Chugai et al. 2007), consistent with the X-ray detection (cf. Sect. 2). Unfortunately, we do not have other spectra at similar epochs to confirm this line identification. The reddest observed component is the Hα P Cygni absorption, indicating an expansion velocity of ~11 000 km s-1.
The third spectrum was taken during the plateau phase. It shows well-developed P Cygni profiles of the Balmer series and a number of metal lines, including Fe ii at ~4500 Å and Sc iiλ5031 on the red side of Hβ. Fe i and Sc ii are visible at about 5500 Å, while Na ID has now replaced He i λ5876. Other prominent metal lines are Ba ii λ6142 and Sc ii λ6245. In the red (λ > 7000 Å) the Ca ii NIR triplet is one of the strongest spectral features. In addition, O i at ~7774 Å and N ii at ~8100 Å are possibly detected. The same features are visible in the fourth (late-photospheric) spectrum (+108 d).
The series of three nebular spectra (230 d–409 d) show emissions of Na ID, [O i] λλ6300,6364, Hα, [Fe ii] λ7155, [Ca ii] λλ7291, 7324 doublet and the Ca IR triplet. In the latest spectrum (409 d) SN emission features are still visible (namely [O i], [Fe ii] and [Ca ii] features) though heavily contaminated by narrow emission lines of an underlying H ii region (Hα, [N ii], [S ii]).
4.1.2. SN 2007pk
Figure 14 shows the photospheric evolution from a few days post explosion (~4 d) to about 3 months. Two spectra at 10 and 11 months were also obtained when the SN was barely visible and narrow lines from the underlying H ii region are mostly detected.
The first spectra (4 d–8 d) show a blue continuum with Hα and Hβ emission and no prominent absorption features. As reported in Parisky et al. (2007), these are the characteristics of Type IIn SN spectra. The prominent feature bluer of Hβ is identified as He ii λ4686 possibly blended with C iii/N iii like in the case of SN 1998S (Fassia et al. 2001). Broad Balmer absorptions begin to emerge on day 8 (although they are still weak).
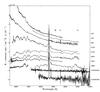 |
Fig. 14 Spectral evolution of SN 2007pk. Wavelengths are in the observer’s rest frame. The phase reported for each spectrum is relative to the explosion date (JD 2 454 412), late spectra have been multiplied by a factor 40 to emphasise the nebular lines. The ⊕ symbols mark the positions of the strongest telluric absorptions. The ordinate refers to the top spectrum; the other spectra are shifted downwards with respect to the previous one by 7 × 10-16, except the third, which is shifted by 1 × 10-15 erg s-1 cm-2 Å-1. |
The spectrum at 27 d shows well-developed P Cygni lines of metal elements such as Fe ii at ~4500 Å and Sc ii λ503. Also the Fe ii multiplet λλ4924, 5018, 5169 and Sc ii λ6245 are visible. The Na ID feature is blended with He i λ5876. The Hα and Hβ still show a dominant emission component with an absorption component comparable with those of other SNe II at the same phase. Nevertheless, the absorption profiles display flat, blue shoulders, possibly an evidence of a residual interaction of the SN ejecta with the CSM (see Chevalier 1982; Chevalier & Fransson 1994). For this reason, the 27 d spectrum may represent the rare snapshot of the spectral transition from a Type IIn to a normal, non-interacting Type II SN.
The last set of photospheric spectra (51 d–85 d) show the evolution of a canonical Type II during the H recombination phase. Fe i λ4541, Sc ii λ5527, Ba ii λ6142, Na ID, O i λ7774 are visible as well as the Ca ii NIR triplet (λλ8498, 8542, 8662). P Cygni line profiles of the Paschen series, in particular Paβ, Paγ and Paδ are visible in the day 66 NIR spectrum (Fig. 15). Paγ is blended with He i λ10 830.
The two late-time spectra (302 d to 330 d) do not show unequivocal SN features. The narrow unresolved emissions, i.e. Hα (Δv ~ 800 km s-1), [N ii] λ6583 and the [S ii] λλ6717, 6731 doublet, are probably related to the underlying H ii region.
4.1.3. SN 2010aj
The spectral evolution of SN 2010aj shown in Fig. 16 spans ~2 months during the photospheric phase, complemented by an additional observation in the nebular phase, about one year after the explosion.
The first spectrum shows the H Balmer lines (the P Cygni profile has a weak absorption component), He i λ5876, Ca ii H&K, Fe ii lines (λλ4924, 5018, 5169), and possibly Si ii λ6355, O i λ7774 and the Ca ii IR triplet. In the following three spectra (38 d–73 d) other metal lines become prominent, including Ti ii around 4100 Å, while Fe ii and Ba ii contribute to the feature at ~4930 Å. Fe i and Sc ii lines are also clearly detected at about 5500 Å, as well as Sc iiλ6245. The Na ID feature replaces He iλ5876. The H Balmer lines develop well-designed P Cygni profiles, always contaminated by the strong narrow components due to an underlying H ii region. We cannot perform a more detailed analysis because of the sparse temporal sampling.
The late-time spectrum does not show evidence of broad lines due to the SN. The Hα, Hβ, [O ii] and [S ii] unresolved (Δλ = 17 Å) lines are related to the host galaxy H ii region.
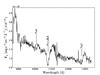 |
Fig. 15 NIR spectrum of SN 2007pk at ~66 d after the explosion date (JD 2 454 412). Wavelengths are in the observer’s rest-frame. |
4.1.4. SN 1995ad
The available spectra cover the period from one week to over 500 days after the explosion (see Fig. 18). The continuum is very blue at the first epoch and progressively becomes redder and the most prominent features are those usually detected in Type II SNe during the photospheric phase (H Balmer, He i/Na ID, Fe ii, Ca ii, Sc ii and other metal lines). Also the line profiles evolve in standard fashion, from broad P Cygni profiles at the early epochs to narrow emissions during the nebular phase. The Hα profile in the early phase (9 d–24 d) is reminiscent of that of SN 2007od at a similar stage with flat-topped emission and significant absorption only after day 24. Though one may argue that the flat profile is due to the CSM-ejecta interaction similar to SN 2007od (Inserra et al. 2012b, 2011), most likely the peculiar profile is the result of blending of the blue-shifted SN emission with the narrow emissions from the H ii region. Searching for possible signatures of interaction, we have investigated several high signal-to-noise spectra for the possible presence of HV features of Hα and Hβ with no conclusive results.
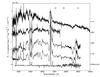 |
Fig. 16 Spectral evolution of SN 2010aj. Wavelengths are in the observer’s rest frame. The phases reported to the right are relative to the explosion epoch (JD 2 455 265.5), The late spectrum has been multiplied by a factor 4 to emphasise the features. The ⊕ symbols mark the positions of the strongest telluric absorptions. The ordinate refers to the top spectrum; other spectra are shifted downwards with respect to the previous one by 2 × 10-16 and 6 × 10-16 (only the third) erg s-1 cm-2 Å-1. |
The line identification during the plateau is shown in Fig. 17 for both SN 1995ad and SN 1996W, using spectra of high signal-to-noise and good resolution (FWHM ~ 10 Å). The spectra of SN 1995ad show the possible contribution of Ti ii lines in the bluer part (<4500 Å) of the spectrum. Also prominent are the lines of Ba ii, Fe ii and Sc ii around 5000 Å, the strong Sc iiλ5527 (possibly blended with Ba iλ5535) and λ6245, as well as the Ba iiλ5854 and λ6142. In the red wavelength, in addition to the evident Ca ii NIR triplet, we identify lines of O iλ7774, N i at ~8120 Å and O iλ9260. By comparison with SN 2009bw the absorption feature at 9030 Å may be due to C i. The presence of O lines becomes more evident in the subsequent spectra. Finally we note that [O i] and [Ca ii] emission of the SN are clearly visible in the nebular spectra despite the contamination of nebular lines from the underlying H ii region.
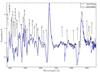 |
Fig. 17 Spectra of SN 1995ad at ~61 d and SN 1996W at ~67 d post explosion. The spectra were corrected for extinction and reported to the SN rest frame. The most prominent absorptions are labelled. |
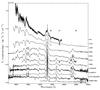 |
Fig. 18 Spectral evolution of SN 1995ad. Wavelengths are in the observer’s rest frame. The phase reported for each spectrum is relative to the explosion date (JD 2 449 981), late spectra have been multiplied by a factor 5 and 60 to emphasise the features. The ⊕ symbol marks the positions of the most significant telluric absorptions. The second and third spectra are shifted upwards by 1 × 10-15; the other ones are shifted downwards with respect to the previous by 0.7 × 10⁻¹⁵ erg s-1 cm-2 Å-1. |
4.1.5. SN 1996W
The observations (cf. Fig. 19) cover the first couple of months after the explosion, until the SN went behind the Sun. The object was recovered during the nebular phase (252–312 days).
The evolution matches fairly well that of normal Type IIP SNe, although the line velocities and the continuum temperatures are somewhat higher than in canonical SNe IIP at a comparable phase (see Table 9 and Sect. 4.2). Hα, Hβ and He i are visible in the early spectra and metal lines are detected since the 19 d spectrum. Also for this object the Hα profile appears flat-topped. However, contrary to SN 1995ad, in this case we have detected HV features of Hα and Hβ (cf. Sect. 5.1). Figure 17 shows the line identifications on the spectrum of day 67, which turn out very similar to those of SN 1995ad at a similar epoch.
Three late-time spectra sample the evolution in the nebular phase with the progressive growth of forbidden lines over permitted counterparts (e.g. [Ca ii] λλ7291-7324 doublet vs. Ca ii IR triplet).
4.2. Velocity and temperature evolution
The expansion velocities provide key information on the energetics of the explosion and the position of the photosphere inside the ejecta. In Fig. 20 we show the evolution of the expansion velocities for our SN sample as inferred from the positions of the minima of the P Cygni profiles for some representative lines (Hα, Hβ, He iλ 5876, Fe iiλ5169 and Sc iiλ6246). The measured expansion velocities are listed in Table 8. In all cases the velocities of Hα are systematically higher than those of Hβ. At very early epochs the Hα velocities are over 10 000 km s-1 in SNe 1995ad, 1996W and 2009dd, and decline very fast. The determination of the expansion velocity is problematic in SN 2007pk because of the lack of absorptions (cf. Sect. 4.1). The early velocities of the Balmer lines reported in Table 8 are derived from the FWHM of the emissions visible up to day +8.
The velocity of He i line, when visible, is significantly smaller than that of Hα. Fe ii and Sc ii are good indicators of the photospheric velocity and their values are the smallest among those measured. Sc ii remains always slower than Fe ii with vSc II ~ 0.9 × vFe II.
SN 1996W has metal line (photospheric) velocities that are a factor 1.5 higher than those of other SNe whilst the velocities deduced from H and He i (outer ejecta) are not remarkably different. The presence of a weak interaction could explain this behaviour (for details see Inserra et al. 2012b) and is supported by the presence of HV Hα at 11 500 km s-1 during the entire photospheric evolution (cf. Sect. 5.1).
In Fig. 21 we show the comparison of the Hα velocity evolutions in our SN sample with those of other classical SNe ii. All SNe show a similar behavior, with the exception of the low-luminosity SN 2005cs, that is clearly an outlier. In any case SN 1996W and SN 2009dd show the highest velocities at early epochs while during the mid-late photospheric phase all objects appear to be confined in a narrow strip of ±1000 km s-1.
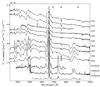 |
Fig. 19 Overall spectral evolution of SN 1996W. Wavelengths are in the observer’s rest frame. The phase reported for each spectrum is relative to the explosion date (JD 2 450 180), late spectra have been multiplied by a factor f5 and 20 to emphasise the features. The ⊕ symbol marks the positions of the most important telluric absorptions. The spectra are shifted with respect to the first one. |
 |
Fig. 20 Expansion velocities measured for the SNe of our sample, derived from the position of the P Cygni minima for the following lines: Hα, Hβ, He i λ5876, Fe ii λ5169 and Sc ii λ6246. The velocities of the Balmer lines of SN 2007pk up to day +8, derived by the FWHM of the narrow emissions (cf. Table 8), are not shown here. |
The bottom panel of the same figure reports the temperature evolution, as derived from the black-body fits to the spectral continua (see Table 8). The objects showing possible evidence of early interaction have, during the first 20 d, higher temperatures than the other SNe ii. After 40 d the measured temperature remains constant (T ~ 5500 K) for all objects.
Observed continuum temperatures and line velocities for the objects of our sample.
4.3. Comparative evolution
In panel a) of Fig. 22 we compare the early spectra of the SNe in our sample with those of other Type II events. SNe 1995ad and 1996W show flat-topped profiles which may be due to contamination of the narrow emission from underlying H ii regions (favoured for SN 1995ad, Sect. 4.1) or to interaction (as in SN 2007od, Inserra et al. 2011, 2012b). In the case of SN 1996W the latter is supported by the simultaneous presence of HV features (cf. Sect. 5.1). The emission profile of SN 2009dd is roundish and similar to that seen in SN 1999em. However, on the blue side of the Hα emission in SN 2009dd spectrum, three absorptions are clearly detected. To our knowledge, similar features have not been seen in other Type II SNe (at least with this strength). The bluest component was identified with Si ii λ6355 as in SN 2007od (Inserra et al. 2011, 2012b) and SN 2009bw (Inserra et al. 2012a). The central component might be a HV feature of Hα with v = 13 800 km s-1 or, alternatively, Fe ii λ6456 with an unusually high optical depth. Although there are no other clear spectral evidences, such as HV Hβ, the X-ray detection at early times (cf. Sect. 2) may support the interaction scenario. Also, the weak features on the blue side of the Hα and Hβ of SN 1996W could be related to HV layers at ~11 500 km s-1.
In panel (b) we compare the plateau phase spectra of the same objects. At this stage also SN 2009bw and SN 1999em show HV Hα at ~7300 km s-1 (Inserra et al. 2012a) and ~8200 km s-1 (Chugai et al. 2007), respectively. The weak HV Hα components of SN 2009dd and SN 1996W appear at velocity ~13 800 and ~11 500 km s-1, respectively, remaining steady during the early phases.
Panels c) and d) show the early and late photospheric spectra of SN 2007pk, the only SN of the sample with a clear evidence of interaction at early times. We compare the spectra with those of the Type IIn SN 1998S, the weakly interacting Type IIP SN 2007od and the Type IIn SN 2005gl, which have similar spectral evolution. The narrow H Balmer lines of SN 2007pk and the double-horned line at ~4600 Å, possibly related to highly ionised elements such as C iii/N iii or C iv, stand out over a very blue continuum. The similarity with SN 1998S is remarkable, but also SN 2005gl shared the same features. The weakly interacting SN 2007od had instead a definitely different spectral features.
As mentioned in Sect. 4.1, the spectrum of SN 2007pk evolves rapidly and already on day 50, during the plateau, it resembles closely those of standard Type IIPs. In panel (d) we compare late photospheric spectra of the same objects about two months past explosion. SN 2007pk and SN 2005gl have evolved in a similar fashion. Both show well-developed absorption components for the lines of all ions and deeper absorptions of the Balmer lines with respect to SN 1998S, while the lines of the ions of the inner ejecta like Fe ii and Sc ii seem to have the same strengths. The absorption component of Hα is significantly stronger in SN 2007od than in other objects.
 |
Fig. 21 Top: comparison of the Hα velocities of our SNe with those of other SNe II. Bottom: comparison of the continuum temperature evolutions |
 |
Fig. 22 Panel a) comparison between early spectra of SN 1995ad, SN 1996W and SN 2009dd, and those of the interacting SNe 1999em, 2007od and 2009bw, all showing signs of weak early interaction. Panel b) comparison of the same objects during the plateau phase. Panel c) comparison among early spectra of SN 2007pk, with those of other strongly- (SNe 1998S and 2005gl) and weakly-interacting (SN 2007od) SNe. Panel d) comparison of the same objects during the plateau phase. The phase of SN 2005gl has been adopted from Gal-Yam et al. (2007). |
5. Discussion
In previous Sections we presented new photometric and spectroscopic data of five SNe ii and discussed their evolution from the photospheric to the nebular phase.
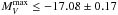
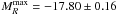
The SNe of our sample are relatively bright, with an average absolute peak magnitude MV ≤ −16.95 (i.e. Lpeak ~ 3 × 1042 erg s-1), above the average for SN II (Patat et al. 1994; Li et al. 2011). The light curves are characterized by extended plateaus, although SN 2007pk may be considered a transitional object between IIP and IIL. The expansion velocities of the ejecta, ranging from 10 000−12 000 km s-1 at early phases to ~5000 km s-1 at the end of the photospheric phase, are similar to those of other SNe ii, with the objects showing signs of interaction being moderately faster. The same is true for the temperature. There is a high degree of individuality in the shape of the light curve with the transition to the nebular stage occurring at different epochs and with different magnitude drops from the plateau. Also the inferred 56Ni masses span over one order of magnitude (1.4 × 10⁻¹ to 7 × 10⁻³ M⊙, cf. Sect. 3.4).
5.1. Signatures of interaction
SN 2009dd shows three absorption components in the blue side of Hα emission. The middle one 6235 Å is likely an HVHα component with v ~ 13 800 km s-1. Alternative identifications with metal lines (e.g. Si ii, Sc ii, Ba ii) are unlikely because the position of the absorption minimum would imply too low velocities (e.g. half of the Fe ii velocity). The putative HVHα feature, between the Si λ6355 (v ~ 9000 km s-1) and the main Hα absorption, mimic an unusual triple absorption profile.
 |
Fig. 23 Flux contribution of the UV (uvw2, uvm2, uvw1) to the total (UV-to-I) bolometric light curves of SN 2007pk and SN 2009dd compared to the weakly interacting SN 2007od and the non-interacting SN 2008in. |
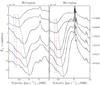 |
Fig. 24 Blow-up of the 4600 Å (left-hand panel) and 6200 Å (right-hand panel) spectral regions during the plateau phase of SN 1996W. The x-axes are in expansion velocity coordinates with respect to the rest-frame position of Hβ and Hα, respectively. To guide the eye, two dash-dotted lines are drawn in the spectra marking the position of minima of the strongest absorption features, while red dashed lines, at comparable velocities, follow the HV Hα and Hβ features (~11 500 km s-1). The blue dashed lines are tied to the second HV feature at ~12 500 km s-1, which is visible only in the Hα region. |
Two of the SNe of our sample, 2007pk and 2009dd were detected in X-ray, that is a bona fide indicator of ejecta-CSM interaction. The spectral evolution of SN 2007pk, with the detection of a narrow Hα in pure emission, suggests that interaction began very early after explosion but ended one month later. To our knowledge the only other object having a similar evolution was SN 2005gl (Gal-Yam et al. 2007; Gal-Yam & Leonard 2009). Considering the strong X-ray emission of SN 2007pk, 10 times larger than those of SN 2009dd and SN 1999em (Immler et al. 2009; Elmhamdi et al. 2003), we argue that the ejecta-CSM interaction was also quite strong.
In general, the shock produces soft X-ray or far-UV emission depending on the ejecta density profile, with flatter profiles leading to higher shock velocity, higher post-shock temperature and hence greater emission at higher frequency (Chevalier & Fransson 1994). Exploiting the fact that both SN 2009dd and SN 2007pk have been monitored by Swift, we could compute the UV contribution to the bolometric emission. This is shown in Fig. 23 in which the corresponding values for the mildly interacting SN 2007od and the non-interacting SN 2008in (Roy et al. 2011) are reported for comparison. At early times, when the X-ray flux was higher, the UV contribution of SN 2007pk was twice as strong as that of SN 2009dd, that can be attributed to a flatter density profile. However, the UV flux decreased rapidly, and on day 20 was comparable to that of other objects, a sign that the dense CSM material probably was already swept away at that time. Much slower is the evolution of the UV flux in SN 2009dd, that always remained significantly higher than in the other objects.
HV absorption components were identified on the spectra of a few SNe, e.g. SNe 1999em, 2004dj, 2007od and 2009bw. Chugai et al. (2007) have shown that the interaction of the ejecta of a SN IIP with an average RSG wind can produce absorptions (shoulders) on the blue wings of H lines due to enhanced excitation of the gas in the outer un-shocked ejecta. In the previous Sections we noted that similar features are present in SN 1996W. Their velocity evolution as shown in Fig. 24 remains constant with time. While the line positions at the earliest epochs are compatible with an Fe ii identification, the lack of velocity evolution, contrasting with the behaviour of the main Hα absorption, favours the HV identification.
Finally, two other objects, SNe 1995ad and 2010aj, did not show unequivocal signs of interaction.
5.2. Explosion and progenitor parameters
Using the well-tested approach applied to other CC-SNe (e.g. SNe 2007od, 2009bw, and 2009E; see Inserra et al. 2011, 2012, and Pastorello et al. 2012), we estimate the physical parameters describing the progenitors at the explosion (e.g. the ejected mass, the progenitor radius, and the explosion energy) by performing a model/observation comparison for our sample of CC-SNe. This is based on a simultaneous χ2 fit of the main CC-SN observables (namely, the bolometric light curve, the evolution of the photospheric velocity and the continuum temperature at the photosphere). We do not considered SNe 2007pk and 1996W because the observational data are not sufficient for obtaining reliable estimates of the ejecta parameters. In particular, their light curves do not cover the critical transition from the plateau to the radioactive tail.
Two codes are employed to calculate the parameters. The first is the semi-analytic code described in Zampieri et al. (2003), which is used to perform preparatory studies to explore the parameter space describing the CC-SN progenitor at the explosion. The second, used to compute a denser grid of more accurate models, is a new general-relativistic, radiation-hydrodynamics Lagrangian code (for details see Pumo et al. 2010; Pumo & Zampieri 2011). Its main features are: 1) an accurate treatment of radiative transfer coupled to relativistic hydrodynamics; 2) a self-consistent treatment of the evolution of ejected material taking into account both the gravitational effects of the compact remnant and the heating effects linked to the decays of the radioactive isotopes synthesized during the CC-SN explosion; and 3) a fully implicit Lagrangian approach to the solution of the coupled non-linear finite difference system of relativistic radiation-hydro equations.
The modelling with these two codes is appropriate if the emission from the CC-SN is dominated by the expanding ejecta. As we mentioned before for some of the SNe of our sample, there may be contamination from interaction. In the following we assume that this effect does not dominate the quasi-bolometric luminosity and therefore the modelling produces reasonable estimates of the main physical parameters of the explosive events, although it may not be possible to precisely reproduce all the observed features (see below).
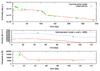 |
Fig. 25 Comparison of the evolution of the main observables of SN 2009dd with the best-fit models computed with the general-relativistic, radiation-hydrodynamics code (total energy ~ 0.2 foe, initial radius 5 × 1013 cm, envelope mass 8 M⊙). Top, middle, and bottom panels show the quasi-bolometric light curve, the photospheric velocity (the blue dashed line refers to the model plus an additive constant to match the data), and the photospheric temperature as a function of time. To estimate the photospheric velocity from observations, we used the value inferred from the Fe ii lines (see text for further details). The x −axes refer to days since explosion. |
The best-fitting models for each SN are reported in Figs. 25−27, and their parameters are listed in Table 9.
Main information on the SN sample.
The agreement between the models and the observed light curves and photospheric temperatures are quite satisfactory, except at early epochs (≲20–40 d). Such discrepancies at early times are caused both by approximate initial density profiles used in the simulations, which do not reproduce accurately the radial profiles of the outermost high-velocity shells of the ejecta formed after shock breakout (cf. Pumo & Zampieri 2011) and, possibly, by ejecta-CSM interaction leading to luminosity excesses (see also Inserra et al. 2012a, and references therein). For these reasons, we do not include in the χ2 fit the line velocity measurements taken during the first 20–40 d.
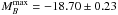
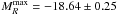
The agreement between the observed velocity evolution and our best-fit models is less satisfactory. This may be related to a systematic shift between the true photospheric velocity and the value estimated from the observed P Cygni line profiles (see Dessart & Hillier 2005), according to which the optical depth in the lines seems to be higher than that in the continuum, moving the line photosphere to a larger radius. Such effect may be enhanced in case of ejecta/CSM interaction. We noticed that in the case of SN 2009dd in which evidence for interaction is stronger, the discrepancy is larger, ~ 3000 km s-1 (blue dashed line in Fig. 25).
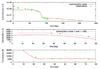 |
Fig. 26 As for Fig. 25, but for SN 2010aj. The best-fit model evaluated using the general-relativistic, radiation-hydrodynamics code has an initial radius of 2 × 1013 cm, a total energy ~ 0.55 foe, and an envelope mass of 9.5 M⊙. |
Taking in mind these caveats, we may elaborate on the physical parameters for the modelled SNe. The parameters of SN 2010aj (moderate ejecta mass, low amount of 56Ni, and low explosion energy), may be consistent with a scenario of explosion and mass loss from a massive super-asymptotic giant branch3 (SAGB) stars with an initial (ZAMS) mass close to the upper limit for this class of stars (~ 11 M⊙; see Pumo et al. 2009, for details). For SN 1995ad, the values of the inferred parameters may be consistent with both SAGB progenitors and Fe CC progenitors with initial masses close to the lower limit. Both scenarios may be plausible, even if the former poorly explains the relatively high amounts of 56Ni (compared to what expected in SNe from SAGB progenitors; e.g. Wanajo et al. 2009) and the latter may not account for the relatively low ejecta mass of SN 1995ad and the CO molecules observed during the nebular phase (Spyromilio & Leibundgut 1996).
In this context it can be useful to compare the results of the SN data modelling with those derived from an independent diagnostic. In nebular spectra of CC-SNe, the flux ratio R = [Ca ii] λλ7291,7324/[O i] λλ6300,6364 is a useful tool for guessing the mass of the core and, consequently, that of the progenitor. As a genearal trend, small R ratios correspond to higher core masses and, hence, to higher main sequence masses (Fransson & Chevalier 1989, 1987). For the two peculiar Type IIP SNe 1987A and 2005cs the R ratios are R ~ 3 (Elmhamdi et al. 2003) and R ~ 4.2 (Pastorello et al. 2009), respectively, while for the canonical Type IIP SNe 1992H and 1999em we find R ~ 1.6 and R ~ 4.7, respectively. These measurements would suggest higher core masses for SNe 1987A and 1992H, and lower masses for SNe 2005cs and 1999em. In addition, other indicators (e.g. SN data modelling, study of the progenitors in pre-explosion images) suggest that the two former objects have MZAMS of about 20 M⊙, whilst the latter (SNe 2005cs and 1999em) have lower mass precursors (~10 M⊙, Smartt et al. 2009). We estimated the ratio R also for SN 1995ad and SN 1996W, obtaining R ~ 4.0 and R ~ 2.3, respectively. This would point toward a somewhat more massive progenitor for SN 1996W, and a lower mass for the precursor of SN 1995ad, that would be quite similar to those of SNe 2005cs and 1999em, and in good agreement with that indicated by the above modelling. We have to remark, however, that these measurements have to be taken with caution, since Maguire et al. (2012) have recently questioned the robustness of the relation between the progenitor mass and the observed flux ratio R.
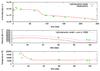 |
Fig. 27 As for Fig. 25, but for SN 1995ad. The best-fit model evaluated using the general-relativistic, radiation-hydrodynamics code has an initial radius of 4 × 1013 cm, a total energy ~ 0.2 foe, and an envelope mass of 5 M⊙. |
6. Conclusions
In this paper we have presented photometric and spectroscopic observations of three recent Type II SNe (2007pk, 2009dd and 2010aj) and previously unpublished data of SNe 1995ad and 1996W. Together with SNe 2007od and 2009bw (recently studied by our group, Inserra et al. 2011, 2012a) they belong to a group of moderately bright Type II SNe.
The light curves show peak magnitudes between MB ≤ −16.95 and durations of the plateau, between 30 and 70 days. At late times three objects follow the decline rates of 56Co to 56Fe, allowing us to determine the ejected masses of 56Ni (between 0.028 and 0.140 M⊙). For another object, SN 2010aj, the observations ended before the final onset of the radioactive tail, thus allowing us to derive only an upper limit M(56Ni)< 0.007 M⊙. No late-time observations are available for SN 2007pk.
With the noticeable exception of SN 2007pk during the earliest epochs, the spectra of all the objects evolve like normal Type II SNe in terms of spectral features, expansion velocities, and blackbody temperatures. SN 2007pk was somewhat different, showing after the discovery a featureless blue continuum, resolved narrow Balmer line in emission, significant X-ray flux and UV excess, all pointing toward relatively strong ejecta-CSM interaction. After one month the evidences of interaction ceased, and the SN followed afterward a normal evolution. SN 2007pk reached the brightest absolute magnitude (MB = −18.70) among the objects studied here and showed the fastest luminosity decline, intermediate between SNe IIL and SNe IIP.
Hints of interaction with the CSM have been found for other two objects, SN 2009dd and SN 1996W. SN 2009dd was detected by Swift XRT in the 0.2–10 keV range, at a luminosity lower than that of SN 2007pk. It also showed an high UV contribution to the bolometric luminosity. SN 1996W was photometrically and spectroscopically a normal SN IIP. The extended coverage at late time has allowed us to derive an ejected M(56Ni)= 0.14 M⊙for this object, which is the largest in our sample.
The remaining two objects, SN 2010aj and SN 1995ad, did not show evident signs of interaction. SN 2010aj showed the largest drop from the plateau and a decline rate in the earliest part of the radioactive tail that may be attributed to early dust formation. Unfortunately, the available observations can not prove the dust formation hypothesis. If the observed luminosity at about 100 d is governed only by the 56Ni decay, the ejected mass of 56Ni is M(56Ni)≤ 0.007 M⊙. SN 1995ad has been extensively observed both at early and late time and behaved like a normal non-interacting SN II. Dust formation has been suggested at late times (t > 200 d) because of an increase in the slope of the light curve and of the detection of CO.
The modeling with our code (Sect. 5.2) has allowed the determination of the main parameters of the explosions and of the progenitors for SNe 2009dd, 2010aj and 1995ad, (reported in Table 9). The masses of the ejecta are in the range of 5.0−9.5 M⊙, corresponding to total masses at the moment of the explosion of the order of 7.0−11.5 M⊙. A low mass progenitor for SN 1995ad is also indicated by the high value of flux ratio R of [Ca ii] over [O i] (Sect. 5.1). Despite some discrepancy with the fits (see Sect. 5.2), the results are consistent with either SNe from SAGB stars or RSGs exploded as Fe CC-SNe. The SAGB scenario seems more appropriate for SN 2010aj because of the moderate ejected mass, the low amount of 56Ni and the low explosion energy. Both progenitor scenarios are equally plausible for the other two objects. While there is evidence of interaction for SN 2009dd, some weak interaction for SN 1995ad and SN 2010aj could explain the disagreement found in the velocity evolution with respect to the theoretical models.
Our models could not be applied to SN 2007pk and SN 1996W because the available data do not cover the crucial feature of the light curves, i.e. the transition from the plateau to the radioactive tail that marks the end of the recombination phase. Observations of SN 2007pk cover the first few months when the object transformed from a strongly interacting Type IIn with a linear light curve to a normal Type II. Nothing can be said on the nature of the progenitor because the interaction with the CSM is governed by recent episodes of mass-loss. Indication on the mass of the progenitor of SN 1996W comes from the large ejected 56Ni mass (0.14 M⊙) and from the flux ratio of [Ca ii] over [O i], both pointing to a relatively large initial mass (15−20 M⊙).
Altogether these objects share the common property of having relatively bright peak luminosity, which is not – anyway – as extreme as the peculiar SN 2009kf (Botticella et al. 2010) that, indeed, pointed toward different explosion mechanisms. The light curves of these mildly luminous objects can be different as to shape (linear vs. plateau), drop to the radioactive tail and late time luminosity. In addition, their spectral characteristics show some individuality, e.g. transition from Type IIn to normal Type II or peculiar line profiles. In a few cases, thanks to a deeper investigation, the presence of HV features or dust formation has been revealed. All of this indicates a significant heterogeneity in luminous SNe II, and the only possible common property seems to be some minor signs of weak ejecta-CSM interaction.
Image Reduction and Analysis Facility, distributed by the National Optical Astronomy Observatories, which are operated by the Association of Universities for Research in Astronomy, Inc, under contract to the National Science Foundation.
NASA’s High Energy Astrophysics Science Archive Research Center.
We remind that these stars, after having ignited H-, He-, and C-burning, are able to form a degenerate neon-oxygen core (e.g. Pumo 2006, 2007, and references therein), where the physical conditions can be suitable for triggering electron-capture reactions on 24Mg and other nuclei which are present in trace amounts in the core, leading to a so-called electron-capture supernova (EC-SN) event (e.g. Pumo et al. 2009, and references therein).
Acknowledgments
We thank an anonymous referee for the useful suggestion that help us for improving the paper. C.I., S.B., F.B., E.C. and M.T. are partially supported by the PRIN-INAF 2011 with the project “Transient Universe”. M.L.P. acknowledges the financial support by the Bonino-Pulejo Foundation and from the contract ASI-INAF n. I/009/10/0 (CUP:F71J10000020005). The TriGrid VL project, the “consorzio COMETA” and the INAF – Padua Astronomical Observatory are also acknowledged for computer facilities. This work is partially based on observations of the European supernova collaboration involved in the ESO-NTT large programme 184.D-1140 led by Stefano Benetti. F.B. acknowledges support from FONDECYT through Postdoctoral grant 3120227 and from the Millennium Center for Supernova Science through grant P10-064-F (funded by “Programa Bicentenario de Ciencia y Tecnologìa de CONICYT” and “Programa Iniciativa Cientìfica Milenio de MIDEPLAN”) S.T. acknowledges support by the Transregional Collaborative Research Cebter TRR33 “The Dark Universe” of the German Research Fondation (DFG). N.E.R. acknowledges support by the MICINN grant AYA11-24704/ESP, by the ESF EUROCORES Program EuroGENESIS (MICINN grant EUI2009-04170), by SGR grants of the Generalitat de Catalunya, and by EU-FEDER funds. This research has made use of the NASA/IPAC Extragalactic Database (NED) which is operated by the Jet Propulsion Laboratory, California Institute of Technology, under contract with the National Aeronautics and Space Administration. We acknowledge the usage of the HyperLeda database (http://leda.univ-lyon1.fr). We also thank the High Energy Astrophysics Science Archive Research Center (HEASARC), provided by NASA’s Goddard Space Flight Center, for the Swift data.
References
- Arnett, W. D. 1996, Supernovae and Nucleosynthesis (Princeton: Princeton University Press) [Google Scholar]
- Arnett, W. D., Bahcall, J. N., Kirshner, R. P., & Woosley, S. E. 1989, ARA&A, 27, 629 [NASA ADS] [CrossRef] [Google Scholar]
- Asplund, M., Grevesse, N., Sauval, A. J., & Scott, P. 2009, ARA&A, 47, 481 [NASA ADS] [CrossRef] [Google Scholar]
- Balinskaia, I. S., Bychkov, K. V., & Neizvestnyi, S. I. 1980, A&A, 85, L19 [NASA ADS] [Google Scholar]
- Barbon, R., Ciatti, F., & Rosino, L. 1979, A&A, 72, 287 [Google Scholar]
- Baron, E., Branch, D., Hauschildt, P. H., et al. 2000, ApJ, 545, 444 [NASA ADS] [CrossRef] [Google Scholar]
- Botticella, M. T., Trundle, C., Pastorello, A., et al. 2010, ApJ, 717, L52 [NASA ADS] [CrossRef] [Google Scholar]
- Broughton, J. 1998, IAU Circ., 6852, 2 [NASA ADS] [Google Scholar]
- Cappellaro, E., Danziger, I. J., & Turatto, M. 1995, MNRAS, 277, 106 [NASA ADS] [Google Scholar]
- Cappellaro, E., Mazzali, P. A., Benetti, S., et al. 1997, A&A, 328, 203 [NASA ADS] [Google Scholar]
- Cenko, S. B., Cobb, B. E., Kleiser, I. K., & Filippenko, A. V. 2010, Central Bureau Electronic Telegrams, 2209, 1 [NASA ADS] [Google Scholar]
- Chandra, P., & Soderberg, A. 2007, The Astronomer’s Telegram, 1271, 1 [NASA ADS] [Google Scholar]
- Chevalier, R. A. 1982, ApJ, 258, 790 [Google Scholar]
- Chevalier, R. A., & Fransson, C. 1994, ApJ, 420, 268 [NASA ADS] [CrossRef] [Google Scholar]
- Chugai N. N., 1994, Circumstellar Media in Late Stages of Stellar Evolution, eds. R. E. S. Clegg, I. R., Stevens, & W. P. S., Meikle, 148 [Google Scholar]
- Chugai, N. N., Chevalier, R. A., & Utrobin, V. P. 2007, ApJ, 662, 1136 [NASA ADS] [CrossRef] [EDP Sciences] [Google Scholar]
- Clocchiatti, A., Benetti, S., Wheeler, J. C., et al. 1996, AJ, 111, 1286 [NASA ADS] [CrossRef] [Google Scholar]
- Cortini, G., & Dimai, A. 2009, CBET, 1764, 1 [NASA ADS] [Google Scholar]
- Dessart, L., & Hillier, D. J. 2005, A&A, 439, 671 [NASA ADS] [CrossRef] [EDP Sciences] [Google Scholar]
- Elias-Rosa, N., van Dyk, S. D., Agnoletto, I., & Benetti, S. 2009, CBET, 1765, 1 [NASA ADS] [Google Scholar]
- Elmhamdi, A., Danziger, I. J., Chugai, N., et al. 2003, MNRAS, 338, 939 [NASA ADS] [CrossRef] [Google Scholar]
- Evans, R., Benetti, S., & Grupe, D. 1995, IAU Circ., 6239, 1 [NASA ADS] [Google Scholar]
- Fassia, A., Meikle, W. P. S., Chugai, N., et al. 2001, MNRAS, 325, 907 [NASA ADS] [CrossRef] [Google Scholar]
- Fransson, C., & Chevalier, R. A. 1987, ApJ, 322, L15 [NASA ADS] [CrossRef] [Google Scholar]
- Fransson, C., & Chevalier, R. A. 1989, ApJ, 343, 323 [NASA ADS] [CrossRef] [Google Scholar]
- Gal-Yam, A., & Leonard, D. C. 2009, Nature, 458, 865 [NASA ADS] [CrossRef] [PubMed] [Google Scholar]
- Gal-Yam, A., Leonard, D. C., Fox, D. B., et al. 2007, ApJ, 656, 372 [NASA ADS] [CrossRef] [Google Scholar]
- Hakobyan, A. A., Mamon, G. A., Petrosian, A. R., Kunth, D., & Turatto, M. 2009a, A&A, 508, 1259 [NASA ADS] [CrossRef] [EDP Sciences] [Google Scholar]
- Hakobyan, A. A., Petrosian, A. R., Mamon, G. A., et al. 2009b, Astrophysics, 52, 40 [NASA ADS] [CrossRef] [Google Scholar]
- Hakobyan, A. A., Adibekyan, V. Z., Aramyan, L. S., et al. 2012, A&A, 544, A81 [NASA ADS] [CrossRef] [EDP Sciences] [Google Scholar]
- Hamuy, M. 2003, ApJ, 582, 905 [NASA ADS] [CrossRef] [Google Scholar]
- Harutyunyan, A. H., Pfahler, P., Pastorello, A., et al. 2008, A&A, 488, 383 [NASA ADS] [CrossRef] [EDP Sciences] [Google Scholar]
- Heger, A., Fryer, C. L., Woosley, S. E., Langer, N., & Hartmann, D. H. 2003, ApJ, 591, 288 [NASA ADS] [CrossRef] [Google Scholar]
- Immler, S., Russell, B. R., & Brown, P. J. 2009, The Astronomer’s Telegram 2106, 1 [Google Scholar]
- Immler, S., Pooley, D., Brown, P. J., Li, W., & Filippenko, A. V. 2007, The Astronomer’s Telegram, 1284, 1 [NASA ADS] [Google Scholar]
- Inserra, C., Turatto, M., Pastorello, A., et al. 2011, MNRAS, 417, 261 [NASA ADS] [CrossRef] [Google Scholar]
- Inserra, C., Turatto, M., Pastorello, A., et al. 2012a, MNRAS, 422, 1122 [NASA ADS] [CrossRef] [Google Scholar]
- Inserra, C., Baron, E., & Turatto, M. 2012b, MNRAS, 422, 1178 [NASA ADS] [CrossRef] [Google Scholar]
- Landolt, A. U. 1992, AJ, 104, 340 [NASA ADS] [CrossRef] [Google Scholar]
- Li, W. D., Qiu, Y. L., Qiao, Q. Y., et al. 1996, IAU Circ., 6379, 1 [NASA ADS] [Google Scholar]
- Li, W., Jha, S., Filippenko, A. V., et al. 2006, PASP, 118, 37 [NASA ADS] [CrossRef] [Google Scholar]
- Li, W., Leaman, J., Chornock, R., et al. 2011, MNRAS, 412, 1441 [NASA ADS] [CrossRef] [Google Scholar]
- Maguire, K., di Carlo, E., Smartt, S. J., et al. 2010, MNRAS, 404, 981 [NASA ADS] [CrossRef] [Google Scholar]
- Maguire, K., Jerkstrand, A., Smartt, S. J., et al. 2012, MNRAS, 420, 3451 [NASA ADS] [CrossRef] [Google Scholar]
- McNaught, R. H., & Pollas, C. 1995, IAU Circ., 6242, 2 [NASA ADS] [Google Scholar]
- Milisavljevic, D., Fesen, R. A., Kirshner, R. P., & Challis, P. 2009, ApJ, 692, 839 [NASA ADS] [CrossRef] [Google Scholar]
- Milisavljevic, D., Fesen, R., Chevalier, R., et al. 2012, ApJ, 751, 25 [NASA ADS] [CrossRef] [Google Scholar]
- Moriya, T., Tominaga, N., Blinnikov, S. I., Baklanov, P. V., & Sorokina, E. I. 2011, MNRAS, 415, 199 [NASA ADS] [CrossRef] [Google Scholar]
- Mould, J. R., Huchra, J. P., Freedman, W. L., et al. 2000, ApJ, 529, 786 [NASA ADS] [CrossRef] [Google Scholar]
- Newton, J., Puckett, T., & Orff, T. 2010, Central Bureau Electronic Telegrams, 2201, 1 [NASA ADS] [Google Scholar]
- Parisky, X., Li, W., Filippenko, A. V., Silverman, J. M., & Foley, R. J. 2007, Central Bureau Electronic Telegrams, 1129, 1 [NASA ADS] [Google Scholar]
- Pastorello, A., Zampieri, L., Turatto, M., et al. 2004, MNRAS, 347, 74 [NASA ADS] [CrossRef] [Google Scholar]
- Pastorello, A., Valenti, S., Zampieri, L., et al. 2009, MNRAS, 394, 2266 [NASA ADS] [CrossRef] [Google Scholar]
- Pastorello, A., Pumo, M. L., Navasardyan, H., et al. 2012, A&A, 537, A141 [NASA ADS] [CrossRef] [EDP Sciences] [Google Scholar]
- Patat, F., Barbon, R., Cappellaro, E., & Turatto, M. 1994, A&A, 282, 731 [NASA ADS] [Google Scholar]
- Pettini, M., & Pagel, B. E. J. 2004, MNRAS, 348, L59 [NASA ADS] [CrossRef] [Google Scholar]
- Pignata, G., Patat, F., Benetti, S., et al. 2004, MNRAS, 355, 178 [NASA ADS] [CrossRef] [Google Scholar]
- Poole, T. S., Breeveld, A. A., Page, M. J., et al. 2008, MNRAS, 383, 627 [NASA ADS] [CrossRef] [Google Scholar]
- Poznanski, D., Prochaska, J. X., & Bloom, J. S. 2012, MNRAS, 426, 1465 [NASA ADS] [CrossRef] [Google Scholar]
- Pritchard, T. A., Roming, P. W. A., Brown, P. J., et al. 2012, ApJ, 750, 128 [NASA ADS] [CrossRef] [Google Scholar]
- Pumo, M. L. 2006, Ph.D. Thesis, Univ. Catania [Google Scholar]
- Pumo, M. L. 2007, Mem. Soc. Astron. Italiana, 78, 689 [NASA ADS] [Google Scholar]
- Pumo, M. L., & Zampieri, L. 2011, ApJ, 741, 41 [NASA ADS] [CrossRef] [Google Scholar]
- Pumo, M. L., Turatto, M., Botticella, M. T., et al. 2009, ApJ, 705, L138 [NASA ADS] [CrossRef] [Google Scholar]
- Pumo, M. L., Zampieri, L., & Turatto, M. 2010, Mem. Soc. Astron. It. Supp., 14, 123 [Google Scholar]
- Richardson, D., Branch, D., Casebeer, D., et al. 2002, SN 2010aj, 123, 745 [Google Scholar]
- Roy, R., Kumar, B., Benetti, S., et al. 2011, ApJ, 736, 76 [NASA ADS] [CrossRef] [Google Scholar]
- Schlegel, D. J., Finkbeiner, D. P., & Davis, M. 1998, ApJ, 500, 525 [NASA ADS] [CrossRef] [Google Scholar]
- Schlegel, E. M. 1990, MNRAS, 244, 269 [NASA ADS] [Google Scholar]
- Smartt, S. J. 2009, ARA&A, 47, 63 [NASA ADS] [CrossRef] [Google Scholar]
- Smartt, S. J., Eldridge, J. J., Crockett, R. M., & Maund, J. R. 2009, MNRAS, 395, 1409 [NASA ADS] [CrossRef] [Google Scholar]
- Spyromilio, J., & Leibundgut, B. 1996, MNRAS, 283, L89 [NASA ADS] [CrossRef] [Google Scholar]
- Stockdale, C. J., Weiler, K. W., Immler, S., et al. 2009, The Astronomer’s Telegram, 2016, 1 [NASA ADS] [Google Scholar]
- Stritzinger, M., Hamuy, M., Suntzeff, N. B., et al. 2002, SN 2010aj, 124, 2100 [Google Scholar]
- Suntzeff, N. B., Ruiz, M.-T., & Depoy, D. 1996, IAU Circ., 6380, 2 [NASA ADS] [Google Scholar]
- Turatto, M. 2003, Supernovae and Gamma-Ray Bursters, Ed. K. Weiler., Lect. Notes Phys., 598, 21 [Google Scholar]
- Turatto, M., Benetti, S., & Cappellaro, E., 2003, in ESO Astrophys. Symp. XVII, From Twilight to Highlight: the Physics of Supernovae, eds. W. Hillebrandt, & B. Leibundgut (Berlin: Springer-Verlag), 200 [Google Scholar]
- Wanajo, S., Nomoto, K., Janka, H.-T., Kitaura, F. S., & Mülller, B. 2009, ApJ, 695, 208 [NASA ADS] [CrossRef] [Google Scholar]
- Woosley, S. E., & Weaver, T. A. 1986, ARA&A, 24, 205 [NASA ADS] [CrossRef] [Google Scholar]
- Woosley, S. E., Hartmann, D., & Pinto, P. A. 1989, ApJ, 346, 395 [NASA ADS] [CrossRef] [Google Scholar]
- Woosley, S. E., Heger, A., & Weaver, T. A. 2002, Rev. Mod. Phys., 74, 1015 [NASA ADS] [CrossRef] [Google Scholar]
- Zampieri, L., Pastorello, A., Turatto, M., et al. 2003, MNRAS, 338, 711 [NASA ADS] [CrossRef] [Google Scholar]
- Zampieri, L., Mucciarelli, P., Pastorello, A., et al. 2005, MNRAS, 364, 1419 [NASA ADS] [CrossRef] [Google Scholar]
Appendix A: Appendix A
Journal of spectroscopic observations of the SNe in our sample.
All Tables
Observed continuum temperatures and line velocities for the objects of our sample.
All Figures
|
Fig. 1 R band image of SN 2009dd in NGC 4088 obtained with CAHA+CAFOS on November 19th, 2009. The sequence of stars used to calibrate the optical and NIR magnitudes is indicated. |
| In the text | |
|
Fig. 2 R band image of SN 2007pk in NGC 579 obtained with NOT+ALFOSC on January 11th, 2008. The sequence of stars in the field used to calibrate the optical magnitude of the 2007pk is indicated. |
| In the text | |
|
Fig. 3 R band image of SN 2010aj in MGC-01-32-035 obtained with TNG+DOLORES on May 22th, 2010. The sequence of stars in the field used to calibrate the optical and NIR magnitudes of SN 2010aj is indicated. |
| In the text | |
|
Fig. 4 R band image of SN 1995ad in NGC 2139 obtained with ESO 3.6 m+EFOSC1 on December 29th, 1995. The sequence of stars in the field used to calibrate the optical magnitudes of SN 1995ad is indicated. |
| In the text | |
|
Fig. 5 R band image of SN 1996W in NGC 4027 obtained with the Dutch 0.9 m telescope on May 13th, 1996. The local sequence of stars used to calibrate the optical magnitude is indicated. |
| In the text | |
|
Fig. 6 Synoptic view of the light curves of SN 2009dd in uv and optical bands. Magnitude shifts for the different bands are in the legend. |
| In the text | |
|
Fig. 7 Synoptic view of the light curves of SN 2007pk in all available bands. The magnitude shifts with respect to the values reported in Table 3 are listed in the insert. |
| In the text | |
|
Fig. 8 Light curves of SN 2010aj in optical bands. The magnitude shifts with respect to the values reported in Table 4 are in the legend. |
| In the text | |
|
Fig. 9 Light curves of SN 1995ad in uv and optical bands. The magnitude shifts with respect to the original value reported in Table 5 are in the insert. |
| In the text | |
|
Fig. 10 Light curves of SN 1996W in all available bands. Shifts compared to the original values reported in Table 6 are in the legend. |
| In the text | |
|
Fig. 11 Comparison of the dereddened colours of our sample of SNe and those of SNe 1987A, 2005cs, 1999em, 2004et, 2007od and 2009bw. The phase of SN 1987A is with respect to the explosion date. |
| In the text | |
|
Fig. 12 Comparison of quasi-bolometric light curves of our sample (UBVRI-integrated for SN 2009dd, SN 2007pk, SN 2010aj and SN 1996W and BVRI-integrated for SN 1995ad) with those of other Type II SNe; most of them are bright and thus different from the general distribution in luminosity of Type II SNe. The phase is with respect to the maximum, only for SN 1987A is with respect to the explosion epoch. Minor misalignments in the epoch of maxima are due to the different epochs adopted for the maxima of the reference band light curve and the quasi-bolometric curve. On the right a blow up of the SNe of our sample in the first 80 d. |
| In the text | |
|
Fig. 13 Complete spectral evolution of SN 2009dd. Wavelengths are in the observer’s rest-frame. The phase for each spectrum is relative to the adopted explosion date (JD 2 454 925.5), late spectra have been multiplied by a factor 5 to emphasise the nebular lines. The ⊕ symbols mark the positions of the strongest telluric absorptions. The ordinate refers to the top spectrum; the other spectra are shifted downwards by 4 × 10-15 (second and third) and 1.4 × 10⁻¹⁵ (others) erg s-1 cm-2 Å-1. |
| In the text | |
|
Fig. 14 Spectral evolution of SN 2007pk. Wavelengths are in the observer’s rest frame. The phase reported for each spectrum is relative to the explosion date (JD 2 454 412), late spectra have been multiplied by a factor 40 to emphasise the nebular lines. The ⊕ symbols mark the positions of the strongest telluric absorptions. The ordinate refers to the top spectrum; the other spectra are shifted downwards with respect to the previous one by 7 × 10-16, except the third, which is shifted by 1 × 10-15 erg s-1 cm-2 Å-1. |
| In the text | |
|
Fig. 15 NIR spectrum of SN 2007pk at ~66 d after the explosion date (JD 2 454 412). Wavelengths are in the observer’s rest-frame. |
| In the text | |
|
Fig. 16 Spectral evolution of SN 2010aj. Wavelengths are in the observer’s rest frame. The phases reported to the right are relative to the explosion epoch (JD 2 455 265.5), The late spectrum has been multiplied by a factor 4 to emphasise the features. The ⊕ symbols mark the positions of the strongest telluric absorptions. The ordinate refers to the top spectrum; other spectra are shifted downwards with respect to the previous one by 2 × 10-16 and 6 × 10-16 (only the third) erg s-1 cm-2 Å-1. |
| In the text | |
|
Fig. 17 Spectra of SN 1995ad at ~61 d and SN 1996W at ~67 d post explosion. The spectra were corrected for extinction and reported to the SN rest frame. The most prominent absorptions are labelled. |
| In the text | |
|
Fig. 18 Spectral evolution of SN 1995ad. Wavelengths are in the observer’s rest frame. The phase reported for each spectrum is relative to the explosion date (JD 2 449 981), late spectra have been multiplied by a factor 5 and 60 to emphasise the features. The ⊕ symbol marks the positions of the most significant telluric absorptions. The second and third spectra are shifted upwards by 1 × 10-15; the other ones are shifted downwards with respect to the previous by 0.7 × 10⁻¹⁵ erg s-1 cm-2 Å-1. |
| In the text | |
|
Fig. 19 Overall spectral evolution of SN 1996W. Wavelengths are in the observer’s rest frame. The phase reported for each spectrum is relative to the explosion date (JD 2 450 180), late spectra have been multiplied by a factor f5 and 20 to emphasise the features. The ⊕ symbol marks the positions of the most important telluric absorptions. The spectra are shifted with respect to the first one. |
| In the text | |
|
Fig. 20 Expansion velocities measured for the SNe of our sample, derived from the position of the P Cygni minima for the following lines: Hα, Hβ, He i λ5876, Fe ii λ5169 and Sc ii λ6246. The velocities of the Balmer lines of SN 2007pk up to day +8, derived by the FWHM of the narrow emissions (cf. Table 8), are not shown here. |
| In the text | |
|
Fig. 21 Top: comparison of the Hα velocities of our SNe with those of other SNe II. Bottom: comparison of the continuum temperature evolutions |
| In the text | |
|
Fig. 22 Panel a) comparison between early spectra of SN 1995ad, SN 1996W and SN 2009dd, and those of the interacting SNe 1999em, 2007od and 2009bw, all showing signs of weak early interaction. Panel b) comparison of the same objects during the plateau phase. Panel c) comparison among early spectra of SN 2007pk, with those of other strongly- (SNe 1998S and 2005gl) and weakly-interacting (SN 2007od) SNe. Panel d) comparison of the same objects during the plateau phase. The phase of SN 2005gl has been adopted from Gal-Yam et al. (2007). |
| In the text | |
|
Fig. 23 Flux contribution of the UV (uvw2, uvm2, uvw1) to the total (UV-to-I) bolometric light curves of SN 2007pk and SN 2009dd compared to the weakly interacting SN 2007od and the non-interacting SN 2008in. |
| In the text | |
|
Fig. 24 Blow-up of the 4600 Å (left-hand panel) and 6200 Å (right-hand panel) spectral regions during the plateau phase of SN 1996W. The x-axes are in expansion velocity coordinates with respect to the rest-frame position of Hβ and Hα, respectively. To guide the eye, two dash-dotted lines are drawn in the spectra marking the position of minima of the strongest absorption features, while red dashed lines, at comparable velocities, follow the HV Hα and Hβ features (~11 500 km s-1). The blue dashed lines are tied to the second HV feature at ~12 500 km s-1, which is visible only in the Hα region. |
| In the text | |
|
Fig. 25 Comparison of the evolution of the main observables of SN 2009dd with the best-fit models computed with the general-relativistic, radiation-hydrodynamics code (total energy ~ 0.2 foe, initial radius 5 × 1013 cm, envelope mass 8 M⊙). Top, middle, and bottom panels show the quasi-bolometric light curve, the photospheric velocity (the blue dashed line refers to the model plus an additive constant to match the data), and the photospheric temperature as a function of time. To estimate the photospheric velocity from observations, we used the value inferred from the Fe ii lines (see text for further details). The x −axes refer to days since explosion. |
| In the text | |
|
Fig. 26 As for Fig. 25, but for SN 2010aj. The best-fit model evaluated using the general-relativistic, radiation-hydrodynamics code has an initial radius of 2 × 1013 cm, a total energy ~ 0.55 foe, and an envelope mass of 9.5 M⊙. |
| In the text | |
|
Fig. 27 As for Fig. 25, but for SN 1995ad. The best-fit model evaluated using the general-relativistic, radiation-hydrodynamics code has an initial radius of 4 × 1013 cm, a total energy ~ 0.2 foe, and an envelope mass of 5 M⊙. |
| In the text | |
Current usage metrics show cumulative count of Article Views (full-text article views including HTML views, PDF and ePub downloads, according to the available data) and Abstracts Views on Vision4Press platform.
Data correspond to usage on the plateform after 2015. The current usage metrics is available 48-96 hours after online publication and is updated daily on week days.
Initial download of the metrics may take a while.