Fig. 14
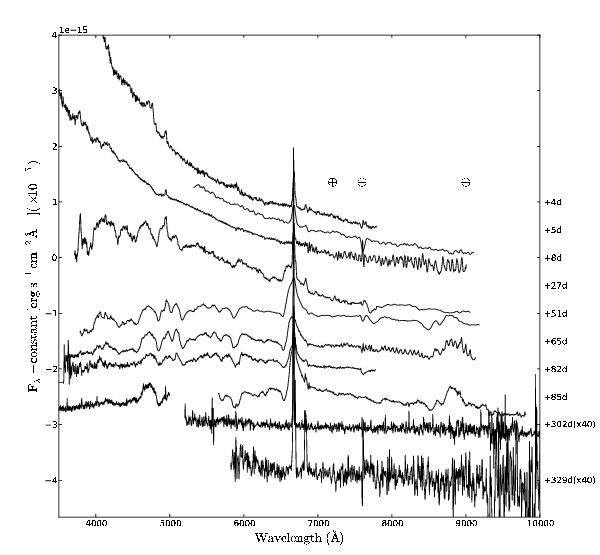
Spectral evolution of SN 2007pk. Wavelengths are in the observer’s rest frame. The phase reported for each spectrum is relative to the explosion date (JD 2 454 412), late spectra have been multiplied by a factor 40 to emphasise the nebular lines. The ⊕ symbols mark the positions of the strongest telluric absorptions. The ordinate refers to the top spectrum; the other spectra are shifted downwards with respect to the previous one by 7 × 10-16, except the third, which is shifted by 1 × 10-15 erg s-1 cm-2 Å-1.
Current usage metrics show cumulative count of Article Views (full-text article views including HTML views, PDF and ePub downloads, according to the available data) and Abstracts Views on Vision4Press platform.
Data correspond to usage on the plateform after 2015. The current usage metrics is available 48-96 hours after online publication and is updated daily on week days.
Initial download of the metrics may take a while.