Fig. 25
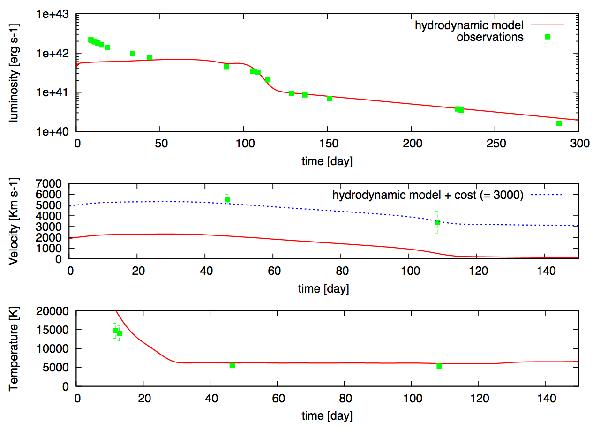
Comparison of the evolution of the main observables of SN 2009dd with the best-fit models computed with the general-relativistic, radiation-hydrodynamics code (total energy ~ 0.2 foe, initial radius 5 × 1013 cm, envelope mass 8 M⊙). Top, middle, and bottom panels show the quasi-bolometric light curve, the photospheric velocity (the blue dashed line refers to the model plus an additive constant to match the data), and the photospheric temperature as a function of time. To estimate the photospheric velocity from observations, we used the value inferred from the Fe ii lines (see text for further details). The x −axes refer to days since explosion.
Current usage metrics show cumulative count of Article Views (full-text article views including HTML views, PDF and ePub downloads, according to the available data) and Abstracts Views on Vision4Press platform.
Data correspond to usage on the plateform after 2015. The current usage metrics is available 48-96 hours after online publication and is updated daily on week days.
Initial download of the metrics may take a while.