Fig. 19
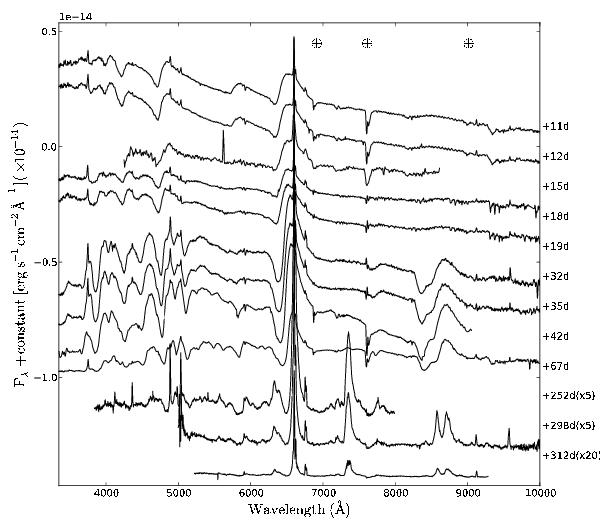
Overall spectral evolution of SN 1996W. Wavelengths are in the observer’s rest frame. The phase reported for each spectrum is relative to the explosion date (JD 2 450 180), late spectra have been multiplied by a factor f5 and 20 to emphasise the features. The ⊕ symbol marks the positions of the most important telluric absorptions. The spectra are shifted with respect to the first one.
Current usage metrics show cumulative count of Article Views (full-text article views including HTML views, PDF and ePub downloads, according to the available data) and Abstracts Views on Vision4Press platform.
Data correspond to usage on the plateform after 2015. The current usage metrics is available 48-96 hours after online publication and is updated daily on week days.
Initial download of the metrics may take a while.