Fig. 24
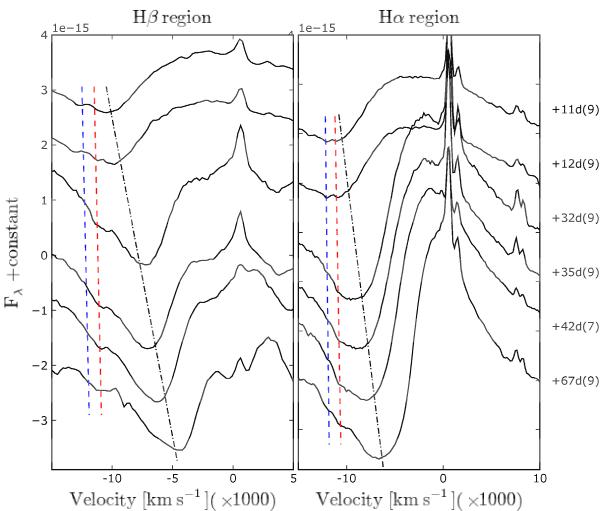
Blow-up of the 4600 Å (left-hand panel) and 6200 Å (right-hand panel) spectral regions during the plateau phase of SN 1996W. The x-axes are in expansion velocity coordinates with respect to the rest-frame position of Hβ and Hα, respectively. To guide the eye, two dash-dotted lines are drawn in the spectra marking the position of minima of the strongest absorption features, while red dashed lines, at comparable velocities, follow the HV Hα and Hβ features (~11 500 km s-1). The blue dashed lines are tied to the second HV feature at ~12 500 km s-1, which is visible only in the Hα region.
Current usage metrics show cumulative count of Article Views (full-text article views including HTML views, PDF and ePub downloads, according to the available data) and Abstracts Views on Vision4Press platform.
Data correspond to usage on the plateform after 2015. The current usage metrics is available 48-96 hours after online publication and is updated daily on week days.
Initial download of the metrics may take a while.