| Issue |
A&A
Volume 554, June 2013
|
|
|---|---|---|
| Article Number | A21 | |
| Number of page(s) | 12 | |
| Section | Planets and planetary systems | |
| DOI | https://doi.org/10.1051/0004-6361/201321179 | |
| Published online | 30 May 2013 | |
Astrophysical false positives in direct imaging for exoplanets: a white dwarf close to a rejuvenated star⋆
1 Aix-Marseille Université, CNRS, LAM (Laboratoire d’Astrophysique de Marseille) UMR 7326, 13388 Marseille, France
e-mail: This email address is being protected from spambots. You need JavaScript enabled to view it.
2 INAF–Osservatorio Astronomico di Padova, Vicolo dell’Osservatorio 5, 35122 Padova, Italy
3 Geneva Observatory, University of Geneva, Chemin des Mailettes 51, 1290 Versoix, Switzerland
4 Institut de Planétologie et d’Astrophysique de Grenoble, UJF, CNRS, 414 rue de la piscine, 38400 Saint-Martin d’ Hères, France
5 INAF–Osservatorio Astronomico di Capodimonte, salita Moiariello 16, 80131 Napoli, Italy
6 Max–Planck–Institute fur Astronomie, Konigsthul 17, 69117 Heidelberg, Germany
7 Department of Physics & Astronomy, College of Charleston, 58 Coming St., Charleston, SC 29424, USA
8 Department of Physics & Astronomy, Macquarie University, Balaclava Rd, North Ryde, Sydney, NSW 2109, Australia
9 Monash Centre for Astrophysics, Monash University, School of Mathematical Sciences, Building 28, Monash University, Melbourne, VIC 3800, Australia
10 INAF–Osservatorio Astrofisico di Catania, via S. Sofia 78, 95123 Catania, Italy
Received: 28 January 2013
Accepted: 14 April 2013
Abstract
Context. As is the case for all techniques involved in the research for exoplanets, direct imaging has to take into account the probability of so-called astrophysical false positives, which are phenomena that mimic the signature of the objects we are seeking.
Aims. In this work we present the case of a false positive found during a direct-imaging survey conducted with VLT/NACO. A promising exoplanet candidate was detected around the K2-type star HD 8049 in July 2010. Its contrast of ΔH = 7.05 at 1.57 arcsec allowed us to assume a 35 MJup companion at 50 projected AU, for the nominal system age and heliocentric distance.
Methods. To check whether it was gravitationally bound to the host star, as opposed to an unrelated background object, we re-observed the system one year later and concluded a high probability of a bound system. We also used radial velocity measurements of the host star, spanning a time range of ~30 yr, to constrain the companion’s mass and orbital properties, as well as to probe the host star’s spectral age indicators and general spectral energy distribution. We also obtained U-band imaging with EFOSC and near-infrared spectroscopy for the companion.
Results. Combining all these information we conclude that the companion of HD 8049 is a white dwarf (WD) with temperature Teff = 18 800 ± 2100 K and mass MWD = 0.56 ± 0.08 M⊙. The significant radial velocity trend combined with the imaging data indicates that the most probable orbit has a semi-major axis of about 50 AU. The discrepancy between the age indicators speaks against a bona-fide young star. The moderately high level of chromospheric activity and fast rotation, mimicking the properties of a young star, might be induced by the exchange of mass with the progenitor of the WD. This example demonstrates some of the challenges in determining accurate age estimates and identifications of faint companions.
Key words: stars: individual: HD 8049 / binaries: visual / techniques: high angular resolution / techniques: spectroscopic / brown dwarfs / white dwarfs
Based on observations collected at La Silla and Paranal Observatory, ESO (Chile): Programs 184.C-0567 (NAOS-CONICA), 184.D-1151 (EFOSC), 60.A-9036 (HARPS), 089.C-0665 (SINFONI). Based on the All Sky Automated Survey (ASAS) photometric data.
© ESO, 2013
1. Introduction
In the search for extrasolar planets, we are frequently faced with objects or physical phenomena that mimick the signature of a substellar object – the so-called astrophysical false positives. The most commonly used techniques in the search for exoplanets are the radial velocity, transit, transit timing variation (TTV), microlensing, and direct-imaging techniques. A large portion of the planets discovered so far has been detected through the radial velocity technique. Rotational modulations of star spots and magnetic activity cycles may produce spurious periodic radial velocity signals that mimic planet signatures (see e.g. Queloz et al. 2001; Lovis et al. 2011). A number of controversial cases have been reported in the literature (e.g. Setiawan et al. 2008; Huélamo et al. 2008; Hernán-Obispo et al. 2010; Figueira et al. 2010). Simultaneous monitoring of activity indicators, spectral line profile changes, and photometric variations may allow one to recognize the true origin of the radial velocity variations and to at least partially account for them (see e.g. Boisse et al. 2011; Lanza et al. 2010; Dumusque et al. 2012).
Transit searches are even more heavily plagued by false positives. Various kinds of eclipsing binaries can mimick a transiting planet’s photometric curve. Such false positives can often outnumber the true exoplanet detections (Brown 2003). The phenomenon of blended eclipsing binaries is the most severe, as described in O’Donovan et al. (2006). To help mitigate these adverse effects, various observational diagnostics, based on the photometric light curves or on additional spectroscopic or photometric observations, have been developed. Statistical tools can also be exploited to explore all possible scenarios of binary systems and the probability of their occurrence (e.g. BLENDER code, Torres et al. 2011, PASTIS code, Díaz et al., in prep.).
Timing variations in eclipsing binaries can be signatures of circumbinary planets, but alternative explanations cannot be firmly ruled out (Zorotovic & Schreiber 2013). A recent case of TTVs induced by stellar activity (star spot features modulating the brightness of the host) instead of the gravitational influence of a planet is described in Barros et al. (2013). Finally, a case of a possible microlensing planet-detection was recently revealed to be a false positive, resulting from the variability of the lensed star (Gould et al. 2013).
Concerning the direct imaging technique, the subject of this work, it may occur that the detected candidate companion is not gravitationally bound to the host star. Detection of unbound objects is frequent since direct-imaging surveys typically have better sensitivities to planets far from the host star, where a higher contrast can be reached (see e.g. Chauvin et al. 2010; Vigan et al. 2012). If the follow-up observation is close in time to the first epoch and the displacement of the star on the sky due to proper motion is small, it may be challenging to determine with a high probability whether an object is bound. One example is given in Metchev & Hillenbrand (2009), where an object that was originally thought to be compatible with being bound, based on the proper motion test, was determined through spectroscopy to be a background M-star. Moreover, the case of the false positive object around IM Lupi (Mawet et al. 2012) teaches that, when the distance determination is complex, it is possible to miscalculate the relative certainties of a bound versus unbound interpretation. Secondly, even after a candidate companion is shown to be bound, the system might prove to be a stellar binary, which is the case of the object of our study.
Finally, to meaningfully characterize the companion, the system age must be accurately determined, because the luminosity of substellar objects depends strongly on the age of the system (younger age corresponds to a brighter companion magnitude, see e.g. Baraffe et al. 2003; Madhusudhan et al. 2011); spurious young stars might therefore lead to poorly classified companions. In this paper we present the case of such a spurious young star, along with an originally misidentified substellar candidate, found in the NACO Large Program (NACO-LP1; Chauvin 2010).
The object of our study, HD 8049, was observed in July 2010. The target is a solar neighborhood K2-star, with a distance of 33.6 pc. The companion found from the direct-imaging observations had an H-band magnitude consistent with a substellar mass, based on the nominal age of the central star. However, after a deeper analysis, presented in this paper, it is concluded to be a white dwarf (WD). The case is similar to that of the object orbiting Gliese 86 (see Mugrauer & Neuhäuser 2005), initially considered a brown dwarf in Els et al. (2001). Other cases of close WD companions around HD 147513 and HD 27442 are described in Porto de Mello & da Silva (1997) and Chauvin et al. (2007), respectively.
Sometimes, as in the case presented here, a false positive turns out to be an interesting object: among the known nearby WD this target is one of the hottest. Because it is part of a close binary system, it yields insights into how these types of objects interact with their companions.
This work is structured as follows: we present the observations in Sect. 2; we show the companion characteristics in Sect. 3; we summarize the stellar properties and how they are influenced by the companion in Sect. 4; the properties of the binary system are discussed in Sect. 5; and conclusions are drawn in Sect. 6.
2. Observations and data reduction
HD 8049 was observed with several instruments and techniques. All data we collected for this analysis are listed in Table 1 along with the related instrumentation, date of observation, and technique.
Resuming table of the observations of HD 8049.
2.1. NACO observations
HD 8049 was observed as part of the NACO Large Program (NACO-LP) imaging survey. We used the VLT/NACO (Lenzen et al. 2003; Rousset et al. 2003) high-contrast Adaptive Optics (AO) system with the H-band (1.33–1.99 μm) and the S13 camera, which provides a spatial sampling of ~13 mas/pixel and a field of view (FoV) of 14″ × 14″. The target was observed in pupil-tracking mode to allow implementation of angular differential imaging (ADI, Marois et al. 2006) data analysis techniques. The observing sequence consisted of a series of unsaturated images of the point spread function (PSF), which served as reference for differential photometry and astrometry, and a series of deep saturated exposures optimized for the detection of faint companions. Data reduction for saturated and unsaturated sequences followed standard procedures (flat-fielding, sky subtraction, bad-pixel correction). The saturated sequence was then analyzed with two methods: (1) the LOCI algorithm (Lafrenière et al. 2007) with the separation criterion Nδ = 0.75 FWHM, and (2) a spatial filtering of all images in a 5 × 5 FWHM box followed by de-rotation and median-combination. Differential astrometry was performed using fitting of a 2D Gaussian profile on the primary star and on the point sources detected in the reduced images.
The target was first observed on July 30 UT, 2010. A faint point source (hereafter HD 8049 B) at a separation of ρ = 1.566 ± 0.006″ and with a position angle of θ = 118.4 ± 0.2 deg was detected with a magnitude difference ΔH = 7.1 ± 0.1 mag (see Fig. 1). Follow-up observations on July 28 UT, 2011 revealed that the point source was co-moving with the primary. Thanks to the high proper motion of the central star (μα = 65.99 ± 1.18 mas/yr and μδ = − 240.99 ± 0.98 mas/yr), a χ2 probability test on Δα and Δδ with respect to the star at two epochs rejected the possibility (at 99% certainty) that the object was a background source. The measured contrast, along with our original age estimate and the measured astrometry, led us to conclude that this was a 35 MJup companion at 50 AU projected separation.
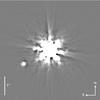 |
Fig. 1 VLT/NACO, H-band image (1.65 μm) of the companion. The frame was generated from the median combination of processed images after spatial filtering (5 × 5λ/D box) and de-rotation. The central core of the PSF is saturated and has been masked in this image. |
2.2. CORAVEL, CORALIE, and HARPS high-resolution spectroscopy
HD 8049 was observed as part of a long-term extra-solar planet search program begun in June 1998 with the CORALIE high-resolution fibre-fed echelle spectrograph mounted on the 1.2 m Euler Swiss telescope at La Silla (ESO, Chile). In addition to the CORALIE data, we obtained a spectrum with HARPS. Finally, we used the CORAVEL database (Baranne et al. 1996) and extracted three radial velocity (RV) observations with a 300 m/s precision (Baranne et al. 1996). This yielded a total time-span of nearly 29 years.
For these three instruments, radial velocities were computed by cross-correlating the observed stellar spectra with a binary mask, whose non-zero zones correspond to the theoretical positions and widths of stellar absorption lines at zero velocity. For HARPS and CORALIE, the instrumental velocity drifts were monitored and corrected for using the “simultaneous thorium referencing technique” with dual fibres (more details in Baranne et al. 1996), whereas for CORAVEL a standard radial velocity star (HD 168454) was used for calibration. Radial velocity points are shown in Fig. 2. The trend in the radial velocity points is likely produced by the influence of object more massive than a brown dwarf. Additionally, activity indicators (S index, log RHK) and the projected rotational velocity were also measured on the CORALIE and HARPS spectra.
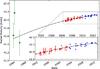 |
Fig. 2 Radial velocity of the star measured with four instruments: CORAVEL (green), CORALIE98 (red), CORALIE07 (blue), and HARPS (black). The solid black line is a least-squares fit of a quadratic RV trend. While the drift information alone is consistent with either a BD or WD interpretation, the inclusion of the separation information, as gathered from NACO, allows us to rule out the BD possibility. |
2.3. NTT/EFOSC
We obtained ten images of HD 8049 on December 21 UT, 2011, with EFOSC2 at the NTT (ESO, Chile). Each frame was taken with the Johnson U filter, a 0.2 s exposure to avoid saturation, 2 × 2 binning and seeing of 0.8″. We reduced the U-band images with standard IRAF2 tasks. We fitted the two objects with Moffat profiles and performed aperture photometry on each star after subtracting contributed flux from the neighbor star. The resolved binary system had a magnitude difference of ΔU = 1.714 ± 0.023 mag, as shown in Fig. 3. The difference was calculated taking into account the correction for the U − B color index of the two stars using Eq. (9) of the EFOSC2 manual3. We used for the K star the value listed in Table 15.7 of Allen (1977) and for the WD we considered the colors in the range of effective temperature, Teff, from 15 000 K to 25 000 K (see Sect. 3.2). The measured values of the projected separation, ρ = 1.56 ± 0.02″, and the position angle, θ = 118 ± 0.5deg, were compatible with NACO measurements.
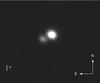 |
Fig. 3 U-band EFOSC image of the binary system. HD 8049 B, in the southeast side, is 1.7 mag fainter. |
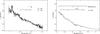 |
Fig. 4 SINFONI spectrum of HD 8049 B in J-band (left) and HK-band (right). |
During the same night, we performed spectroscopy of the system. The n.11 grism and the 1″ slit were used, providing a resolution R ~ 360 over the range between 3500–7400 Å. The slit was oriented along the two stars (i.e., PA = 121 deg). We obtained two frames of 8 s exposure.
The spectral reduction was performed using standard IRAF tasks. The raw data were bias subtracted and flat-field corrected. The spectra were extracted with the IRAF task apall, wavelength calibrated using arc lamp exposures, and cross-correlated with the sky lines. The relative flux calibration was performed by deriving the sensitivity curve for the instrument set-up from the spectroscopic standard star L745-46A (Hamuy et al. 1994).
We found that a low signal to noise ratio (S/N) signature of HD 8049 B was present in the blue part of the spectrum; its contribution is completely blended with that of the primary star.
2.4. VLT/SINFONI
The companion was further characterized on August 28 UT, 2012 using the Spectrograph for INtegral Field Observations in the Near Infrared (SINFONI, see Eisenhauer et al. 2003; Bonnet et al. 2004b,a) mounted at the VLT/UT4. SINFONI provides AO assisted integral field spectroscopy in the near-infrared (NIR). It is composed by the SPectrograph for Infrared Faint Field Imaging (SPIFFI) fed by a modified version of the Multi-Applications Curvature Adaptive Optics system (MACAO, see Bonnet et al. 2003). We used the gratings J and H + K to cover the 1.1–1.4 and 1.45–2.45 μm ranges at a spectral resolution of ~2000 and ~1500, respectively. The smallest plate scale (12.5 mas) was used, enabling Nyquist sampling of the PSF. The primary served as a reference for the AO wavefront sensor and was kept outside the instrument FOV (0.8′′ × 0.8′′). Each sequence was composed of 12 acquisitions on the source with small dithering and one acquisition on the sky. Immediately after observing our science targets, we observed the standard star HIP 17280 (B5V) following an AB pattern to correct our spectra for telluric features. HD 8049 and the standard were both observed under poor atmospheric conditions with a seeing of 1.3−1.5′′, although the AO loop remained stable, and airmass was lower than 1.1.
We homogeneously reduced our dataset with the ESO data reduction pipeline version 1.9.8 (Abuter et al. 2006). The pipeline successfully carried out bad-pixel detection, flat-fielding, distortion coefficient computation, and wavelength calibration using calibration frames acquired the day after the observations. Individual datacubes were reconstructed from sky-subtracted object frames and merged into a final mosaicked datacube. Datacubes of telluric standard stars were obtained in a similar way. Finally, we integrated the source flux in each final datacube over selected apertures to optimize the S/N without introducing differential flux losses. The spectra of the standard star were corrected from their intrinsic features and divided by a black body at the appropriate temperature (Pickles 1998). The SINFONI NIR spectrum of the object is shown in Fig. 4.
3. Nature and properties of HD 8049 B
3.1. Early discovery
Astrometry of candidate(s) around HD 8049.
HD 8049 was identified as a binary system by van den Bos (1929) in 1928. A projected separation ρ = 3.19″ and a position angle θ = 153.1 deg were measured at epoch 1928.81. We corrected for the precession effect as listed in Heintz (2000) and found θ = 153.6 deg. The original paper did not provide any error bar on the measurement, just a note that there were good observing conditions. We assumed an error of 100 mas on Δα and Δδ. The magnitude resulting from the visual observations was 13.5 mag (rounded to 0.5 mag) and a bluish color was reported; the assumed error is 0.5 mag. This is the only available measurement of the pair listed in the Washington Double Star (WDS) Catalog (Mason et al. 2001) before our observations. This position is possibly compatible with the one measured in our EFOSC U-band images and with the NACO results, once the time lapse is considered. Table 2 summarizes the available astrometry, including the two epochs from NACO.
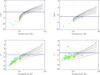 |
Fig. 5 Absolute magnitude in different bands (from top-left FUV, NUV, V and H) versus effective temperature for the white dwarf models of Vennes et al. (2011) (black lines) and a sample of nearby dwarfs collected by Giammichele et al. (2012). Stars represent objects with all magnitudes available and diamonds represent the other. Colors indicate the mass from the lowest (blue) to the highest (red ones) white dwarfs. The continuous blue horizontal line represents the magnitude of HD 8049 B. The corresponding error bars are plotted as dashed blue lines. The plots show that the objects of the Giammichele et al. (2012) catalog are not peculiar and are well described by the theoretical models of Vennes et al. (2011). |
From NACO observations spanning over 1 yr, we derive a relative motion of 2.7 mas/yr in α and 30.4 mas/yr in δ. Repeating this for 1928 vs. 2010 observations, we obtain a motion of 0.4 mas/yr in α and 26 mas/yr in δ. These determinations are obviously much smaller than the proper motion of the star (μα = 65.99 ± 1.18 mas/yr and μδ = − 240.99 ± 0.98 mas/yr), supporting the physical association of the faint companion. The motions with respect to the central star derived from 1928 to 2010 and from 2010 to 2011 are consistent within their errors, which makes it very likely that the companion detected in 1928 in the optical range is the same as we found with NACO, and that we are indeed tracking the orbital motion of HD 8049 B around HD 8049 A. The characterization of the orbital properties of the binary is discussed in Sect. 5.1.
3.2. HD 8049 B, a new nearby WD
Considering the combined optical and NIR photometry of HD 8049 B (U, V, and H bands) from EFOSC, the WDS Catalog and NACO observations, the hypothesis of a substellar companion is unambiguously excluded. The combined visible and NIR photometry indicate that HD 8049 B is most likely a WD. The SINFONI spectrum indeed confirms this assumption as the observed spectral energy distribution (SED) shows a hot and dense atmosphere that can be associated with that of a WD. The NIR spectrum is rather featureless because we detected no hydrogen or helium lines over the whole 1.0–2.5 μm spectral range. Despite the low-S/N, it could indicate a featureless helium-rich nature (DB WD) or a hydrogen-rich white dwarf (DA) with a relatively hot atmosphere and therefore less contrasted hydrogen lines (see Dobbie et al. 2005). Visible band spectroscopy should enable a better characterization of the WD nature of HD 8049 B, but unfortunately, the low quality EFOSC spectrum does not provide such additional information due to the blend with the much brighter primary spectrum.
To further constrain the physical properties of HD 8049 B, we used the emitted fluxes in the FUV and NUV listed in the GALEX Catalog (Martin et al. 2005). In the ultraviolet, we applied the correction for the chromospheric emission of the primary as described in Sect. 5.2. We refer to that section for an exhaustive summary of the photometry for the two objects.
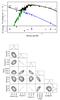 |
Fig. 6 Top: observed magnitudes of the system plotted over the synthetic spectra. Blue points are those taken in consideration during the SED fitting of the WD. Triangle-shaped ones are not considered during the PASTIS integration. Values of the magnitudes of the integrated system are represented in red and the SED in black. The primary star SED is represented in green. Bottom: two parameters joint posterior distributions for HD 8049 B. The 68.3%, 95.5% and 99.7% confidence regions are denoted by light gray, dark gray and black areas, respectively. Single PDF of each combination is shown along the sides. |
As a preliminary analysis of the object properties, we created empirical sequences using the catalog of nearby WDs by Giammichele et al. (2012). When required photometry was unavailable there, we supplemented it with available GALEX FUV and NUV magnitudes, and 2MASS J, H and KS magnitudes. The final sample consisted of 107 nearby (≤51 pc) WDs: 22 with FUV magnitudes, 18 with NUV magnitudes and 84 with J, H, KS magnitudes calibrated by Giammichele et al. (2012).
The catalog of observed WDs listed mass, Teff, log g (logarithm of the surface gravity) and tcool, all measured from spectroscopy. As a check, we overplotted these object parameters with the expected values from theoretical sequences of Vennes et al. (2011), and confirmed that they fit perfectly, as shown in Fig. 5.
We noticed that the FUV − NUV color of HD 8049 B did not fit with theoretical or empirical models. The NUV magnitude is more affected by the chromosphere of the K star, but if we considered the corrected value, the discrepancies were even greater.
To fit our photometry measurements with the SED of a WD object, we used the Markov chain Monte Carlo (MCMC) based code PASTIS (Díaz et al., in prep.). To extract characteristics of the WD atmosphere, we used models by Koester (2010); these models predict the mean intensity of the stellar disk and depend on log g, Teff, and the atmosphere composition; the latter is assumed to be of pure H in this case. To calculate the observed flux measured from our viewpoint on Earth, we multiplied the intensity by the solid angle of the star, calculated using the distance and the radius of the WD. The latter was obtained from the Teff − log g − tcool–mass relation from Holberg & Bergeron (2006); Kowalski & Saumon (2006); Tremblay et al. (2011); Bergeron et al. (2011)4 (used also below to compute the derived parameters).
The synthetic spectrum was then corrected for interstellar extinction using the relations of Fitzpatrick (1999) with RV = 3.1, and an assumed reddening value of E(B − V) = 0.0106, as listed in the GALEX catalog. Finally, the spectrum was integrated in the bandpass listed in Table 4 as described in Bayo et al. (2008). We did not consider the NUV point for the reason listed previously. We also omitted the U point because it can be affected by the cut-off of the atmosphere; the V point was rejected because the observation was made by eye and there is no associated error.
The SEDs of the system and its components are shown in Fig. 6. The fitted parameters are the distance, log g, and Teff. As priors, we assumed a normal distribution with a mean distance of 33.6 pc and a standard deviation of 1.4 pc (based on the Hipparcos parallax of 29.79 ± 1.21 mas, van Leeuwen (2007); for log g we used a uniform distribution in the range 7.0–9.0; for Teff we used a uniform distribution in the range 10 000–40 000 K.
We ran 50 chains of 5 × 10⁵ steps starting from random values of the priors. After removing the burning phase (steps before convergence), we merged all chains, taking into account the correlation lengths. The results of the fitted parameters are log g = 7.86 ± 0.16 and Teff = 18 800 ± 2100 K. The distance remained equal to the prior. The derived parameters were MWD = 0.56 ± 0.08 M⊙, RWD = 0.0145 ± 0.0016 R⊙, and cooling time  Myr (see Fig. 6). Note that the errors of the values are the 68.3% confidence interval of the fit, and they do not take into account possible model errors.
The cooling time calculated using the empirical sequences is  Myr (see Fig. 7), in agreement with the SED fit. To estimate the age of the system we added the main-sequence lifetime to the cooling age of the WD. This is discussed in Sect. 5.3.
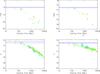 |
Fig. 7 Absolute magnitude in different bands (from top-left FUV, NUV, V and H) versus cooling age for the white dwarf models of Vennes et al. (2011) (black lines) and a sample of nearby dwarfs collected by Giammichele et al. (2012). Stars represent objects with all magnitudes available and diamonds represent the other. Colors indicate the mass from the lowest (blue) to the highest (red ones) white dwarfs. The continuous blue horizontal line represents the magnitude of HD 8049 B. The corresponding error bars are plotted as dashed blue lines. The plots show that the objects of the Giammichele et al. (2012) catalog are not peculiar and are well described by the theoretical models of Vennes et al. (2011). |
4. Nature and properties of HD 8049 A
We exploited the spectroscopic data described in Sect. 2.2 and additional data from public archives with the aim of improving the age determination and other stellar parameters of the primary.
4.1. Rotation period
HD 8049 was observed in the All Sky Automated Survey (ASAS5 Variable star catalog; Pojmanski 2002). Archive observations span from November 20 UT, 2000 to October 28 UT, 2009. After removing outliers and averaging observations collected within short-time intervals (less than 2 h), we were left with 583 data points for the rotation period search. The average photometric accuracy was 0.02 mag. The brightest V magnitude was V = 8.68 ± 0.02 mag. To minimize the effects of active region growth and decay on the periodograms, we sectioned the data time series into 14 light curves. The light curve amplitude was variable, with values up to ΔV = 0.04 mag. A Lomb-Scargle analysis (Scargle 1982) was carried out on the complete time series data as well as on each of the 14 light curves. We found a rotation period of P = 8.3 ± 0.1 days in the complete time-series data, and the same period in 4 out of 14 time intervals (with a false alarm probability, FAP ≤ 1%). The light curve amplitude was larger than the photometric accuracy σ in 13 out of 14 time segments.
HD 8049 was also observed by SuperWASP (Pollacco et al. 2006; Butters et al. 2010). The public archive permitted us to retrieve data for the 2006 and 2007 seasons6. We carried out an analysis similar to that described for the ASAS data. After outlier removal, averaging, and data series sectioning, we found a rotation period P = 8.5 ± 0.1 days for the complete series and for the 2006 and 2007 seasons, with a confidence level higher than 99%. This is consistent with the period determination from ASAS data. The highest light curve amplitude was 0.02 mag, whereas photometric accuracy was 0.01 mag. In Fig. 8 we show a summary of the period search on Super WASP data. We refer the reader to Messina et al. (2010) for a more detailed description of the photometric data analysis methods. According to the criteria adopted in Messina et al. (2011) for assigning a confidence level to the rotation period, the period of HD 8049 can be considered confirmed. The P = 8.3 days rotation period is compatible with the projected rotational velocity (3.5 ± 1.2 km s-1, see Torres et al. 2006) for stellar radii R ≥ 0.6 R⊙.
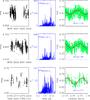 |
Fig. 8 Photometry time-series of HD 8049 from SuperWASP: left columns display time segments of magnitudes versus heliocentric Julian days (HJD) (the first panel only shows the complete series). The middle columns display the Lomb-Scargle periodograms with an indication of the rotation period. The right columns display the light curves phased with the rotation period and the first HJD as initial epoch. Solid curves represent the sinusoidal fit with the rotation period. The labels report the ratio of average residual from the fit and the rotational modulation amplitude. |
4.2. Age indicators
Table 3 summarizes the measurements and corresponding ages as derived from the different indicators. From our analysis of the HARPS spectrum, we confirm that no lithium is detectable, as found by Torres et al. (2006). Two sets of log RHK measurements are available: those from our CORALIE spectra and that by Gray et al. (2006). Within the uncertainties they give the same value (log RHK = −4.25). The logarithm of the ratio of X-ray and bolometric luminosity log LX/Lbol was derived from the ROSAT All-Sky Bright Source Catalog (Voges et al. 1999) assuming the source 1RXS J011915.1-433803 is the X-ray counterpart of HD 8049 A. The X-ray emission should be dominated by the active K dwarf primary because HD 8049 B is cooler than WDs that show significant X-ray emission (Teff > 25 000 K, Vennes 1999). The U, V, and W heliocentric space velocities (given in a right-handed coordinate system with U toward the galactic center) are taken from Holmberg et al. (2009) adopting the trigonometric parallax of 29.79 ± 1.21 mas (van Leeuwen 2007). The uncertainty in the center of mass velocity due to orbital motion spans from a lowest value of 200 m/s to a maximum of 3 km s-1, as determined from the simulations described in Sect. 5.1.
The age estimates provided from these various indicators are quite discordant. Chromospheric HK emission, coronal emission, and rotation period indicate an age between 100–400 Myr. On the other hand, the lack of lithium indicates an age older than about 500 Myr. Additionally, the kinematic parameters are quite far from the typical locus of young stars (Montes et al. 2001). The galactic orbit as given in Holmberg et al. (2009) has e = 0.19 and zmax = 0.33 kpc. These properties are more typical of stars with age of about 3 Gyr, as estimated from the galactic orbits of stars with small age uncertainty in the Holmberg et al. (2009) catalog. These discrepancies strongly suggest that HD 8049 A is not a bona-fide young star but is instead a peculiar object.
We identify the source of these anomalies to be the WD companion detected through direct imaging. The accretion of some amounts of mass and angular momentum by the central star at the time of mass loss from the WD progenitor might have spun-up the star, while increasing the level of magnetic activity. The presence of the WD cannot significantly alter the measurement of the rotation period and X-ray flux. Only minor effects on the log RHK measurement are expected from the contamination of the spectrum.
We conclude that the young rotation-activity age is not spurious. The central star should have been rejuvenated by the accretion of some amount of mass and angular momentum at the time of mass loss from the WD progenitor. This scenario is investigated more thoroughly in Sect. 5.3.
4.3. Mass determination
Using our spectroscopic temperature and metallicity results, we employed the PARAM interface7 (da Silva et al. 2006) to conclude a mass of 0.804 ± 0.023 M⊙. The mass of the convective envelope of the star, following Murray et al. (2001), is 0.086 M⊙.
4.4. Abundance analysis
It is well known that a considerable amount of mass can be transferred to a companion in close binary systems. This is the explanation for blue stragglers in clusters (McCrea 1964), Ba-stars, and extrinsic C-stars (McClure et al. 1980; McClure 1984; McClure & Woodsworth 1990). Different signatures can be observed, depending on when and how much mass was transferred from the donor (in our case the WD). The surface chemical composition of the current primary can therefore be used to better constrain the history of this system.
To better characterize the primary and explore possible signatures of accretion of material processed by the WD progenitor, we derived the stellar spectroscopic parameters and measured the abundances of several elements. To this aim, we used the HARPS high-resolution spectrum of HD 8049 A (Sect. 2.2) and adopted the prescriptions of Biazzo et al. (2012). For a detailed description of the method, we refer to that paper.
The derivation of the iron abundance of our target was performed differentially with respect to the Sun. To this purpose, we analyzed a Ganymede spectrum acquired with HARPS at high S/N, obtaining log n(FeI)⊙ = log n(FeII)⊙ = 7.53 ± 0.05. In the end, we found the following stellar parameters and iron abundance for HD 8049 A: effective temperature Teff = 5050 ± 50 K, surface gravity log g = 4.50 ± 0.10 dex, microturbulence velocity ξ = 1.42 ± 0.05 km s-1, [FeI/H] = −0.10 ± 0.02 dex, and [FeII/H] = −0.10 ± 0.05 dex.
Age indicators of HD 8049 A.
Looking for potential evidence of pollution by the ejecta of the precursor of the WD, we derived abundances of the s-process elements8 Y, Ba, and La, which are mainly produced by low-mass asymptotic giant branch (AGB) stars (~1.5–3 M⊙, e.g., Busso et al. 1999). The abundances of Y, Ba, and La were derived as in D’Orazi et al. (2012). We also gathered Cu abundances, whose 70–80% abundance in the solar system is ascribed to massive stars (Käppeler et al. 2011). We adopted the hyperfine splitting from Steffen (1985) and the isotopic mixture from Simmerer et al. (2003) (69% for 63Cu and 31% for 65Cu. We found [Y/Fe] = −0.15 ± 0.10, [Ba/Fe] = −0.10 ± 0.10, [La/Fe] = −0.12 ± 0.10, and [Cu/Fe] = 0.00 ± 0.07. Errors are those derived from the spectral synthesis.
We also measured the abundances of Na and Al because these elements are expected to be overabundant in the ejecta of intermediate-mass AGB stars (Ventura et al. 2001), which is another potential precursor of HD 8049 B. We found [Na/Fe] = 0.05 ± 0.04 and [Al/Fe] = 0.13 ± 0.03, indicating no significant pollution from this type of star.
5. System properties
5.1. Orbital properties
To constrain the possible orbit of the object we performed a Monte Carlo simulation following the example of Desidera et al. (2011). The simulation steps through 1.8 × 10⁶ random orbital elements and rejects all orbits that do not fit both the RV trend and the astrometric data. We adopted MA = 0.804 ± 0.023 M⊙ and MB = 0.56 ± 0.08 M⊙ as described in Sects. 4.3 and 3.2. The simulation found ~28 000 orbits consistent with the observational data. We present the allowed orbital elements in Fig. 9.
The distribution of each element is shown in the histograms of Fig. 10. The distribution of the inclinations is bimodal and peaks on the values of 5deg and 65deg. The argument of periastron ω and the longitude of the node Ω have the highest probability around values of 180deg and 250deg, respectively. The most probable period is around 300 yr, corresponding to a semi-major axis of ~50 AU. Among the possible configurations of the orbit, there is a lack of edge-on inclinations that can produce the correlation plots of ω and Ω. This is consistent with the RV trend. The orbit is very likely eccentric, with a most probable value e = 0.55.
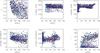 |
Fig. 9 Monte Carlo simulation results showing orbital parameters for orbital solutions compatible with the observational data. Colors indicate different levels of χ-squared values (decreasing from black to blue and finally red). The plots show that some parameters are well constrained in a region of parameters space while others can span all possible values. See Sect. 5.1 for information on the Monte Carlo procedures. |
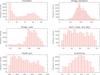 |
Fig. 10 Histograms of orbital parameters derived with a Monte Carlo simulation following the example of Desidera et al. (2011). |
5.2. Broad band photometry
Broad band photometry of HD 8049.
Table 4 lists the available broad band photometry for the system. A very bright FUV magnitude is listed in the GALEX catalog. The offset between the optical and GALEX position of 1.67″ along the SE direction indicates that the FUV source is better coincident with the WD than with the K2 star. Such a bright FUV magnitude is not expected from the primary, even taking into account the star’s high level of chromospheric activity (see e.g. Fig. 6 in Smith & Redenbaugh 2010). Corrections for chromospheric contribution of the primary were calculated using Eqs. (2) and (4) of Findeisen et al. (2011); we assumed a B − V color for the K star as given in Table 15.7 of Allen (1977); we assumed log RHK = − 4.25. The final derived errors take into account the dispersion of the points used to derive the mentioned relations.
Based on the composite U magnitude of the unresolved system, we determined an individual U magnitude following the procedures described in Sect. 2.3. H magnitude was obtained with NACO observations (see Sect. 2.1).
5.3. System history
As mentioned in Sect. 4.2, the discrepant results of various age indicators for HD 8049 A might be qualitatively explained by the accretion of some amounts of mass and angular momentum from its WD companion HD 8049 B. Comparable cases have been discovered in the past. Jeffries & Stevens (1996) showed that the accretion of slow wind from the AGB progenitor of the WD can transfer sufficient angular momentum to speed up the companion even for orbital separations up to 100 AU. Cases of pairs formed by a WD and a fast rotating, barium-rich star have been reported by Jeffries & Smalley (1996). Another case is represented by the binary GJ86, which is known to host a giant planet and a WD companion (GJ86B; Els et al. 2001; Mugrauer & Neuhäuser 2005). GJ86 also shows anomalies in the age indicators that are similar, even if less extreme, than those we found for HD 8049; the GJ86 age indicators yield a younger age from X-ray and H&K than from kinematic (see Desidera & Barbieri 2007, Appendix B). Another more direct indication of wind accretion onto a companion during the AGB phase is represented by the accretion disk around Mira B (Karovska et al. 1997; Ireland et al. 2007), which lies at a projected separation of about 70 AU, which is slightly larger than the most probable value for HD 8049.
Following these works, we can speculate that part of the material lost through stellar wind by the WD progenitor was accreted by HD 8049 A, increasing its rotation rate and mimicking a young age for indicators that are directly or indirectly tied to stellar rotation (rotation itself, X-ray and H&K emission). Specifically, we expect that the activity and rotation age of the system is related to the time elapsed since the accretion event, i.e., the cooling age of the WD. However, the activity-rotation age might be larger than the cooling age of the WD if the primary was not spun-up to the fast rotational velocity typical of a very young star. In this scenario, increasing the mass of the WD progenitor allows for larger amounts of accreted material, both because of large amounts of mass loss due to stellar wind at the end of AGB phase, and also because of the larger widening of the binary orbit due to mass loss. A more massive progenitor also implies a younger age for the system. On the other hand, the lack of significant abundance anomalies on HD 8049 A (Sect. 4.4) indicates that either the s-process enhancement of the material lost by the AGB progenitor is small, which may arise only for masses lower than 1.5 M⊙, or that the amount of accreted material is small with respect to the heavy element content of the convective zone.
To explore the possible original configuration of the system, we used the BSE package (Hurley et al. 2002), evolving binary systems with different primary masses and orbital parameters. We used their adopted initial-final mass relationship for the WD and default parameters to take into account mass loss and wind accretion. These elements have significant uncertainty, therefore the results are intended only for a qualitative view of the possible configuration.
A system with a 1.2–1.5 M⊙ star initially at 30 AU will produce a WD of roughly the correct mass with a semi-major axis close to the most probable value, for current orbits presented in Sect. 5.1. The resulting age of the system (3–6 Gyr) is compatible with the kinematic properties of HD 8049. About 0.005 M⊙ are accreted by the other component in this case, which is about 5% of the mass of the stellar convective zone as derived following the prescriptions by Murray et al. (2001).
We checked that the results using the more recent semi-empirical relationship by Salaris et al. (2009) are fully consistent with those derived using BSE. Salaris et al. (2009) found that WDs with masses in the range 0.56–0.64 M⊙ are found in NGC 7789 (estimated age of 1.5 Gyr) and older clusters while those in younger ones, like the Hyades and Praesepe (age of about 0.65 Gyr), are more massive.
6. Conclusions
The substellar candidate around HD 8049 A, initially suspected based on NACO H-band photometry and astrometry, turned out to be a WD companion instead of a BD.
With direct imaging, second-epoch observations of the object, we confirmed a bound companionship and determined the WD mass through its luminosity.
The M/L relation for exoplanets strongly depends on the age of the system (see e.g. models from Baraffe et al. 2003; Madhusudhan et al. 2011). For this reason, samples of stars scrutinized for low-mass companions through high-contrast imaging usually include a high fraction of presumably young stars. However, a misinterpretation of the age of the host star may produce false alarms and/or an erroneous calculation of the mass of the companion. This was the case of HD 8049 A, a star that appears rejuvenated by the accretion of significant angular momentum from the ejecta of the progenitor of a WD. The faint companion was confused with a 35 MJup brown dwarf when the age indicated by rotation and activity was considered.
From radial velocity analysis we found a trend that was compatible with a more massive object rather than a brown dwarf. Indeed, a comprehensive analysis of age indicators revealed inconsistencies. The final clue that unequivocally confirms the WD hypothesis is the observation of the system in U-band. At this wavelength, a bright object is observed at the same astrometric position as the NACO candidate. The ultraviolet magnitude of this object is 1.7 mag fainter than that of the host star.
We found parameters for the WD assuming an atmosphere made of pure hydrogen and fitting photometry observation points. The results are Teff = 18 800 ± 2100 K, MWD = 0.56 ± 0.08 M⊙, log g = 7.86 ± 0.16, and age Myr.
We made a Monte Carlo simulation, following the example of Desidera et al. (2011), to constrain the orbital parameters. We found that the WD very likely moves in an eccentric orbit with a most probable period of 300 yr (~50 AU).
In our scenario, the existence of the WD companion (with H-band magnitude compatible with a substellar object) and the spurious young age of the star, as derived from rotational period, log RHK and X-ray emission, are intrinsically linked. As discussed in this paper, a way to identify the spurious young stars that have been affected by wind accretion is to compare the ages resulting from several age indicators, paying attention to discrepancies between rotation-activity ages and lithium and kinematic ages. If the sample is focused on young stars, such a false alarm is related to a WD with a short cooling age, which explains a young rotation-activity age for the companion. Such objects are most easily identified in the UV bandpass, as done in our study exploiting archive GALEX observations.
Resolved systems with WD companions close enough to have harbored some accretion phenomena are interesting targets for additionally constraining the wind accretion occurring in moderately wide binaries during the AGB phase of the WD progenitor. They also enable investigations of the maximum binary separation at which Ba-stars can be observed. Finally, our results confirm that there is a population of WD companions awaiting discovery even at small distance from the Sun, as suspected by Holberg (2009), and that AO imaging can play a relevant role for unveiling it.
Because nearby young stars are prime targets for direct imaging planet searches, and new instrumentation optimized to this science goal is about to start operations, one might wonder about the expected frequency of the kind of false alarm we have found in NACO-LP. To this purpose, we may first consider the frequency of Ba-stars, which are systems similar to those considered here, but with initially smaller separation and shorter period. Ba-stars are the result of mass transfer from an AGB companion (the original primary of the system) to the small-mass star that is currently observed. For our considered scenarios, the system is observed at a late stage in its development, when the AGB star has evolved into a WD. From a survey of ~200 slightly evolved F dwarfs, Tomkin et al. (1989) discovered two barium dwarfs, and derived a rough frequency of ~1% Ba-stars among F dwarfs; Edvardsson et al. (1993) found 6 dwarf barium stars among 200 F stars (i.e., 3%), but their binary nature remains to be proven. North & Duquennoy (1991) found a frequency of 0.5 to 1.0% Ba dwarfs among FV stars. McConnell & Gast (1972) estimated that 1% of the G and K giants in the vicinity of the Sun are Ba-stars. From a 200 star sample, Williams (1975) derived a frequency of Ba-stars among G-K giants between 1 and 4%. Bidelman (1985) obtained a frequency between 0.5 and 1%. Most Ba-stars are in binary systems with orbital periods typically longer than 100 days but shorter than 10 years (McClure et al. 1980; McClure 1984; McClure & Woodsworth 1990), though Jorissen et al. (1998) reported a few cases with periods outside this range. Orbits typically have low but non-zero eccentricity, because they are most likely not produced by Roche-lobe overflow; the origin is probably due to stellar wind. This is also supported by evolutionary models (Han et al. 1995).
We may consider the period and secondary mass distribution of binary stars, and estimate the fraction of systems that are of potential interest. Integrating the distribution of binary separation by Duquennoy & Mayor (1991) yields that at least half of the binaries containing a WD have a separation large enough that the star does not become a Ba-star. Hence, the fraction of G-K stars with a WD companion should be on the order of a few percent. This is consistent with arguments based on the initial mass function: roughly a few percent of the G-K stars should have a companion originally more massive if we assume that the mass of the two stars is independent of each other, which is probably a good approximation at least for solar-type stars. Objects like HD 8049 A are therefore most likely G-K stars with a WD companion and an original separation typically slightly higher than that required to become a Ba-star. They should also have experienced some mass and angular momentum transfer. Hence there should be no large separations.
Objects like HD 8049 A may very well pass through the pre-selection of the direct imaging candidates, failing to show up as spectroscopic binaries. Periods are long enough that RV variations are very small. Furthermore, they will not show up in astrometric binary catalogs, because the periods are so long that orbital motion is not distinguished from proper motion. Finally, they might also be overlooked as visual binaries because the contrast is high. Inclusion in the sample of direct-imaging planet searches also depends on the adopted age limits. For surveys focused on young stars, such as our NACO one, only companions of WDs with short cooling times might be selected.
ESO program 184.C-0567, PI J.-L. Beuzit, “Probing the Occurrence of Exoplanets and Brown Dwarfs at Wide Orbits”.
IRAF is distributed by the National Optical Astronomy Observatory, which is operated by the Association of Universities for Research in Astronomy (AURA) under cooperative agreement with the National Science Foundation.
EFOSC2 manual, version 3.6. ESO user facilities.
Elements heavier than iron are mostly synthesized via neutron-capture processes, which can be slow (s) and rapid (r), where slow and rapid is meant compared with the β-decay timescale (Burbidge et al. 1957).
Acknowledgments
We are grateful to all people involved during the observations at VLT, NTT, 3.6 m telescope and 1.2 m Euler Swiss telescope at La Silla. We also thank the TASTE group of Padua for the precious help for EFOSC photometry and Brian Lemaux for his precious help. A.Z., S.D, and D.M. ackowledge partial support from PRIN INAF 2010 “Planetary systems at young ages”. J.C. ackowledges the support of U.S. National Science Foundation under Award No. 1009203. Balmer/Lyman lines in the models were calculated with the modified Stark broadening profiles of Tremblay & Bergeron (2009), kindly made available by the authors. We acknowledge support from the French National Research Agency (ANR) through the GUEPARD project grant ANR10-BLANC0504-01. We wish to thank the referee for the constructive comments to the paper.
References
- Abuter, R., Schreiber, J., Eisenhauer, F., et al. 2006, New A Rev., 50, 398 [Google Scholar]
- Allen, K. W. 1977, Astrophysical quantities. [Google Scholar]
- Baraffe, I., Chabrier, G., Barman, T. S., Allard, F., & Hauschildt, P. H. 2003, A&A, 402, 701 [NASA ADS] [CrossRef] [EDP Sciences] [Google Scholar]
- Baranne, A., Queloz, D., Mayor, M., et al. 1996, A&AS, 119, 373 [NASA ADS] [CrossRef] [EDP Sciences] [Google Scholar]
- Barros, S. C. C., Boue, G., Gibson, N. P., et al. 2013, MNRAS, 430, 3032 [NASA ADS] [CrossRef] [Google Scholar]
- Bayo, A., Rodrigo, C., Barrado Y Navascués, D., et al. 2008, A&A, 492, 277 [NASA ADS] [CrossRef] [EDP Sciences] [Google Scholar]
- Bergeron, P., Wesemael, F., Dufour, P., et al. 2011, ApJ, 737, 28 [NASA ADS] [CrossRef] [EDP Sciences] [Google Scholar]
- Biazzo, K., D’Orazi, V., Desidera, S., et al. 2012, MNRAS, 427, 2905 [NASA ADS] [CrossRef] [Google Scholar]
- Bidelman, W. P. 1985, in Cool Stars with Excesses of Heavy Elements, eds. M. Jaschek, & P. C. Keenan, Astrophys. Space Sci. Libr., 114, 43 [Google Scholar]
- Boisse, I., Bouchy, F., Hébrard, G., et al. 2011, A&A, 528, A4 [NASA ADS] [CrossRef] [EDP Sciences] [Google Scholar]
- Bonnet, H., Ströbele, S., Biancat-Marchet, F., et al. 2003, in SPIE Conf. Ser. 4839, eds. P. L. Wizinowich, & D. Bonaccini, 329 [Google Scholar]
- Bonnet, H., Abuter, R., Baker, A., et al. 2004a, The Messenger, 117, 17 [NASA ADS] [Google Scholar]
- Bonnet, H., Conzelmann, R., Delabre, B., et al. 2004b, in SPIE Conf. Ser. 5490, eds. D. Bonaccini Calia, B. L. Ellerbroek, & R. Ragazzoni, 130 [Google Scholar]
- Brown, T. M. 2003, ApJ, 593, L125 [NASA ADS] [CrossRef] [Google Scholar]
- Burbidge, E. M., Burbidge, G. R., Fowler, W. A., & Hoyle, F. 1957, Rev. Mod. Phys., 29, 547 [NASA ADS] [CrossRef] [Google Scholar]
- Busso, M., Gallino, R., & Wasserburg, G. J. 1999, ARA&A, 37, 239 [NASA ADS] [CrossRef] [Google Scholar]
- Butters, O. W., West, R. G., Anderson, D. R., et al. 2010, A&A, 520, L10 [NASA ADS] [CrossRef] [EDP Sciences] [Google Scholar]
- Chauvin, G. 2010, in In the Spirit of Lyot 2010 [Google Scholar]
- Chauvin, G., Lagrange, A.-M., Udry, S., & Mayor, M. 2007, A&A, 475, 723 [NASA ADS] [CrossRef] [EDP Sciences] [Google Scholar]
- Chauvin, G., Lagrange, A.-M., Bonavita, M., et al. 2010, A&A, 509, A52 [NASA ADS] [CrossRef] [EDP Sciences] [Google Scholar]
- Cousins, A. W. J. 1983, South African Astronomical Observatory Circular, 7, 36 [NASA ADS] [Google Scholar]
- da Silva, L., Girardi, L., Pasquini, L., et al. 2006, A&A, 458, 609 [NASA ADS] [CrossRef] [EDP Sciences] [Google Scholar]
- Delorme, P., Collier Cameron, A., Hebb, L., et al. 2011, MNRAS, 413, 2218 [NASA ADS] [CrossRef] [Google Scholar]
- Desidera, S., & Barbieri, M. 2007, A&A, 462, 345 [NASA ADS] [CrossRef] [EDP Sciences] [Google Scholar]
- Desidera, S., Carolo, E., Gratton, R., et al. 2011, A&A, 533, A90 [NASA ADS] [CrossRef] [EDP Sciences] [Google Scholar]
- Dobbie, P. D., Burleigh, M. R., Levan, A. J., et al. 2005, MNRAS, 357, 1049 [NASA ADS] [CrossRef] [Google Scholar]
- D’Orazi, V., Biazzo, K., Desidera, S., et al. 2012, MNRAS, 423, 2789 [NASA ADS] [CrossRef] [Google Scholar]
- Dumusque, X., Pepe, F., Lovis, C., et al. 2012, Nature, 491, 207 [NASA ADS] [CrossRef] [PubMed] [Google Scholar]
- Duquennoy, A., & Mayor, M. 1991, A&A, 248, 485 [NASA ADS] [Google Scholar]
- Edvardsson, B., Andersen, J., Gustafsson, B., et al. 1993, A&A, 275, 101 [NASA ADS] [Google Scholar]
- Eisenhauer, F., Abuter, R., Bickert, K., et al. 2003, in SPIE Conf. Ser. 4841, eds. M. Iye, & A. F. M. Moorwood, 1548 [Google Scholar]
- Els, S. G., Sterzik, M. F., Marchis, F., et al. 2001, A&A, 370, L1 [NASA ADS] [CrossRef] [EDP Sciences] [Google Scholar]
- Figueira, P., Marmier, M., Bonfils, X., et al. 2010, A&A, 513, L8 [NASA ADS] [CrossRef] [EDP Sciences] [Google Scholar]
- Findeisen, K., Hillenbrand, L., & Soderblom, D. 2011, AJ, 142, 23 [NASA ADS] [CrossRef] [Google Scholar]
- Fitzpatrick, E. L. 1999, PASP, 111, 63 [NASA ADS] [CrossRef] [Google Scholar]
- Giammichele, N., Bergeron, P., & Dufour, P. 2012, ApJS, 199, 29 [NASA ADS] [CrossRef] [Google Scholar]
- Gould, A., Yee, J. C., Bond, I. A., et al. 2013, ApJ, 763, 141 [NASA ADS] [CrossRef] [Google Scholar]
- Gray, R. O., Corbally, C. J., Garrison, R. F., et al. 2006, AJ, 132, 161 [NASA ADS] [CrossRef] [Google Scholar]
- Hamuy, M., Suntzeff, N. B., Heathcote, S. R., et al. 1994, PASP, 106, 566 [NASA ADS] [CrossRef] [Google Scholar]
- Han, Z., Eggleton, P. P., Podsiadlowski, P., & Tout, C. A. 1995, MNRAS, 277, 1443 [NASA ADS] [CrossRef] [Google Scholar]
- Heintz, W. 2000, Visual Binary Stars, ed. P. Murdin [Google Scholar]
- Hernán-Obispo, M., Gálvez-Ortiz, M. C., Anglada-Escudé, G., et al. 2010, A&A, 512, A45 [NASA ADS] [CrossRef] [EDP Sciences] [Google Scholar]
- Holberg, J. B. 2009, J. Phys. Conf. Ser., 172, 2022 [Google Scholar]
- Holberg, J. B., & Bergeron, P. 2006, AJ, 132, 1221 [NASA ADS] [CrossRef] [EDP Sciences] [Google Scholar]
- Holmberg, J., Nordström, B., & Andersen, J. 2009, A&A, 501, 941 [NASA ADS] [CrossRef] [EDP Sciences] [Google Scholar]
- Huélamo, N., Figueira, P., Bonfils, X., et al. 2008, A&A, 489, L9 [NASA ADS] [CrossRef] [EDP Sciences] [Google Scholar]
- Hurley, J. R., Tout, C. A., & Pols, O. R. 2002, MNRAS, 329, 897 [NASA ADS] [CrossRef] [Google Scholar]
- Ireland, M. J., Monnier, J. D., Tuthill, P. G., et al. 2007, ApJ, 662, 651 [NASA ADS] [CrossRef] [Google Scholar]
- Jeffries, R. D., & Smalley, B. 1996, A&A, 315, L19 [NASA ADS] [Google Scholar]
- Jeffries, R. D., & Stevens, I. R. 1996, MNRAS, 279, 180 [NASA ADS] [CrossRef] [Google Scholar]
- Jorissen, A., Van Eck, S., Mayor, M., & Udry, S. 1998, A&A, 332, 877 [NASA ADS] [Google Scholar]
- Käppeler, F., Gallino, R., Bisterzo, S., & Aoki, W. 2011, Rev. Mod. Phys., 83, 157 [NASA ADS] [CrossRef] [EDP Sciences] [Google Scholar]
- Karovska, M., Hack, W., Raymond, J., & Guinan, E. 1997, ApJ, 482, L175 [NASA ADS] [CrossRef] [Google Scholar]
- Koester, D. 2010, Mem. Soc. Astron. Italiana, 81, 921 [Google Scholar]
- Kowalski, P. M., & Saumon, D. 2006, ApJ, 651, L137 [Google Scholar]
- Lafrenière, D., Marois, C., Doyon, R., Nadeau, D., & Artigau, É. 2007, ApJ, 660, 770 [NASA ADS] [CrossRef] [Google Scholar]
- Lanza, A. F., Bonomo, A. S., Moutou, C., et al. 2010, A&A, 520, A53 [NASA ADS] [CrossRef] [EDP Sciences] [Google Scholar]
- Lenzen, R., Hartung, M., Brandner, W., et al. 2003, in SPIE Conf. Ser., 4841, 944 [Google Scholar]
- Lovis, C., Dumusque, X., Santos, N. C., et al. 2011, A&A, submitted [arXiv:1107.5325] [Google Scholar]
- Madhusudhan, N., Burrows, A., & Currie, T. 2011, ApJ, 737, 34 [Google Scholar]
- Mamajek, E. E., & Hillenbrand, L. A. 2008, ApJ, 687, 1264 [NASA ADS] [CrossRef] [Google Scholar]
- Marois, C., Lafrenière, D., Doyon, R., Macintosh, B., & Nadeau, D. 2006, ApJ, 641, 556 [Google Scholar]
- Martin, D. C., Fanson, J., Schiminovich, D., et al. 2005, ApJ, 619, L1 [Google Scholar]
- Mason, B. D., Wycoff, G. L., Hartkopf, W. I., Douglass, G. G., & Worley, C. E. 2001, AJ, 122, 3466 [Google Scholar]
- Mawet, D., Absil, O., Montagnier, G., et al. 2012, A&A, 544, A131 [NASA ADS] [CrossRef] [EDP Sciences] [Google Scholar]
- McClure, R. D. 1984, PASP, 96, 117 [NASA ADS] [CrossRef] [Google Scholar]
- McClure, R. D., & Woodsworth, A. W. 1990, ApJ, 352, 709 [NASA ADS] [CrossRef] [Google Scholar]
- McClure, R. D., Fletcher, J. M., & Nemec, J. M. 1980, ApJ, 238, L35 [NASA ADS] [CrossRef] [Google Scholar]
- McConnell, R. K., & Gast, P. W. 1972, Moon, 5, 41 [NASA ADS] [CrossRef] [Google Scholar]
- McCrea, W. H. 1964, MNRAS, 128, 335 [NASA ADS] [Google Scholar]
- Messina, S., Desidera, S., Turatto, M., Lanzafame, A. C., & Guinan, E. F. 2010, A&A, 520, A15 [NASA ADS] [CrossRef] [EDP Sciences] [Google Scholar]
- Messina, S., Desidera, S., Lanzafame, A. C., Turatto, M., & Guinan, E. F. 2011, A&A, 532, A10 [NASA ADS] [CrossRef] [EDP Sciences] [Google Scholar]
- Metchev, S. A., & Hillenbrand, L. A. 2009, ApJS, 181, 62 [NASA ADS] [CrossRef] [Google Scholar]
- Montes, D., López-Santiago, J., Gálvez, M. C., et al. 2001, MNRAS, 328, 45 [NASA ADS] [CrossRef] [MathSciNet] [Google Scholar]
- Mugrauer, M., & Neuhäuser, R. 2005, MNRAS, 361, L15 [NASA ADS] [CrossRef] [Google Scholar]
- Murray, N., Chaboyer, B., Arras, P., Hansen, B., & Noyes, R. W. 2001, ApJ, 555, 801 [NASA ADS] [CrossRef] [Google Scholar]
- North, P., & Duquennoy, A. 1991, A&A, 244, 335 [NASA ADS] [Google Scholar]
- O’Donovan, F. T., Charbonneau, D., Torres, G., et al. 2006, ApJ, 644, 1237 [NASA ADS] [CrossRef] [Google Scholar]
- Perryman, M. A. C., Lindegren, L., Kovalevsky, J., et al. 1997, A&A, 323, L49 [NASA ADS] [Google Scholar]
- Pickles, A. J. 1998, VizieR Online Data Catalog, 611, 863 [Google Scholar]
- Pojmanski, G. 2002, Acta Astron., 52, 397 [NASA ADS] [Google Scholar]
- Pollacco, D. L., Skillen, I., Collier Cameron, A., et al. 2006, PASP, 118, 1407 [NASA ADS] [CrossRef] [Google Scholar]
- Porto de Mello, G. F., & da Silva, L. 1997, ApJ, 476, L89 [NASA ADS] [CrossRef] [Google Scholar]
- Queloz, D., Henry, G. W., Sivan, J. P., et al. 2001, A&A, 379, 279 [NASA ADS] [CrossRef] [EDP Sciences] [Google Scholar]
- Rousset, G., Lacombe, F., Puget, P., et al. 2003, in SPIE Conf. Ser. 4839, eds. P. L. Wizinowich, & D. Bonaccini, 140 [Google Scholar]
- Salaris, M., Serenelli, A., Weiss, A., & Miller Bertolami, M. 2009, ApJ, 692, 1013 [NASA ADS] [CrossRef] [Google Scholar]
- Scargle, J. D. 1982, ApJ, 263, 835 [NASA ADS] [CrossRef] [Google Scholar]
- Setiawan, J., Henning, T., Launhardt, R., et al. 2008, Nature, 451, 38 [NASA ADS] [CrossRef] [PubMed] [Google Scholar]
- Simmerer, J., Sneden, C., Ivans, I. I., et al. 2003, AJ, 125, 2018 [Google Scholar]
- Skrutskie, M. F., Cutri, R. M., Stiening, R., et al. 2006, AJ, 131, 1163 [NASA ADS] [CrossRef] [Google Scholar]
- Smith, G. H., & Redenbaugh, A. K. 2010, PASP, 122, 1303 [NASA ADS] [CrossRef] [Google Scholar]
- Steffen, M. 1985, A&AS, 59, 403 [NASA ADS] [CrossRef] [MathSciNet] [PubMed] [Google Scholar]
- Tomkin, J., Lambert, D. L., Edvardsson, B., Gustafsson, B., & Nissen, P. E. 1989, A&A, 219, L15 [NASA ADS] [Google Scholar]
- Torres, C. A. O., Quast, G. R., da Silva, L., et al. 2006, A&A, 460, 695 [NASA ADS] [CrossRef] [EDP Sciences] [Google Scholar]
- Torres, G., Fressin, F., Batalha, N. M., et al. 2011, ApJ, 727, 24 [NASA ADS] [CrossRef] [Google Scholar]
- Tremblay, P.-E., & Bergeron, P. 2009, ApJ, 696, 1755 [NASA ADS] [CrossRef] [Google Scholar]
- Tremblay, P.-E., Bergeron, P., & Gianninas, A. 2011, ApJ, 730, 128 [NASA ADS] [CrossRef] [Google Scholar]
- van den Bos, W. H. 1929, Circular of the Union Observatory Johannesburg, 80, 59 [NASA ADS] [Google Scholar]
- van Leeuwen, F. 2007, A&A, 474, 653 [NASA ADS] [CrossRef] [EDP Sciences] [Google Scholar]
- Vennes, S. 1999, ApJ, 525, 995 [NASA ADS] [CrossRef] [Google Scholar]
- Vennes, S., Kawka, A., & Németh, P. 2011, MNRAS, 410, 2095 [NASA ADS] [Google Scholar]
- Ventura, P., D’Antona, F., Mazzitelli, I., & Gratton, R. 2001, ApJ, 550, L65 [NASA ADS] [CrossRef] [Google Scholar]
- Vigan, A., Patience, J., Marois, C., et al. 2012, A&A, 544, A9 [NASA ADS] [CrossRef] [EDP Sciences] [Google Scholar]
- Voges, W., Aschenbach, B., Boller, T., et al. 1999, A&A, 349, 389 [NASA ADS] [Google Scholar]
- Williams, P. M. 1975, MNRAS, 170, 343 [NASA ADS] [Google Scholar]
- Zorotovic, M., & Schreiber, M. R. 2013, A&A, 549, A95 [NASA ADS] [CrossRef] [EDP Sciences] [Google Scholar]
All Tables
All Figures
|
Fig. 1 VLT/NACO, H-band image (1.65 μm) of the companion. The frame was generated from the median combination of processed images after spatial filtering (5 × 5λ/D box) and de-rotation. The central core of the PSF is saturated and has been masked in this image. |
| In the text | |
|
Fig. 2 Radial velocity of the star measured with four instruments: CORAVEL (green), CORALIE98 (red), CORALIE07 (blue), and HARPS (black). The solid black line is a least-squares fit of a quadratic RV trend. While the drift information alone is consistent with either a BD or WD interpretation, the inclusion of the separation information, as gathered from NACO, allows us to rule out the BD possibility. |
| In the text | |
|
Fig. 3 U-band EFOSC image of the binary system. HD 8049 B, in the southeast side, is 1.7 mag fainter. |
| In the text | |
|
Fig. 4 SINFONI spectrum of HD 8049 B in J-band (left) and HK-band (right). |
| In the text | |
|
Fig. 5 Absolute magnitude in different bands (from top-left FUV, NUV, V and H) versus effective temperature for the white dwarf models of Vennes et al. (2011) (black lines) and a sample of nearby dwarfs collected by Giammichele et al. (2012). Stars represent objects with all magnitudes available and diamonds represent the other. Colors indicate the mass from the lowest (blue) to the highest (red ones) white dwarfs. The continuous blue horizontal line represents the magnitude of HD 8049 B. The corresponding error bars are plotted as dashed blue lines. The plots show that the objects of the Giammichele et al. (2012) catalog are not peculiar and are well described by the theoretical models of Vennes et al. (2011). |
| In the text | |
|
Fig. 6 Top: observed magnitudes of the system plotted over the synthetic spectra. Blue points are those taken in consideration during the SED fitting of the WD. Triangle-shaped ones are not considered during the PASTIS integration. Values of the magnitudes of the integrated system are represented in red and the SED in black. The primary star SED is represented in green. Bottom: two parameters joint posterior distributions for HD 8049 B. The 68.3%, 95.5% and 99.7% confidence regions are denoted by light gray, dark gray and black areas, respectively. Single PDF of each combination is shown along the sides. |
| In the text | |
|
Fig. 7 Absolute magnitude in different bands (from top-left FUV, NUV, V and H) versus cooling age for the white dwarf models of Vennes et al. (2011) (black lines) and a sample of nearby dwarfs collected by Giammichele et al. (2012). Stars represent objects with all magnitudes available and diamonds represent the other. Colors indicate the mass from the lowest (blue) to the highest (red ones) white dwarfs. The continuous blue horizontal line represents the magnitude of HD 8049 B. The corresponding error bars are plotted as dashed blue lines. The plots show that the objects of the Giammichele et al. (2012) catalog are not peculiar and are well described by the theoretical models of Vennes et al. (2011). |
| In the text | |
|
Fig. 8 Photometry time-series of HD 8049 from SuperWASP: left columns display time segments of magnitudes versus heliocentric Julian days (HJD) (the first panel only shows the complete series). The middle columns display the Lomb-Scargle periodograms with an indication of the rotation period. The right columns display the light curves phased with the rotation period and the first HJD as initial epoch. Solid curves represent the sinusoidal fit with the rotation period. The labels report the ratio of average residual from the fit and the rotational modulation amplitude. |
| In the text | |
|
Fig. 9 Monte Carlo simulation results showing orbital parameters for orbital solutions compatible with the observational data. Colors indicate different levels of χ-squared values (decreasing from black to blue and finally red). The plots show that some parameters are well constrained in a region of parameters space while others can span all possible values. See Sect. 5.1 for information on the Monte Carlo procedures. |
| In the text | |
|
Fig. 10 Histograms of orbital parameters derived with a Monte Carlo simulation following the example of Desidera et al. (2011). |
| In the text | |
Current usage metrics show cumulative count of Article Views (full-text article views including HTML views, PDF and ePub downloads, according to the available data) and Abstracts Views on Vision4Press platform.
Data correspond to usage on the plateform after 2015. The current usage metrics is available 48-96 hours after online publication and is updated daily on week days.
Initial download of the metrics may take a while.