Fig. 9
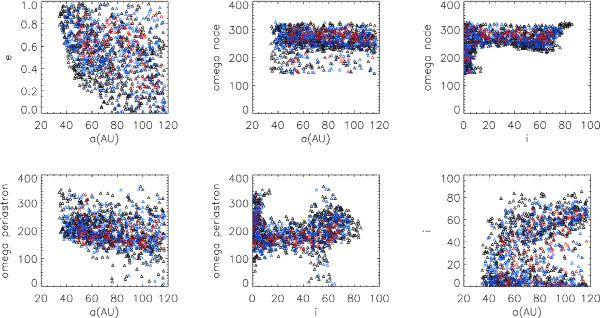
Monte Carlo simulation results showing orbital parameters for orbital solutions compatible with the observational data. Colors indicate different levels of χ-squared values (decreasing from black to blue and finally red). The plots show that some parameters are well constrained in a region of parameters space while others can span all possible values. See Sect. 5.1 for information on the Monte Carlo procedures.
Current usage metrics show cumulative count of Article Views (full-text article views including HTML views, PDF and ePub downloads, according to the available data) and Abstracts Views on Vision4Press platform.
Data correspond to usage on the plateform after 2015. The current usage metrics is available 48-96 hours after online publication and is updated daily on week days.
Initial download of the metrics may take a while.