Fig. 6
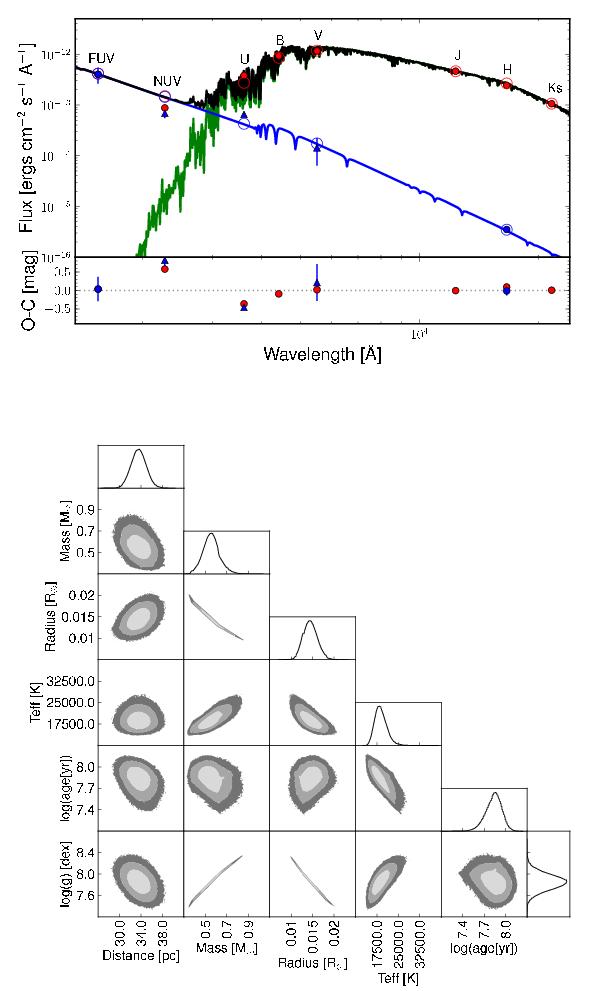
Top: observed magnitudes of the system plotted over the synthetic spectra. Blue points are those taken in consideration during the SED fitting of the WD. Triangle-shaped ones are not considered during the PASTIS integration. Values of the magnitudes of the integrated system are represented in red and the SED in black. The primary star SED is represented in green. Bottom: two parameters joint posterior distributions for HD 8049 B. The 68.3%, 95.5% and 99.7% confidence regions are denoted by light gray, dark gray and black areas, respectively. Single PDF of each combination is shown along the sides.
Current usage metrics show cumulative count of Article Views (full-text article views including HTML views, PDF and ePub downloads, according to the available data) and Abstracts Views on Vision4Press platform.
Data correspond to usage on the plateform after 2015. The current usage metrics is available 48-96 hours after online publication and is updated daily on week days.
Initial download of the metrics may take a while.