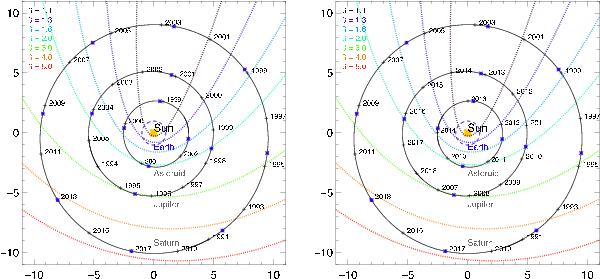
Fig. 5

Orbit of the Earth, asteroid Ceres, Jupiter, and Saturn around the Sun, with the β-cones shown by colored dotted lines. The positions for which we show the β-Q/m plots in Appendix C and size distributions in Sects. 5.1.1, 5.2.3, and 5.3.1 are indicated as blue dots. The left plot corresponds to the defocusing phase, and the right plot corresponds to the focusing phase of the solar cycle for the asteroid and Jupiter orbits. Galileo was flying from 1996 until 2003 and was thus in large parts of its orbit in the β-cones, as well as moving in the same direction of the dust flow.
Current usage metrics show cumulative count of Article Views (full-text article views including HTML views, PDF and ePub downloads, according to the available data) and Abstracts Views on Vision4Press platform.
Data correspond to usage on the plateform after 2015. The current usage metrics is available 48-96 hours after online publication and is updated daily on week days.
Initial download of the metrics may take a while.


