| Issue |
A&A
Volume 551, March 2013
|
|
|---|---|---|
| Article Number | A115 | |
| Number of page(s) | 12 | |
| Section | Extragalactic astronomy | |
| DOI | https://doi.org/10.1051/0004-6361/201220811 | |
| Published online | 05 March 2013 | |
H2O emission in high-z ultra-luminous infrared galaxies⋆
1 UPMC Univ. Paris 06, UMR7095, Institut d’Astrophysique de Paris, 75014 Paris, France
e-mail: This email address is being protected from spambots. You need JavaScript enabled to view it.
2 CNRS, UMR7095, Institut d’Astrophysique de Paris, 75014 Paris, France
3 Purple Mountain Observatory, Nanjing, PR China
4 Department of Astronomy, Beijing Normal University, Beijing, PR China
5 Institut de Radioastronomie Millimétrique (IRAM), 300 rue de la Piscine, 38406 Saint-Martin d’ Hères, France
6 Univ. Paris-Sud and CNRS, Institut d’Astrophysique Spatiale, UMR8617, 91405 Orsay, France
7 Harvard-Smithsonian Center for Astrophysics, 60 Garden Street, Cambridge, MA 02138, USA
8 Leiden Observatory, Leiden University, Post Office Box 9513, 2300 RA Leiden, The Netherlands
9 Department of Astronomy, Space Science Building, Cornell University, Ithaca, NY, 14853-6801, USA
10 Centre for Astronomy & Particle Theory, University Park, Nottingham, NG7 2RD, UK
11 Institute for Astronomy, University of Edinburgh, Royal Observatory, Blackford Hill, Edinburgh EH9 3HJ, UK
12 Department of Physics and Astronomy, University of Pennsylvania, Philadephia, PA 19104, US
13 Sterrenkundig Observatorium, Universiteit Gent, Krijgslaan 281-S9, 9000 Gent, Belgium
14 Department of Physics and Astronomy, Rutgers, The State University of New Jersey, Piscataway, NJ 08854-8019, USA
15 Argelander Institut fur Astronomie, Universitat Bonn, Auf dem Hugel 71, 53121 Bonn, Germany
16 Universitat Wien, Institut fur Astronomie, Turkenschanz-strasse 17, 1180 Wien, Austria
17 School of Physics and Astronomy, Cardiff University, Queens Buildings, The Parade 5, Cardiff, CF24 3AA, UK
18 Department of Physics and Astronomy, University of California, Irvine, CA 92697, USA
19 Department of Astronomy, University of Maryland, College Park, MD 20742, USA
20 Max-Plank-Institut fur Radioastronomie, Auf dem Hugel 69, 53121 Bonn, Germany
21 INAF-Osservatorio Astronomico di Padova, Vicolo Osservatorio 5, 35122 Padova, and SISSA, via Bonomea 265, 34136 Trieste, Italy
22 Department of Physics and Astronomy, The Open University, Walton Hall, Milton Keynes, MK7 6AA, UK
23 Astrophysics Branch, NASA Ames Research Center, MS 245-6, Moffett Field, CA 94035, USA
24 Astrophysics, Department of Physics, Keble Road, Oxford OX1 3RH, UK
25 School of Astronomy, Institute for Research in Fundamental Sciences (IPM), PO Box 19395-5746, Tehran, Iran
26 Department of Physics and Astronomy, University of Canterbury, Private Bag 4800, Christchurch, 8140, NZ
27 School of Physics and Astronomy, University of Nottingham, University Park, Nottingham NG7 2RD, UK
28 California Institute of Technology, 1200 E. California Blvd, Pasadena, CA 91125, USA
29 Jet Propulsion Laboratory, Pasadena, CA 91109, USA
30 University of Colorado, CASA 389-UCB, Boulder, CO 80303, USA
31 GEPI, Observatoire de Paris, CNRS, Université Paris Diderot, 5 Place Jules Janssen, 92190 Meudon, France
32 UK Astronomy Technology Centre, The Royal Observatory, Blackford Hill, Edinburgh, EH9 3HJ, UK
33 Universidad Catolica de Chile, Departamento de Astronomia y Astrofisica, Casilla 306, Santiago 22, Chile
34 Department of Physics, University of the Western Cape, Private Bag X17, Bellville 7535, South Africa
35 Astrophysics Group, Imperial College,Blackett Laboratory, Prince Consort Road, London, SW7 2AZ, UK
36 College of Graduate Studies, University of South Africa, PO Box 392, Unisa, 003, South Africa
Received: 28 November 2012
Accepted: 7 January 2013
Abstract
Using the IRAM Plateau de Bure interferometer (PdBI), we report the detection of water vapor in six new lensed ultra-luminous starburst galaxies at high redshift, discovered in the Herschel Astrophysical Terahertz Large Area Survey (H-ATLAS). The sources are detected either in the 202−111 or 211−202 H2O emission lines with integrated line fluxes ranging from 1.8 to 14 Jy km s-1. The corresponding apparent luminosities are μLH2O ~ 3−12 × 108 L⊙, where μ is the lensing magnification factor (3 < μ < 12). These results confirm that H2O lines are among the strongest molecular lines in high-z ultra-luminous starburst galaxies, with intensities almost comparable to those of the high-J CO lines, and similar profiles and line widths (~200−900 km s-1). With the current sensitivity of the PdBI, the water lines can therefore easily be detected in high-z lensed galaxies (with F(500 μm) > 100 mJy) discovered in the Herschel surveys. Correcting the luminosities for amplification, using existing lensing models, LH2O is found to have a strong dependence on the infrared luminosity, varying as ~LIR1.2. This relation, which needs to be confirmed with better statistics, may indicate a role of radiative (infrared) excitation of the H2O lines, and implies that high-z galaxies with LIR ≳ 1013 L⊙ tend to be very strong emitters in water vapor, that have no equivalent in the local universe.
Key words: galaxies: high-redshift / galaxies: starburst / infrared: galaxies / submillimeter: galaxies / radio lines: galaxies
Herschel (Pilbratt et al. 2010) is an ESA space observatory with science instruments provided by European-led Principal Investigator consortia and with important participation from NASA.
© ESO, 2013
1. Introduction
Water plays an important role in the warm dense interstellar medium of galaxies. First, after CO, H2O is the most abundant oxygen-bearing molecule, and, second, it can be an important coolant of the warm gas. Due to the Earth’s atmosphere, bulk gas-phase water can only be detected from space or from the ground toward distant objects with redshifts that move the H2O lines into atmospheric windows.
The study of water emission lines in nearby galaxies has recently made significant progress thanks to the availability of their infrared/submillimeter spectra using the spectrometer mode of the Herschel Spectral and Photometric Imaging REceiver (SPIRE, Griffin et al. 2010) and the Photodetecting Array Camera and Spectrometer (PACS, Poglitsch et al. 2010). The spectra of local ultra-luminous infrared galaxies (ULIRGs) and composite AGN/starbursts such as Mrk 231 (van der Werf et al. 2010), Arp 220 (Rangwala et al. 2011; González-Alfonso et al. 2012), and NGC 4418 (González-Alfonso et al. 2012) reveal a wealth of water lines and the presence of associated molecules such as OH+, H2O+ and isotopologues. Together with high-J CO lines, these lines provide an important diagnostic of the warm dense cores of nearby ULIRGs.
In the cases of Mrk 231 and Arp 220, water emission lines up to energy levels of Eup / k = 642 K are detected with strong line fluxes that reach 25%−75% of the neighboring CO emission line fluxes. Spectral surveys made with Herschel show that low-z ULIRGs always exhibit bright H2O lines, whereas only one third of the sample of luminous infrared galaxies (LIRGs) displays luminous H2O emission lines (van der Werf et al., in prep.), indicating that the strength of the water lines and the infrared luminosity, LIR, must be related. The analysis of the H2O emission lines in Mrk 231 shows that the excitation of the water molecules results from a combination of collisions and infrared excitation through far-infrared lines in warm dense gas (≥100 K, ≥105 cm-3). Moreover, the far-infrared radiation field dominates the excitation of the high levels and their emission lines (González-Alfonso et al. 2010). Preliminary evidence from the comparison of the spectra of Arp 220, Mrk 231 and NGC 4418 shows that the properties of the water emission lines in their nuclear regions vary as a function of chemistry, nucleosynthesis, and inner motions (outflow/infall) – see Rangwala et al. (2011) and González-Alfonso et al. (2012).
Observation Log.
First detections of H2O megamasers at high redshift were reported in objects at z = 0.66 and 2.64 by Barvainis & Antonucci (2005) and Impellizzeri et al. (2008), while further searches have failed since then (McKean et al. 2011). Following initial attempts to detect H2O rotational emission lines from high-z galaxies (Wagg et al. 2006; Riechers et al. 2006, 2009) and tentative detections in IRAS F10214+4724 at z = 2.23 (Casoli et al. 1994) and in the Cloverleaf at z = 2.56 (Bradford et al. 2009), a series of robust detections of non-maser H2O emission lines were recently reported in high-z sources. The sources detected in H2O emission lines include a strongly lensed galaxy, HATLAS J090302.9−014127 (SDP.17b) at z = 2.3 (Omont et al. 2011), which was uncovered in the Herschel Astrophysical Terahertz Large Area Survey (H-ATLAS; Eales et al. 2010); the gravitationally lensed quasar APM 08279+5255 at z = 3.9 (van der Werf et al. 2011; Bradford et al. 2011; Lis et al. 2011); HLSJ091828.6+514223, a lensed submillimeter galaxy at z = 5.2 in the field of Abell 773 (Combes et al. 2012), which was found in the Herschel Lensing Survey (Egami et al. 2010), IRAS F10214+4724 (Riechers et al., in prep.). For most of these sources, only one water emission line was reported, with the exception of APM 08279+5255, where a total of at least five emission lines with Eu / k = 101 to 454 K were detected (van der Werf et al. 2011; Lis et al. 2011; Bradford et al. 2011). These results underline the unique and powerful diagnostic power of H2O emission lines, which give better insight into local conditions in distant galaxies than may be obtained by other means. As in Mrk 231, they reveal the presence of extended, warm and dense gas located in the infrared-opaque regions of the galactic cores.
This new window in the exploration of high-z sources is based on the combined availability of new instrumentation with improved sensitivities at key facilities and the increasing number of gravitationally lensed sources discovered in the Herschel and South Pole Telescope (SPT) cosmological surveys (see, e.g., Negrello et al. 2010; Vieira et al. 2010). Following the results reported by Omont et al. (2011), we present here a new study of water emission in six high-z lensed ULIRGs, which were selected from the H-ATLAS survey. The data, which were obtained using the IRAM Plateau de Bure Interferometer (PdBI), clearly show water emission lines in all the sources. Based on these results, we derive a clear relation between the H2O and the infrared luminosities in high-z ULIRGs.
Throughout this paper, we adopt a cosmology with H0 = 71 km s-1 Mpc-1, ΩM = 0.27, ΩΛ = 0.73 (Spergel et al. 2003).
Submillimeter and infrared properties of the lensed ultra-luminous galaxies.
Observed parameters of the CO emission lines.
2. Sample selection and observations
The detection of strong H2O emission in the lensed H-ATLAS galaxy SDP.17b by Omont et al. (2011) suggested that the H-ATLAS survey offered a unique opportunity to select an homogeneous sample of bright lensed galaxies spanning a broad range in luminosity and redshift to further study the properties of water emission in the early universe. We selected from the H-ATLAS catalog sources with strong flux densities (with F500 μm > 150 mJy) that were well characterized, i.e. had CO redshift measurements, additional sub/millimeter imaging and available deflector identification (see, e.g., Negrello et al. 2010; Bussmann et al., in prep.). In the selection, we also somewhat preferred sources at z > 3 to shift the H2O lines in the low frequency bands that are easier to observe. Finally, we chose sources spanning a wide range in intrinsic infrared luminosities from ~5 × 10¹² to ~2 × 10¹³ L⊙.
In this paper, we report the first results of this survey and describe the properties of the H2O emission for six new sources. The sample includes (see Table 1 for IAU names of the sources) i) sources reported in the initial H-ATLAS science demonstration phase paper by Negrello et al. (2010) – SDP.9 and SDP.81, together with SDP.17b, which was discussed in Omont et al. (2011); ii) two other well-studied sources from the H-ATLAS equatorial fields − G12.v2.30 (Fu et al. 2012) and G15.v2.779 (Cox et al. 2011; Bussmann et al. 2012); iii) two sources from the H-ATLAS NGP field, NA.v1.144 and NB.v1.78, for which CO observations (Harris et al. 2012; Riechers et al., in prep.; and this paper) and submillimeter imaging (Bussmann et al., in prep.) are available. Table 1 provides details on the H2O observations of the seven H-ATLAS lensed galaxies, Table 2 lists their submillimeter and infrared properties together with the estimated amplification factors (see Sects. 3.2 and 4.1), and Table 3 gives their CO properties available from recent measurements using the PdBI.
The redshifts of the seven selected galaxies range from 1.57 to 4.24, with the majority in the range 2.0 < z < 3.3. In the sample, G15.v2.779 is the only source at z > 4 and, for the time being, the highest redshift lensed galaxy spectroscoptically confirmed in the H-ATLAS survey. For each source, at least one of the two strongest low-excitation H2O lines is in an atmospheric window observable with the PdBI, either H2O(211–202) with νrest = 752.033 GHz and Eup = 137 K, or H2O(202–111) with νrest = 987.927 GHz and Eup = 101 K. As both lines have comparable intensities in Arp 220 and Mrk 231 (see Sect. 4), in the rare cases where both lines are observable, we chose the line at the lower frequency that is easier to observe, except in the case of SDP.17b (Omont et al. 2011), where the line H2O(202 − 111) was selected to confirm the tentative detection that was reported by Lupu et al. (2012). Note that these two observed lines are both para-H2O and they are adjacent lines in the H2O level diagram.
The H2O observations were conducted in the compact D-configuration from December 2011 to March 2012 in conditions of good atmospheric phase stability (seeing of 1′′) and reasonable transparency (PWV ≤ 1 mm). Except for SDP.81, which was observed with five antennas, all other sources were observed with the six antennas of the PdBI array. The total on-source integration ranges from ~1 to 2 hours (Table 1). We used Bands 2, 3 and 4, which cover the frequency ranges 129−174 GHz, 201−267 GHz and 277−371 GHz, and the band centers were tuned to the redshifted frequency of the selected H2O emission line using the redshifts estimated from CO observations (Table 3). The correlator (WideX) provided a contiguous frequency coverage of 3.6 GHz in dual polarization with a fixed channel spacing of 1.95 MHz, allowing us to detect the continuum as well as any additional emission lines, if present. In the compact configuration, the baselines extend from 24 to 179 m, resulting in synthesized beams of ~1.5′′ × 1.0′′ to ~4′′ × 3′′ (Table 1). Only SDP.81, G12.v2.30 and NB.v1.78 are resolved at this angular resolution (Fig. 2).
During the observations, the phase and bandpass were calibrated by measuring standards sources that are regularly monitored at the IRAM PdBI, including 3C84, 3C279, MWC349, CRL618, and 0851+202. The accuracy of the flux calibration is estimated to range from ~10% at 2 mm to ~20% at 0.8 mm.
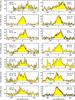 |
Fig. 1 Spectra of the H2O and CO emission lines observed at PdBI toward the seven lensed high-redshift ultra-luminous galaxies discussed in this paper. The H2O emission lines are displayed in the left column (showing the (211 − 202) or the (202 − 111) transition; the transitions are identified in each box). The CO spectra are displayed in the right column (showing 3–2, 4–3, 5–4 and 7–6 rotational transitions – for G15.v2.779, the [CI] emission line is included in the band). The transitions are indentified in each box. All spectra include the continuum, and the H2O frequencies corresponding to the zero velocity are given in Table 4. The red lines trace the Gaussian fits to the H2O and CO line profiles and the fit to the continuum emission level. In all cases, the match between the H2O and CO spectra is excellent both in redshift and in the details of the line profile – see text. |
To complement the H2O data, we include in this paper new results on the CO emission for the seven sources. For five of them, the CO data were obtained in 2011 and 2012 using the PdBI in the A-configuration. Those data were acquired in the frame of a survey of lensed ULIRGs to map their CO and dust continuum emission at high-angular resolution (Cox et al., in prep.) and a full description of the results will be given in that paper. For two of the sources, NB.v1.78 and G12.v2.30, the CO data were obtained in August 2012 in the D-configuration with five antennas. The observations were made in good weather conditions and more details are provided in Table 3. In this paper, we only present the global CO spectra (i.e., integrated over the source’s extent) with the goal to compare the characteristics of the H2O and CO emission line profiles. A detailed discussion of the morphology, the dynamics, and the lensing of these sources will be given in Cox et al. (in prep.).
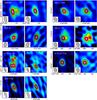 |
Fig. 2 Images of the submillimeter continuum (left panel) and H2O line emission (right panel – see Fig. 1 and Table 4 for the identification of the transitions) for the seven high-z lensed ultra-luminous galaxies studied in this paper (sources are identified in the left panels). Synthesized beams are shown in the lower left corner of each map. The map centers correspond to the coordinates given in Table 1 and are indicated by a cross. For the continuum maps, the contours start from 3σ in steps of 3σ for SDP.81 and G12.v2.30, and in steps of 6σ for the other sources; for the H2O line emission maps, the contours start from 3σ in steps of 1σ (for SDP.81) and 2σ for the other sources. For each source, the 1σ continuum (mJy/beam) and emission line (Jy km s-1/beam) noise levels are as follows: SDP.81 (0.60/0.18), NA.v1.144 (0.35/0.31), SDP.9 (0.50/0.59), NB.v1.78 (0.28/0.30), G12.v2.30 (0.28/0.28), G15.v2.779 (0.11/0.24), and SDP.17b (0.73/0.56). Four sources remain unresolved at the current angular resolution, whereas SDP.81, NB.v1.78, and G12.v2.30 display complex lensing morphologies both in the continuum and line emission that are revealed even at the present low angular resolution. Detailed comments on the sources are given in the text (Sect. 3). |
Observed parameters of the H2O emission lines and continuum emission.
3. Properties of the H2O emission lines
3.1. General properties
The seven lensed high-z ULIRGs are all detected with high signal-to-noise ratios (S / N ≳ 6), except SDP.81, either in the 202–111 or the 211–202 H2O emission line (see Fig. 1), as well as in the underlying redshifted submillimeter continuum emission (S / N > 20). The water emission lines are strong, with integrated fluxes ranging from 1.8 to 14 Jy km s-1 (Fig. 1 and Table 4). This indicates that in high-z ULIRGs, they are the strongest molecular submillimeter emission lines after those of high-J CO (see Sect. 4.3; note, however, that 2 mm and 3 mm CO lines displayed in Fig. 1 may have weaker intensity than the 1 mm H2O lines).
The H2O linewidths (FWHM) range from 140 to 900 km s-1 (Table 4). The lines have a variety of profiles including single Gaussian profiles (NA.v1.144, NB.v1.78), double-peaked profiles (G12.v2.779), or asymmetrical profiles (SDP.9, SDP.17b, SDP.81). The H2O and CO line profiles share similar properties (shape, linewidth) in all sources, suggesting that there is no strong differential lensing effects between the CO and the H2O emission lines.
From the spatially integrated H2O line flux, IH2O, the apparent H2O luminosity, μLH2O where μ is the lensing magnification factor, can be derived using the relations given in, e.g., Solomon et al. (1992). μLH2O varies by only a factor of ~4 from SDP.81 to NB.v1.78 or G12.v2.30 (Table 4). Figure 3 displays the relation between μLH2O and μLIR, including the values for local ULIRGs (Yang et al., in prep.). The infrared and H2O apparent luminosities are one or two orders of magnitude higher in these high-z galaxies than in local ULIRGs. However, the ratios LH2O / LIR are similar, although slightly higher for the high-z galaxies.
Figure 2 displays the images of the H2O emission line and the corresponding submillimeter continuum emission for the seven lensed high-z ULIRGs. The relatively low angular resolution (at best ~1′′) of the current data limits for most of the sources a detailed study of the spatial properties of their signal. Four of the sources remain unresolved at the present angular resolution: SDP.9, SDP.17b, NA.v1.144, and G15.v2.779. The three remaining sources are extended and display distinct lensed morphologies including two-image configuration system (SDP.81), a complex elongated structure (G12.v2.30), and an extended structure (NB.v1.78). Each source is described in detail below.
Table 4 reports the values of the H2O velocity-integrated flux density (line flux) detected at the peak of the source in one synthesized beam, IH2Opk, and the velocity-integrated line flux integrated over the source size, IH2O. In most cases, the ratio IH2O / IH2Opk is lower than 1.5, except for the extended sources G12.v2.30 and NB.v1.78. For the other sources studied in this paper, except for SDP.81, it is thus unlikely that significant flux is missed. This is also confirmed when comparing our total spatially integrated continuum flux density Sν with measurements published elsewhere at the nearby frequency of 250 GHz, using the bolometer MAMBO camera at the IRAM 30-m telescope (Negrello et al. 2010; Dannerbauer et al., in prep.). NA.v1.144 and SDP.81, which were observed at the PdBI close to 250 GHz, agree very well with MAMBO observations. For SDP.9 and SDP.17b, which were observed at the PdBI close to 300 GHz, the comparison is more difficult; however, Sν is somewhat higher than the values expected from extrapolations of the MAMBO values. Although there is no MAMBO observation for NB.v1.78, Sν agrees fairly well with the flux density measured at 880 μm using the Smithsonian Millimeter Array (SMA; Bussmann et al. in prep.). Finally, the continuum flux density measured at 143 GHz for G15.v2.779 is in excellent agreement with the value reported by Cox et al. (2011) at 154 GHz.
The 3.6 GHz bandwidth covered by the PdBI receivers (and correlator), which was generally centered on the redshifted frequency of the H2O emission line, encompasses other potential emission lines of interest, including i) 13CO, H O, H
O, H O, H3O+ in the vicinity of H2O(202–111); and ii) H2O+(202–111, J3 / 2,3 / 2 and J5 / 2,3 / 2) in the vicinity of H2O(211–202)). However, the current sensitivity of our spectra is too low to detect these lines, which are not seen in the Herschel spectra of Mrk 231 and Arp 220 except for the two H2O+ lines, which are present in the spectrum of Arp 220 (Rangwala et al. 2011). Apart from the H2O emission lines, no other emission line is detected at the S/N of the spectra of the seven high-z galaxies studied in this paper.
3.2. Individual sources
The following describes the properties of the individual lensed galaxies.
3.2.1. SDP.81 at z = 3.040
The source SDP.81 is at the highest redshift among the SDP lensed galaxies of Negrello et al. (2010). It displays two arcs in the SMA 880 μm data, which are also seen in the Hubble Space Telescope (HST) (Negrello et al., in prep.) and the PdBI CO imaging results (Cox et al., in prep.). Preliminary lensing modeling indicated a very high lensing magnification factor of μ = 19 (Negrello et al. 2010), but this value has been revised downward to μ = 9.5 ± 0.5 based on recent HST data (Dye et al., in prep.). This is confirmed by the SMA 880 μm imaging results which yield μ = 9.5 ± 0.8 (Bussmann et al., in prep. – hereafter B13). As discussed in Sect. 4.1, we adopted the values of μ derived from the 880 μm SMA data by B13 as basic reference for the lensing magnification factors listed in Table 2.
The CO line profile is asymmetrical with a red component that is much stronger than the blue one. The line profile of the H2O emission line is also dominated by a main red component (peaking at ~+ 200 km s-1 with a width of Δv = 140 km s-1). Due to the low S/N of the H2O spectrum, the blue emission component of the profile (peaking at − 100 km s-1) that is clearly seen in the CO spectrum is only barely visible in the H2O emission spectrum (Fig. 1).
Despite the low angular resolution, the dust continuum image is clearly resolved (Fig. 2), showing both gravitational arcs of the 880 μm image of Negrello et al. (2010), with a stronger emission in the eastern arc. This structure is also seen in the CO map of Cox, Ivison et al. which indicates that the stronger red emission traces the bright eastern arc, whereas the weaker blue emission corresponds to the western arc. Due to the low S/N of the data, the H2O emission is seen only in the eastern arc, consistent with the only clear detection of the red part of the spectrum.
The H2O line flux IH2O and the apparent LH2O luminosity, which are given in Table 4, take into account the total emission including the red and blue components. However, due to the low S/N of the H2O data, these numbers are less accurate than for most other sources in our sample. Because the emission is very extended, the spatially integrated H2O line flux IH2O is probably underestimated, as indicated by the absence of significant H2O emission seen in the western arc, and the very small difference between IH2O and IH2Opk compared to the continuum ratio Sν/Sνpk = 2.2.
3.2.2. NA.v1.144 at z = 2.202
The narrow H2O linewidth of NA.v1.144 is the same as is seen in the CO emission line (Δv ~ 200 km s-1). It is the narrowest CO linewidth of our sample (Table 3).
The estimate of the lensing magnification factor from detailed modeling based on the SMA image of the 880 μm continuum emission indicates a low value of μ ~ 4.6 ± 1.5 (B13). However, the SMA imaging of this object has limited uv coverage (only the extended array was used) which might compromise the measurement of the lensing magnification factor. The corresponding values for the IR and CO luminosities appear to be surprisingly high compared to the narrow linewidth. Indeed, the uncertain derivation of μ from the CO linewidth and luminosity (Harris et al. 2012) yields μCO ~ 23 ± 15. Therefore, we have doubled the uncertainty on the SMA value of μ and adopted the rms2-weighted average of the estimate from the SMA dust-continuum and the CO line, i.e. μ = 5.3 ± 2.9.
This bright submillimeter galaxy is clearly unresolved with our present angular resolution, a result that is confirmed by the small extension observed in the SMA results (B13).
3.2.3. SDP.9 at z = 1.574
The galaxy SDP.9 is the brightest 250 μm and lowest redshift of the five lenses discussed in Negrello et al. (2010). Its lensing magnification factor is estimated to be μ = 8.7 ± 0.7 from HST imaging (Dye et al., in prep.). We adopted here the SMA 880 μm value from B13, μ = 8.5 ± 1.8, which agrees with the HST value and also with μCO = 11.
The H2O intensity of SDP.9 is by far the largest of our sample, due to the low redshift of the source. The corresponding apparent H2O luminosity is among the highest found so far. The emission line profiles in H2O and CO are similar, including the strong red emission spike and the weaker, broader blue emission (Fig. 1). The high angular CO data from Cox et al. (in prep.) as well as the HST/WFC3 imaging data (Negrello et al., in prep.) show that SDP.9 is a good example of an Einstein ring, with a clear asymmetry between the east and west arcs. However, our angular resolution is not high enough to resolve the emission.
3.2.4. NB.v1.78 at z = 3.111
This source has one of the highest redshifts and highestt apparent luminosities in our sample. The intermediate linewidth of the CO and H2O lines (Δv ~ 550 km s-1) is consistent with those measured in the mid-J CO lines used to initially determine the redshift with CARMA (Riechers et al., in prep.). The H2O line is indeed the brightest line measured in this source so far and thus provides the best constraints on the line profile. The moderate CO intensity and linewidth indicates intermediate CO, H2O and infrared intrinsic luminosities, LIR ≈ 1013 L⊙.
The lensing magnification factor, derived from the SMA 880 μm imaging results, is μ = 10.5 ± 1.4 (B13), a value which is adopted in this paper and is consistent with μCO = 12 (inferred from the CO data of Table 3).
The source is resolved and shows a relatively complex morphology in the H2O and continuum maps. The peak value in a single beam, IH2Opk, reported in Table 4, is lower than the spatially integrated value IH2O by a factor ~2.5. The ratio is similar for the 240 GHz continuum, where the peak value is 15.4 mJy/beam and the integrated flux density is 36.9 mJy (see Table 4). In addition to the southeast main peak, there are northern and southwestern extensions (Fig. 2). This morphology is also seen in recent SMA 880 μm imaging results (Bussmann et al., in prep.). However, the southwest peak is very strong in H2O compared to the main southeast peak and the peak ratio in the continuum. This could suggest that the H2O emitting region is more compact than the continuum.
3.2.5. G12.v2.30 at z = 3.259
G12.v2.30 is another prominent source among the H-ATLAS brightest lenses. Its complex differential lensing has been analyzed by Fu et al. (2012), showing that the lensing is very different in the near-infrared compared to the submillimeter or CO emission. The various estimates of the lensing magnification factor based on submillimeter images or the CO linewidths are comparable: μ = 7.6 ± 1.5 for the dust submillimeter and 6.9 ± 1.6 for CO(1 − 0) imaging by Fu et al.; 9.6 ± 0.9 for the same submillimeter data by B13 (the value adopted here); μCO = 7 ± 2 by Harris et al. (2012) from CO(1 − 0) linewidth and luminosity. These values confirm that G12.v2.30 is one of the most luminous infrared galaxies in H-ATLAS with an estimated LIR ~ 1.6 × 10¹³ L⊙.
The H2O profile appears to be double peaked with a total width of ~700 km s-1. Due to the short integration time of the observations, the CO results for G12.v2.30 are the noisiest of our sample and the details of the profile, in particular, its double-peaked nature remain unclear. Within the noise, the CO profile is compatible with the H2O emission, although additional observations are needed to confirm this result.
The source is resolved with the present angular resolution of 2.0′′ × 1.0′′ and shows a complex structure that is most clearly seen in the continuum map (Fig. 2): an elongated arc to the south shows two peaks and emission is seen about 2′′ to the north. Due to the low S/N, only the southern component is detected in the H2O emission line. G12.v2.30 appears to be a complex source. The dust and gas emissions as well as the stellar emission have very different morphologies, which indicates that the lensing potential is unusual (Fu et al. 2012). Estimating the total intensity of the H2O line remains difficult for G12.v2.30. The peak value in a single beam, IH2Opk, reported in Table 4, is lower than the spatially integrated value IH2O by a factor ~2.4. The situation is similar for the 240 GHz continuum, where the peak value is 4.9 mJy/beam and the integrated flux density is 21.0 mJy (see Table 4). This latter value is itself much lower than the flux density of ~36 mJy measured at 1.2 mm using MAMBO at the 30-m telescope (Dannerbauer et al., in prep.). However, the reported value for the spatially integrated line flux IH2O is less accurate than for most other sources in our sample. Because the emission is very extended, the spatially integrated H2O line flux IH2O is probably underestimated, similarly to the continuum, as indicated for the latter by the factor ~1.5 lower compared to the MAMBO value.
Properties of the dust continuum and the H2O line emission.
3.2.6. G15.v2.779 at z = 4.244
With a redshift higher than 4 and F500 μm = 204 ± 32 mJy, G15.v2.779 (also refered to as ID.141) remains unique in the H-ATLAS survey (Cox et al. 2011). Its lensing magnification factor has recently been estimated to be only 4.1 ± 0.2 (Bussmann et al. 2012), which makes it the most luminous H-ATLAS source, with LIR = 2 × 10¹³ L⊙. This is consistent with the broad CO lines, the widest of our sample (760 − 890 km s-1), which would imply μCO ~ 8. The H2O line has one of the largest S/N thanks to good observing conditions in the 2 mm window.
The width and the characteristics of the complex, double-peaked H2O line agree well with those of the CO(7−6) and [CI] lines (Fig. 1). G15.v2.779 has the highest intrinsic H2O luminosity of our sample by a factor ~2. This implies that both should have very large H2O luminosities if the two components corresponded to two galaxies.
At the present angular resolution G15.v2.779 remains unresolved, in agreement with the compactness of the CO (Cox et al., in prep.) and the 880 μm continuum emissions (Bussmann et al. 2012).
3.2.7. SDP.17b at z = 2.305
The detection of the H2O emission line in SDP.17b was reported and discussed in Omont et al. (2011). Its H2O line profile is in perfect agreement with the CO emission profile – see Fig. 1 for the CO(4–3); also Harris et al. (2011) for the CO(1–0) and Iono et al. (2012) and Riechers et al. (in prep.). for the CO(3–2) profiles − including the asymmetry with the distinct blueshifted emission wing. The source is not resolved in the present data and higher angular resolution data indicate that the source remains compact and displays a velocity gradient (Cox et al., in prep.).
Again the μ value derived by B13, μ = 4.0 ± 0.6, is much lower than approximately expected from the CO linewidth and luminosity, which yields μCO = 18 ± 8 (Harris et al. 2012) – note that this latter value is uncertain because of the asymmetric CO line profile. However, the image separations are at the limit of what can be resolved by the SMA. Therefore, we have again doubled the uncertainty on the SMA value of μ and adopted the rms2-weighted average of the estimate from the SMA dust-continuum and the CO line, i.e. μ = 4.3 ± 1.2. However, the line of sight toward SDP.17b could include an intervening system, as indicated by a CO line at z = 0.942 reported by Lupu et al. (2012) based on Z-Spec data, in addition to the z = 2.3 line seen by the GBT (Harris et al. 2012) and the PdBI (Fig. 1). But this CO line at z = 0.942 was not confirmed by Omont et al. (2011) and more observations are needed to clarify this question. If there was such a dusty object at z = 0.942, the lens model derived from the SMA data of this very compact source would have to be revised.
4. Discussion
4.1. Lensing
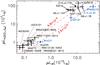 |
Fig. 3 Apparent H2O luminosity versus apparent infrared luminosity of high-redshift sources, for H2O Line 1 (211 − 202, 752.03 GHz) with the Arp 220 H2O line ratio (see text), compared to local ULIRGs (μLIR < 4 × 10¹² L⊙, Yang et al., in prep.). The dashed diagonal lines have constant LH2O/LIR ratios 6.8 × 10⁻⁶ and 2.6 × 10⁻⁶, equal to those of Arp 220 and Mrk 231. Because of their peculiarities, values for SDP.81 and G12.v2.30 (underestimated by factors possibly up to ~1.5−2 because they are very extended, see text), and those of APM 08279+5255 and Mrk 231 (type 1 and type 2 QSOs, respectively) are printed in blue. |
The main purpose of this paper is to investigate the importance of the H2O emission in high-z ULIRGs, but not to study its spatial structure by separating it from lensing images. This is the reason why the observations were carried out with the most compact configuration of PdBI to maximize the sensitivity for detection. Detailed lensing modeling is thus out of the scope of this paper. However, a good control of lensing effects is mandatory for various reasons: i) as seen above, the H2O emission could be resolved out in sources that are extended, even with the limited resolution of the observations reported in this paper. ii) Differential lensing effects must be controlled for comparison with emission from other H2O lines or other molecules or dust. As discussed, e.g., by Serjeant (2012), the importance of differential lensing is enhanced for the highest magnifications which take place close to caustics, and, especially, for blank fields, such as H-ATLAS where the deflectors are either single massive galaxies or small groups of galaxies. A striking example is the large difference observed in lensed images in the near-infrared compared to the submillimeter or CO emission of G12.v2.30 (Fu et al. 2012). iii) Lensing magnification must be corrected for deriving intrinsic properties of the sources such as luminosities or line ratios.
To infer intrinsic infrared and H2O luminosities of our sources, a first approximation is to derive a (mean) lensing magnification factor μ. We systematically preferred values of μ inferred from submillimeter imaging rather than near-infrared HST imaging, since H2O emission should be more related to submillimeter dust emission than to near-infrared stellar emission, and submillimeter and near-infrared lensing can be very different as examplified in the case of G12.v2.30 (Fu et al. 2012). As discussed in Sect. 3.2, the lensing magnification factor μ is thus determined from existing lensing models based on 880 μm SMA imaging results (B13; see also Bussmann et al. 2012). For two sources these values were slightly corrected by also using the values of μ derived following a method described in Harris et al. (2012), which uses the relation bewteen the CO linewidth and luminosity. As the low angular resolution and limited S/N of our H2O data do not allow us to trace possible differential effects of lensing, we adopted a minimum uncertainty of ±20% for all values of μ.
4.2. Relation between H2O and infrared luminosities
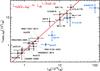 |
Fig. 4 Relation of the intrinsic H2O luminosity with the infrared luminosity for the seven ultra-luminous infrared galaxies reported in this paper, other well-known high-z sources taken from the literature, and local ULIRGs (LIR < 4 × 10¹² L⊙, Yang et al., in prep.). The luminosity is reported to the H2O (211 − 202, 752.03 GHz) emission line (referred to as “line 1” in this paper), where we adopted an Arp 220 H2O line ratio when another H2O line (“line 2”) was measured (see text). The solid line shows a best-fit power-law, |

The intrinsic H2O luminosities, based on the magnification factors listed in Table 2, are reported for each source in Table 5. The information on the H2O emission is limited by the observation of a single emission line per source. This prevents us from comparing the H2O excitations between different sources. It is nevertheless interesting to compare their H2O line luminosity and to check their dependency on other properties, such as the infrared intrinsic luminosity, LIR, since infrared excitation is thought to play a key role in the excitation of the H2O levels.
In addition, the H2O lines that were observed differ from source to source: three sources were measured in the H2O(211 − 202) emission line (“Line 1”) and four sources in the H2O(202 − 111) emission line (“Line 2”) To deal with this disparity, we approximated the integrated line flux, IH2O, of the emission line that was not observed, by adopting the value of the line ratio of “Line 2” to “Line 1” measured either in Arp 220, r21 = 3440 / 2970 = 1.16 (Rangwala et al. 2011) or in Mrk 231, r21 = 718 / 415 = 1.73 (González-Alfonso et al. 2010), listed as “a” and “m” in Table 5. The corresponding values of LH2O are reported in parenthesis in Table 5. Finally, the full set of values of the intrinsic luminosities LH2O − 1 / 2 for lines 1 and 2 and the line ratios of Arp 220 or Mrk 231 are reported in Table 5.
There are several arguments to favor the conversion factor of Arp 220 rather than Mrk 231: for all galaxies, except G12.v2.30, the CO excitation seems significantly lower than in Mrk 231 (Lupu et al. 2012); using the Mrk 231 conversion factor seems to yield anomalously low values for the line 1 luminosity of sources only observed in line 2 (Table 5).
Therefore, keeping all uncertainties in mind, the relationship between LH2O and LIR is displayed in Fig. 4 for LH2O − 1a (line 1 with Arp 220 line ratio). This relationship is inferred from all sources studied in this paper - with the exception of SDP.81 and G12.v2.30 whose H2O intensities are uncertain and probably underestimated by factors possibly up to ~1.5−2 because they are very extended – together with HLSJ0918 from Combes et al. (2012), and local ULIRGs (LIR < 4 × 10¹² L⊙) from Yang et al. (in prep.). A best-fit power-law to this relation following  (1)yields α = 1.15 ± 0.10 using “line 1” and the Arp 220 line ratio. Using the Mrk 231 line ratio would yield α = 1.11 ± 0.10, whereas using “line 2” would give α = 1.22 ± 0.10 and 1.28 ± 0.12 for the Arp 220 and Mrk 231 line ratios, respectively. Independent of the selected lines or ratios, these results indicate that LH2O increases rapidly with LIR, possibly faster than linear. We note, however, that since systematic errors were not taken into account in this analysis, adding the statistical and systematic errors could result in a relation that is closer to being linear. A steep increase is consistent with a significant role of infrared radiation in the excitation of the water vapor lines. It is interesting to note that a similar behavior with the infrared luminosity has been found for the intensity of local H2O and OH megamasers, which could be interpreted as a result of the importance of infrared pumping on these masers (e.g. Lo 2005).
However, it is important to stress that, as shown e.g. by the modeling of H2O excitation in Mrk 231 by González-Alfonso et al., the intensity of (optically thick) H2O lines results from a complex interplay between various parameters that includes gas temperature and density, H2O abundance, infrared radiation field, spatial distribution of H2O and dust, etc. The present data, with only one H2O emission line per source, prevents us for constraining the water excitation. Multi-line H2O observations are required for a detailed modeling of the excitation. Therefore, we defer the study of the water excitation in these high-z sources to a future paper, which will report measurements of multiple water transitions.
The high-J HCN lines seem to display a similar behavior with the infrared luminosity, with LHCN growing possibly faster than linear with LIR. For instance, Bussmann et al. (2008) reported that LHCN(3 − 2) varies as  in a sample of 30 nearby galaxies, although correcting for the difference in emission extension seems compatible with a linear relation (Gao et al., in prep.). The strong HCN(5 − 4) emission observed by Weiss et al. (2005) in APM 08279+5255 seems to require infrared excitation. The high HCN 6−5/5−4 ratio observed by Riechers et al. (2010) ultimately confirmed that infrared excitation is important for the HCN excitation in this source. Note that this is not true for HCN(1 − 0), which gives a strictly linear relation, with an index of 1.0, consistent with the interpretation that HCN(1 − 0) is proportional to the mass of dense gas (Solomon et al. 1992; Gao & Solomon 2004). However, because the H2O and high-J HCN line intensities may be increasing faster than linear with LIR may indicate the importance of IR excitation. This needs to be confirmed by better statistics and by future observations of higher transitions.
4.3. Comparison of H2O lines with high-J CO lines and the continuum
In all cases where the information is available on adjacent CO lines − CO(6−5) or (7−6) for H2O(211–202) (line 1), and CO(8−7) or (9−8) for H2O(202–111) (line 2) − the line flux IH2O − 1 / 2 is at least ~0.3–0.5 that of the neighboring high-J CO lines. The lack of detailed data on high-J CO emission for most of the sources limits any detailed comparative study.
The three SDP sources and G12.v2.30 benefit from a complete spectral coverage from 200 to 300 GHz with ZSpec (Lupu et al. 2012, and in prep.). This range includes 2 to 5 high-J CO lines, depending on the redshift. Even though the sensitivity and the spectral resolution of ZSpec are limited, these data allow us to derive useful trends on the strength of CO as the approximate spectral line energy distributions (SLEDs) derived by Lupu et al. (2012).
In SDP.17b, the ratio I(H2O(202 − 111))/I(CO(8 − 7)) is about 0.5 (Omont et al. 2011). For SDP.9, information is lacking on CO emission from levels J > 6 because of the low redshift (z = 1.57) of the source. However, the CO(6–5) emission line is strong with a ratio I(H2O(211 − 202))/I(CO(6 − 5)) ~ 0.36. In the case of SDP.81, the H2O and CO emission lines are both weak. Accounting for the part of the H2O emission that is not detected in the intrinsically weaker western arc (see Sect. 3.2.1), we estimate that the ratio I(H2O(202 − 111))/I(CO(7 − 6)) is ≈0.3 – note that the CO J > 7 lines are not detected in the ZSpec data reported by Lupu et al. (2012). The ZSpec spectrum of G12.v2.30 displays strong lines of H2O(321 − 312) and CO(10–9), with about similar intensities (Lupu et al. in prep.), but their ratio may be uncertain by a factor up to two because of the noise in this frequency range of ZSpec.
The best-documented comparison of H2O and CO lines is found for G15.v2.779 because of its high redshift (z = 4.24) and the sensitive PdBI CO observations of Cox et al. (2011). For G15.v2.779, the ratio I(H2O(211 − 202))/I(CO(7 − 6) = 0.52. For the two other sources, NA.v1.144 and NB.v1.78, the lack of information on the high-J CO levels prevents any comparison with the H2O emission lines.
Moreover, the intensities of H2O lines (IH2O – Table 4) and of the lower-J CO 2 mm and 3 mm lines (Table 3 and Fig. 1) are roughly comparable. Another direct comparison is the relation between the intensity of the H2O emission line (hence the H2O luminosity) with the underlying continuum emission (hence the infrared luminosity) − see Table 4 and Figs. 3 and 4. But the comparison between IH2O and the continuum flux density Sν significantly depends on the redshift and the rest frequency. Finally, as shown by Fig. 1 and Table 4, the H2O and continuum flux densities, e.g. SνH2Opk and Sνpk, are roughly comparable, although their ratio obviously depends on the linewidth.
4.4. Implication of ubiquitous detection of H2O in high-z ultra-luminous infrared galaxies
As in the case of SDP.17b (Omont et al. 2011), the strength of the H2O 202–111 and 211–202 emission lines in six new high-z ultra-luminous galaxies implies that water vapor has a high abundance in these sources − probably n(H2O)/n(H2) ≳ 10-6 as in Mrk 231 (González-Alfonso et al. 2010), although this has to be confirmed by detailed modeling – and that its rotation level ladder is excited up to energies of at least ~100 K. This is consistent with the recent results obtained on local ULIRGs such as Arp 220 and Mrk 231 (Rangwala et al. 2011; van der Werf et al. 2010, and in prep.; Yang et al., in prep.).
Our results seem to indicate that high-z ultra-luminous galaxies are analogs of their local counterparts scaled by factors up to an order of magnitude in infrared luminosity and star formation rate. The similitude in excitation of high-energy H2O levels, observed in local ULIRGs or in APM 08279+5255 (van der Werf et al. 2011), still needs to be confirmed in high-z sources by future observations of the higher frequency H2O lines connected to these levels. Nevertheless, the results reported here already indicate many similarities, such as the possibly slightly faster-than-linear increase of the intrinsic H2O luminosity, LH2O, with the infrared luminosity LIR; the corresponding fact that the ratio LH2O/LIR in high-z sources is slightly higher than in local ULIRGs (Fig. 3); and the high intensity ratio of H2O lines to nearby high-J CO lines, in between 0.3 to 0.5, as observed in local ULIRGs. It is therefore likely that the infrared radiation plays a significant role in the H2O excitation, as demonstrated in the case of Mrk 231 by the detailed modeling of its spectrum by Gonzalez-Alfonso et al. (2010).
The ubiquity of H2O emission lines in the submillimeter spectra of luminous high-z starburst galaxies underlines the importance of water vapor in probing their warm, dense, and dusty interstellar cores and, in addition, their strong local infrared radiation fields. Indeed, the H2O lines constitute a totally different diagnostic from, e.g., CO or low-J HCN emission lines, that are excited by collisions and hence trace only temperature and density. Because of the large electric dipole of H2O and its large rotational constant, the critical density for collisional excitation of its excited levels is extremely high, typically 108 cm-3, much higher than expected densities in our sources. The relatively easy detection of H2O emission lines in the sample of high-z starburst galaxies studied in this paper is therefore indicative of the presence of dusty, infrared-opaque nuclear disks in their centers as in local ULIRGs and of a significant role of infrared excitation of H2O (e.g. González-Alfonso et al. 2010).
The role of a strong active galactic nucleus (AGN) in the excitation of H2O of local ULIRGs is not yet entirely clear (van der Werf et al. 2010). There is no definite evidence of the presence of a strong AGN in any of the seven sources discussed in this paper, neither from their optical/near-infrared spectra nor from their X-ray emission. There is also no indication of a high radio or mid-infrared excess that could have been detected in the FIRST radio survey (Becker et al. 1995) or the Wide-field Infrared Survey Explorer (WISE; Wright et al. 2010) − see Omont et al. (2011) for a detailed discussion of the radio emission of SDP.17b. However, in the case of SDP.81, the radio spectral index suggests that a fraction of the radio emission is powered by an AGN (Valtchanov et al. 2011).
We stress again that most of our sources are much more powerful than local ULIRGs and that they probe a regime of infrared luminosities up to a few 1013 L⊙, i.e., an order of magnitude higher than local ULIRGs. It is probable that the local radiation field is also stronger, and that it might reach the limit of stability of such cores against radiation pressure, possibly close to the limit of maximum starbursts. As starbursts with intrinsic far-infrared luminosities much higher than a few 1013 L⊙ do not appear to exist (see e.g. Karim et al. 2013), it seems that some of the objects that we are studying, such as G15.v2.779, might be close to this critical regime.
All sources studied in this paper are highly magnified by gravitational lensing. This makes the detection of lines such as H2O much easier, especially for the highest lensing magnification factors, i.e., the lowest intrinsic luminosities. However, for the strongest luminosities, a few 1013 L⊙, lensing magnification factors go down to a few units; e.g. μ ~ 4 for G15.v2.779. Therefore, for similarly luminous sources, H2O lines should be easily detectable even in the absence of lensing magnification. For instance, a source identical to G15.v2.779 (LIR ~ 2 × 10¹³ L⊙ at z > 4) would have IH2O ~ 1 Jy km s-1 without any magnification, which is well within the reach of the PdBI in its current configuration.
5. Conclusion
This paper reports a significant step forward in the study of water vapor emission in the warm and dense cores of ultra-luminous starburst galaxies at high redshift. The seven sources studied here are strongly lensed galaxies discovered in the Herschel H-ATLAS survey and, using the PdBI, all were detected in H2O either in the (202–111) or the (211–202) rotational line. One of the sources (SDP.17b) was previously reported in Omont et al. (2011). In all cases, the H2O emission lines are strong, with integrated line fluxes ranging from 1.8 to 14 Jy km s-1, comparable both in strength and in the characteristics of their profiles to the CO emission lines. The derived apparent infrared luminosities, μ LH2O, range from ~3 to 12 × 108 L⊙. When correcting for the magnification factors μ, which are estimated from lensing models based on submillimeter imaging and corroborated by the empirical relationship between CO luminosity and linewidth, the derived H2O luminosities show a strong dependence on the infrared luminosity. It is found that LH2O varies as ~ , the exact shape of the relation remaining uncertain mainly due to the uncertainties in the derivation of μ. This slightly non-linear relation may indicate that infrared pumping plays a role in the excitation of H2O lines. Water emission is therefore expected to become very strong in the most ultra-luminous (LIR > 1013 L⊙) galaxies at high redshift.
The results described in this paper underline the fact that the most powerful high-z infrared galaxies are analogs of local ULIRGs scaled by factors up to 10 in infrared luminosity and star formation rate. The fact that the excitation of H2O levels with Eup ~ 100 − 150 K in high-redshift luminous galaxies appears to be similar to what is seen in local ULIRGs is supported by the present results, including the rapid increase of LH2O with LIR, the slightly higher ratio LH2O/LIR in high-z sources than in local ULIRGs, or the high intensity ratio of H2O lines to nearby CO lines. However, future observations of the higher frequency H2O lines connected to upper levels in high-z galaxies are needed to compare the excitation of the high-energy H2O levels with Eup > 150 − 200 K to that of local ULIRGs.
The detection of H2O emission lines in seven high-redshift luminous galaxies reported in this paper demonstrates that the millimeter/submillimeter lines of water vapor are a new and key diagnostic tool to probe both the extreme physical conditions and the infrared radiation in the warm dense environments of luminous high-z starburst galaxies. Follow-up observations of such sources, taking advantage of the increased sensitivities that are and will become available with ALMA and the upgraded PdBI (NOEMA) facilities, will allow more comprehensive studies of water vapor in high-z luminous galaxies, including unlensed candidates, providing essential and new insights into the physical conditions of these galaxies, which were present when the universe was young and have no equivalent in the local universe.
Acknowledgments
Based on observations carried out with the IRAM Plateau de Bure interferometer. IRAM is supported by INSU/CNRS (France), MPG (Germany) and IGN (Spain). The authors are grateful to the IRAM staff for their support. US participants in H-ATLAS acknowledge support from NASA through a contract from JPL. Italian participants in H-ATLAS acknowledge a financial contribution from the agreement ASI-INAF I/009/10/0. SPIRE has been developed by a consortium of institutes led by Cardiff Univ. (UK) and including: Univ. Lethbridge (Canada); NAOC (China); CEA, LAM (France); IFSI, Univ. Padua (Italy); IAC (Spain); Stockholm Observatory (Sweden); Imperial College London, RAL, UCL-MSSL, UKATC, Univ. Sussex (UK); and Caltech, JPL, NHSC, Univ. Colorado (USA). This development has been supported by national funding agencies: CSA (Canada); NAOC (China); CEA, CNES, CNRS (France); ASI (Italy); MCINN (Spain); SNSB (Sweden); STFC, UKSA (UK); and NASA (USA). M. J. Michałowski acknowledges the support of a FWO-Pegasus Marie Curie Fellowship.
References
- Barvainis, R., & Antonucci, R. 2005, ApJ, 628, L89 [NASA ADS] [CrossRef] [Google Scholar]
- Barvainis, R., Tacconi, L., Antonucci, R., et al. 1994, Nature, 371, 586 [NASA ADS] [CrossRef] [Google Scholar]
- Becker, R. H., White, R. L., & Helfand, D. J. 1995, ApJ, 450, 559 [NASA ADS] [CrossRef] [Google Scholar]
- Bothwell, M. S., Smail, I., Chapman, S. C., et al. 2013, MNRAS, 429, 3047 [NASA ADS] [CrossRef] [Google Scholar]
- Bradford, C. M., Aguirre, J. E., Aikin, R., et al. 2009, ApJ, 705, 112 [NASA ADS] [CrossRef] [Google Scholar]
- Bradford, C. M., Bolatto, A. D., Maloney, P. R., et al. 2011, ApJ, 741, L37 [NASA ADS] [CrossRef] [Google Scholar]
- Bussmannn, R. S., Narayanan, D., Shirley, Y. L., et al. 2008, ApJ, 681, L73 [NASA ADS] [CrossRef] [Google Scholar]
- Bussmannn, R. S., Gurwell, M. A., Fu, H., et al. 2012, ApJ, 756, 134 [NASA ADS] [CrossRef] [Google Scholar]
- Casoli, F., Gerin, M., Encrenaz, P. J., & Combes, F. 1994, A&A, 287, 716 [NASA ADS] [Google Scholar]
- Combes, F., Rex, M., Rawle, T. D., et al. 2012, A&A, 538, L4 [NASA ADS] [CrossRef] [EDP Sciences] [Google Scholar]
- Cox, P., Krips, M., Neri, R., et al. 2011, ApJ, 740, 63 [NASA ADS] [CrossRef] [Google Scholar]
- Downes, D., Neri, R., Wiklind, T., et al. 1999, ApJ, 513, L1 [NASA ADS] [CrossRef] [Google Scholar]
- Eales, S., Dunne, L., Clements, D., et al. 2010, PASP, 122, 499 [NASA ADS] [CrossRef] [Google Scholar]
- Egami, E., Rex, M., Rawle, T. D., et al. 2010, A&A, 518, L12 [CrossRef] [EDP Sciences] [Google Scholar]
- Fiolet, N., Omont, A., Polletta, M., et al. 2009, A&A, 508, 117 [NASA ADS] [CrossRef] [EDP Sciences] [Google Scholar]
- Fu, H., Jullo, E., Cooray, A., et al. 2012, ApJ, 753, 134 [NASA ADS] [CrossRef] [Google Scholar]
- Gao, Y., & Solomon, P. M. 2004, ApJ, 606, 271 [NASA ADS] [CrossRef] [Google Scholar]
- González-Alfonso, E., Fischer, J., Isaak, K., et al. 2010, A&A, 518, L43 [NASA ADS] [CrossRef] [EDP Sciences] [Google Scholar]
- González-Alfonso, E., Fischer, J., Graciá-Carpio, J., et al. 2012, A&A, 541, A4 [NASA ADS] [CrossRef] [EDP Sciences] [Google Scholar]
- Griffin, M. J., Abergel, A., Abreu, A., et al. 2010, A&A, 518, L3 [Google Scholar]
- Harris, A. I., Baker, A. J., Frayer, D. T., et al. 2012, ApJ, 752, 152 [NASA ADS] [CrossRef] [Google Scholar]
- Impellizzeri, C. M. V., McKean, J. P., Castangia, P., et al. 2008, Nature, 456, 927 [NASA ADS] [CrossRef] [PubMed] [Google Scholar]
- Iono, D., Hatsukade, B., Kohno, K., et al. 2012, PASJ, 64, L2 [NASA ADS] [Google Scholar]
- Ivison, R. J., Magnelli, B., Ibar, E., et al. 2010, A&A, 518, L31 [NASA ADS] [CrossRef] [EDP Sciences] [Google Scholar]
- Karim, A., Swinbank, M., Hodge, J., et al. 2013, MNRAS, accepted [arXiv:1210.0249] [Google Scholar]
- Lis, D. C., Neufeld, D. A., Phillips, T. G., Gerin, M., & Neri, R. 2011, ApJ, 738, L6 [NASA ADS] [CrossRef] [Google Scholar]
- Lo, K. 2005, ARA&A, 43, 625 [NASA ADS] [CrossRef] [Google Scholar]
- Lupu, R. E., Scott, K. S., Aguirre, J. E., et al. 2012, ApJ, 757, 135 [NASA ADS] [CrossRef] [Google Scholar]
- McKean, J. P., Impellizzeri, C. M. V., et al. 2011, MNRAS, 410, 2506 [NASA ADS] [CrossRef] [Google Scholar]
- Negrello, M., Hopwood, R., De Zotti, G., et al. 2010, Science, 330, 800 [NASA ADS] [CrossRef] [Google Scholar]
- Oliver, S. J., Wang, L., Smith, A. J., et al. 2010, A&A, 518, L21 [NASA ADS] [CrossRef] [EDP Sciences] [Google Scholar]
- Omont, A., Neri, R., Cox, P., et al. 2011, A&A, 530, L3 [NASA ADS] [CrossRef] [EDP Sciences] [Google Scholar]
- Pilbratt, G. L., Riedinger, J. R., Passvogel, T., et al. 2010, A&A, 518, L1 [CrossRef] [EDP Sciences] [Google Scholar]
- Poglitsch, A., Waelkens, C., Geis, N., et al. 2010, A&A, 518, L2 [NASA ADS] [CrossRef] [EDP Sciences] [Google Scholar]
- Rangwala, N., Maloney, P. R., Glenn, J., et al. 2011, ApJ, 743, 94 [NASA ADS] [CrossRef] [Google Scholar]
- Riechers, D. A., Weiss, A., Walter, F., Carilli, C. L., & Knudsen, K. K. 2006, ApJ, 649, 635 [NASA ADS] [CrossRef] [Google Scholar]
- Riechers, D. A., Walter, F., Carilli, C. L., & Lewis, G. F. 2009, ApJ, 690, 463 [NASA ADS] [CrossRef] [Google Scholar]
- Riechers, D. A., Weiß, A., Walter, F., & Wagg, J. 2010, ApJ, 725, 1032 [NASA ADS] [CrossRef] [Google Scholar]
- Riechers, D. A., Weiß, A., Walter, F., & Wagg, J. 2013, Nature, submitted [Google Scholar]
- Sana, A., Yan, L., Lutz, D., et al. 2008, ApJ, 683, 659 [NASA ADS] [CrossRef] [Google Scholar]
- Serjeant, S. 2012, MNRAS, 424, 2429 [NASA ADS] [CrossRef] [Google Scholar]
- Solomon, P. M., Downes, D., & Radford, S., 1992, ApJ, 398, L29 [NASA ADS] [CrossRef] [Google Scholar]
- Spergel, D. N., Verde, L., Peiris, H. V., et al. 2003, ApJS, 148, 175 [NASA ADS] [CrossRef] [Google Scholar]
- Swinbank, M., Smail, I., Longmore, S., et al. 2010, Nature, 464, 733 [Google Scholar]
- Valtchanov, I., Virdee, J., Ivison, R. J., et al. 2011, MNRAS, 415, 3473 [NASA ADS] [CrossRef] [Google Scholar]
- van der Werf, P. P., Isaak, K. G., Meijerink, R., et al. 2010, A&A 518, L42 [Google Scholar]
- van der Werf, P. P., Berciano Alba, A., Spaans, M., et al. 2011, ApJ, 741, L38 [NASA ADS] [CrossRef] [Google Scholar]
- Vieira, J. D., Crawford, T. M., Switzer, E. R., et al. 2010, ApJ, 719, 763 [NASA ADS] [CrossRef] [Google Scholar]
- Wagg, J., Wilner, D. J., Neri, R., Downes, D., & Wiklind, T. 2006, ApJ, 651, 46 [NASA ADS] [CrossRef] [Google Scholar]
- Weiß, A., Walter, F., & Scoville, N. Z., et al. 2005, A&A, 438, 533 [NASA ADS] [CrossRef] [EDP Sciences] [Google Scholar]
- Weiß, A., Downes, D., Neri, R., et al. 2007, A&A, 467, 955 [NASA ADS] [CrossRef] [EDP Sciences] [Google Scholar]
- Wright, E. L., Eisenhardt, P. R. M., Mainzer, A. K., et al. 2010, AJ, 140, 1868 [NASA ADS] [CrossRef] [Google Scholar]
All Tables
All Figures
|
Fig. 1 Spectra of the H2O and CO emission lines observed at PdBI toward the seven lensed high-redshift ultra-luminous galaxies discussed in this paper. The H2O emission lines are displayed in the left column (showing the (211 − 202) or the (202 − 111) transition; the transitions are identified in each box). The CO spectra are displayed in the right column (showing 3–2, 4–3, 5–4 and 7–6 rotational transitions – for G15.v2.779, the [CI] emission line is included in the band). The transitions are indentified in each box. All spectra include the continuum, and the H2O frequencies corresponding to the zero velocity are given in Table 4. The red lines trace the Gaussian fits to the H2O and CO line profiles and the fit to the continuum emission level. In all cases, the match between the H2O and CO spectra is excellent both in redshift and in the details of the line profile – see text. |
| In the text | |
|
Fig. 2 Images of the submillimeter continuum (left panel) and H2O line emission (right panel – see Fig. 1 and Table 4 for the identification of the transitions) for the seven high-z lensed ultra-luminous galaxies studied in this paper (sources are identified in the left panels). Synthesized beams are shown in the lower left corner of each map. The map centers correspond to the coordinates given in Table 1 and are indicated by a cross. For the continuum maps, the contours start from 3σ in steps of 3σ for SDP.81 and G12.v2.30, and in steps of 6σ for the other sources; for the H2O line emission maps, the contours start from 3σ in steps of 1σ (for SDP.81) and 2σ for the other sources. For each source, the 1σ continuum (mJy/beam) and emission line (Jy km s-1/beam) noise levels are as follows: SDP.81 (0.60/0.18), NA.v1.144 (0.35/0.31), SDP.9 (0.50/0.59), NB.v1.78 (0.28/0.30), G12.v2.30 (0.28/0.28), G15.v2.779 (0.11/0.24), and SDP.17b (0.73/0.56). Four sources remain unresolved at the current angular resolution, whereas SDP.81, NB.v1.78, and G12.v2.30 display complex lensing morphologies both in the continuum and line emission that are revealed even at the present low angular resolution. Detailed comments on the sources are given in the text (Sect. 3). |
| In the text | |
|
Fig. 3 Apparent H2O luminosity versus apparent infrared luminosity of high-redshift sources, for H2O Line 1 (211 − 202, 752.03 GHz) with the Arp 220 H2O line ratio (see text), compared to local ULIRGs (μLIR < 4 × 10¹² L⊙, Yang et al., in prep.). The dashed diagonal lines have constant LH2O/LIR ratios 6.8 × 10⁻⁶ and 2.6 × 10⁻⁶, equal to those of Arp 220 and Mrk 231. Because of their peculiarities, values for SDP.81 and G12.v2.30 (underestimated by factors possibly up to ~1.5−2 because they are very extended, see text), and those of APM 08279+5255 and Mrk 231 (type 1 and type 2 QSOs, respectively) are printed in blue. |
| In the text | |
|
Fig. 4 Relation of the intrinsic H2O luminosity with the infrared luminosity for the seven ultra-luminous infrared galaxies reported in this paper, other well-known high-z sources taken from the literature, and local ULIRGs (LIR < 4 × 10¹² L⊙, Yang et al., in prep.). The luminosity is reported to the H2O (211 − 202, 752.03 GHz) emission line (referred to as “line 1” in this paper), where we adopted an Arp 220 H2O line ratio when another H2O line (“line 2”) was measured (see text). The solid line shows a best-fit power-law, |
| In the text | |
Current usage metrics show cumulative count of Article Views (full-text article views including HTML views, PDF and ePub downloads, according to the available data) and Abstracts Views on Vision4Press platform.
Data correspond to usage on the plateform after 2015. The current usage metrics is available 48-96 hours after online publication and is updated daily on week days.
Initial download of the metrics may take a while.