Fig. 1
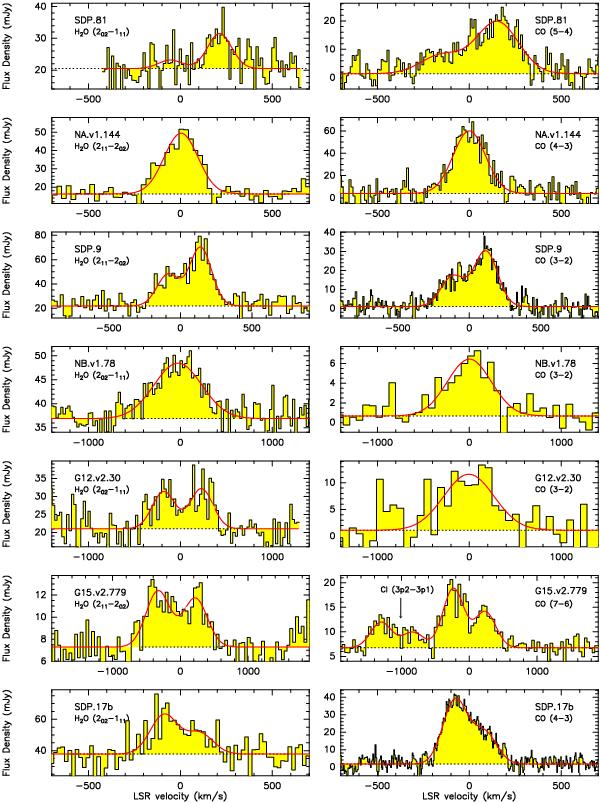
Spectra of the H2O and CO emission lines observed at PdBI toward the seven lensed high-redshift ultra-luminous galaxies discussed in this paper. The H2O emission lines are displayed in the left column (showing the (211 − 202) or the (202 − 111) transition; the transitions are identified in each box). The CO spectra are displayed in the right column (showing 3–2, 4–3, 5–4 and 7–6 rotational transitions – for G15.v2.779, the [CI] emission line is included in the band). The transitions are indentified in each box. All spectra include the continuum, and the H2O frequencies corresponding to the zero velocity are given in Table 4. The red lines trace the Gaussian fits to the H2O and CO line profiles and the fit to the continuum emission level. In all cases, the match between the H2O and CO spectra is excellent both in redshift and in the details of the line profile – see text.
Current usage metrics show cumulative count of Article Views (full-text article views including HTML views, PDF and ePub downloads, according to the available data) and Abstracts Views on Vision4Press platform.
Data correspond to usage on the plateform after 2015. The current usage metrics is available 48-96 hours after online publication and is updated daily on week days.
Initial download of the metrics may take a while.