Fig. 2
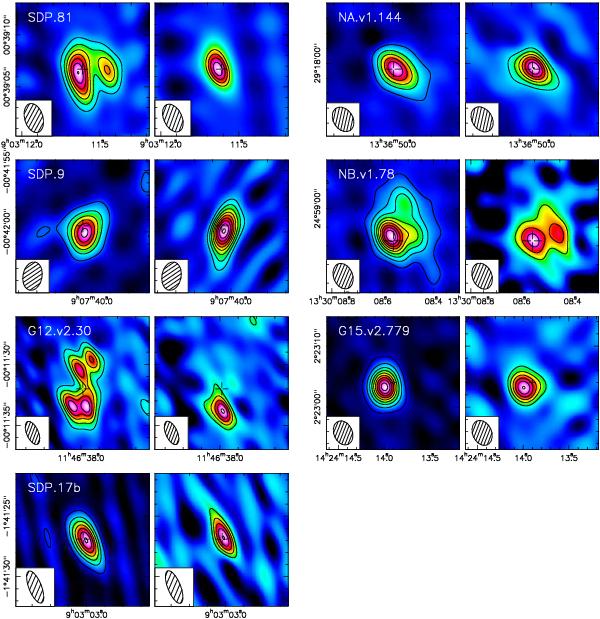
Images of the submillimeter continuum (left panel) and H2O line emission (right panel – see Fig. 1 and Table 4 for the identification of the transitions) for the seven high-z lensed ultra-luminous galaxies studied in this paper (sources are identified in the left panels). Synthesized beams are shown in the lower left corner of each map. The map centers correspond to the coordinates given in Table 1 and are indicated by a cross. For the continuum maps, the contours start from 3σ in steps of 3σ for SDP.81 and G12.v2.30, and in steps of 6σ for the other sources; for the H2O line emission maps, the contours start from 3σ in steps of 1σ (for SDP.81) and 2σ for the other sources. For each source, the 1σ continuum (mJy/beam) and emission line (Jy km s-1/beam) noise levels are as follows: SDP.81 (0.60/0.18), NA.v1.144 (0.35/0.31), SDP.9 (0.50/0.59), NB.v1.78 (0.28/0.30), G12.v2.30 (0.28/0.28), G15.v2.779 (0.11/0.24), and SDP.17b (0.73/0.56). Four sources remain unresolved at the current angular resolution, whereas SDP.81, NB.v1.78, and G12.v2.30 display complex lensing morphologies both in the continuum and line emission that are revealed even at the present low angular resolution. Detailed comments on the sources are given in the text (Sect. 3).
Current usage metrics show cumulative count of Article Views (full-text article views including HTML views, PDF and ePub downloads, according to the available data) and Abstracts Views on Vision4Press platform.
Data correspond to usage on the plateform after 2015. The current usage metrics is available 48-96 hours after online publication and is updated daily on week days.
Initial download of the metrics may take a while.