Fig. 4
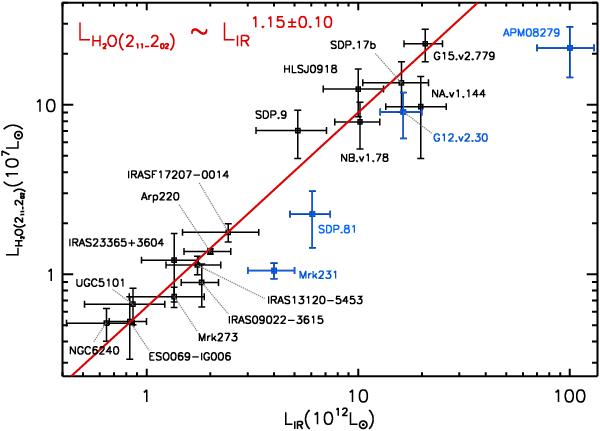
Relation of the intrinsic H2O luminosity with the infrared luminosity for the seven ultra-luminous infrared galaxies reported in this paper, other well-known high-z sources taken from the literature, and local ULIRGs (LIR < 4 × 10¹² L⊙, Yang et al., in prep.). The luminosity is reported to the H2O (211 − 202, 752.03 GHz) emission line (referred to as “line 1” in this paper), where we adopted an Arp 220 H2O line ratio when another H2O line (“line 2”) was measured (see text). The solid line shows a best-fit power-law,  , where α = 1.15 ± 0.10. Error bars are defined in the following way: i) for LIR, they combine the uncertainties on the values of μ LIR and the uncertainties on μ given in Table 2; ii) for LH2O, they include the errors on IH2O of Table 4, and the same uncertainties on μ except that when the latter is <20% it is replaced by 20% (see Sect. 4.1). Because of their peculiarities, values (in blue) for SDP.81 and G12.v2.30 (both underestimated by factors possibly up to ~1.5−2 because they are very extended, see text), and those of APM 08279+5255 and Mrk 231 (type 1 and type 2 QSOs, respectively) are not taken into account for the fit.
Current usage metrics show cumulative count of Article Views (full-text article views including HTML views, PDF and ePub downloads, according to the available data) and Abstracts Views on Vision4Press platform.
Data correspond to usage on the plateform after 2015. The current usage metrics is available 48-96 hours after online publication and is updated daily on week days.
Initial download of the metrics may take a while.