| Issue |
A&A
Volume 551, March 2013
|
|
|---|---|---|
| Article Number | A45 | |
| Number of page(s) | 11 | |
| Section | Cosmology (including clusters of galaxies) | |
| DOI | https://doi.org/10.1051/0004-6361/201220637 | |
| Published online | 19 February 2013 | |
Chandra and optical/IR observations of CXO J1415.2+3610, a massive, newly discovered galaxy cluster at z ~ 1.5
1
INAF-Osservatorio Astronomico di Trieste, via Tiepolo 11,
34133
Trieste,
Italy
2
INFN-National Institute for Nuclear Physics,
via Valerio 2,
34127
Trieste,
Italy
e-mail:
This email address is being protected from spambots. You need JavaScript enabled to view it.
3
European Space Astronomy Centre (ESAC)/ESA,
Madrid,
Spain
4
European Southern Observatory, Karl-Schwarzschild Strasse 2, 85748
Garching,
Germany
5
Università di Trieste, Dipartimento di Fisica,
via Valerio, 2, 34127
Trieste,
Italy
6
University Observatory, Ludwig-Maximillians University Munich,
Scheinerstrasse 1,
81679
Munich,
Germany
7
Excellence Cluster Universe, Boltzmannstrasse 2, 85748
Garching,
Germany
Received:
26
October
2012
Accepted:
12
December
2012
Abstract
Aims. We report the discovery of CXO J1415.2+3610, a distant (z ~ 1.5) galaxy cluster serendipitously detected as an extended source with a very high significance level (S/N ~ 11) in a deep, high-resolution Chandra observation targeted to study the cluster WARP J1415.1+3612 at z = 1.03. This is the highest-z cluster discovered with Chandra so far. Moreover, the total exposure time of 280 ks with ACIS-S provides the deepest X-ray observation currently achieved on a cluster at z ≥ 1.5.
Methods. We perform an X-ray spectral fit of the extended emission of the intracluster medium (ICM) with Xspec assuming a single-temperature thermal mekal model. We use optical and infrared (IR) observations from Subaru-Suprime (BVRiz), Moircs (JKs), and Spitzer-IRAC (3.6 μm) to confirm the presence of an overdensity of red galaxies matching the X-ray extended emission. We use optical and IR data to investigate the color−magnitude relation of the candidate member galaxies.
Results. From a preliminary X-ray spectral analysis, we detect at a 99.5% confidence level the rest frame 6.7−6.9 keV Iron Kα line complex, from which we obtain zX = 1.46 ± 0.025. Our X-ray redshift measurement is supported by the optical and IR data. The analysis of the z − 3.6 μm color−magnitude diagram shows a well-defined sequence of red galaxies within 1′ from the cluster X-ray emission peak with a color range [5 < z − 3.6 μm < 6]. The photometric redshift obtained by spectral energy distribution fitting is zphot = 1.52 ± 0.06. After fixing the redshift to z = 1.46, we perform the final spectral analysis and measure the average gas temperature with a 20% error, kT = 5.8-1.0+1.2 keV, and the Fe abundance ZFe = 1.3-0.5+0.8 Z⊙. We fit the background-subtracted surface brightness with a single beta-model out to 35 arcsec (the maximum radius where the X-ray emission is detected), and derive the deprojected electron density profile. The ICM mass is 1.09-0.2+0.3 × 10¹³ M⊙ within 300 kpc. Under the assumption of hydrostatic equilibrium, the total mass is M2500 = 8.6-1.7+2.1 × 10¹³ M⊙ for R2500 = (220 ± 55) kpc. Extrapolating the profile at larger radii, we find M500 = 2.1-0.5+0.7 × 10¹⁴ M⊙ for R500 = 510-50+55 kpc. This analysis establishes CXOJ1415.2+3610 as one of the best characterized distant galaxy clusters based on X-ray data alone.
Key words: galaxies: clusters: individual: CXO J1415.2+3610 / galaxies: clusters: intracluster medium / X-rays: galaxies: clusters
© ESO, 2013
1. Introduction
Clusters of galaxies are both important probes to measure the growth of cosmic structures of the Universe and excellent astrophysical laboratories (see Kravtsov & Borgani 2012, and references therein). Their measured number density and evolution strongly depend on the cosmological parameters, particularly at the high mass end (see Allen et al. 2011). Their number density evolution on a time scale of ~9 Gyr, corresponding to the highest redshift where virialized clusters are currently found (z ≥ 1.3), ranges between one and more than three orders of magnitudes for masses M > 5 × 10¹⁴ h-1 M⊙, depending on the cosmological parameters (see Rosati et al. 2002). Therefore, the density of massive clusters at high redshift allows one to trace the growth rate of perturbations, thus providing a robust constraint for cosmological models. Other cosmological tests with galaxy clusters are provided by the power spectrum of galaxy clusters (Balaguera-Antolínez et al. 2011) and the baryonic fraction (Allen et al. 2002; Ettori et al. 2003, 2009). The latter is a geometrical test that relies on the assumption of the constancy of the baryonic fraction as a function of the cosmic epoch and therefore does not depend on the density evolution of galaxy clusters.
There is now a general convergence towards the standard Λ cold dark matter model (ΛCDM), which is based on observables related to the cosmic microwave background (CMB, Komatsu et al. 2011), the correlation properties and the growth rate of the large-scale structure of the Universe (Reid et al. 2012), and the supernova (SNae) surveys (for recent developments see Suzuki et al. 2012). Although CMB and SNae experiments that directly probe the geometry of the Universe have gained large visibility, significant efforts are still being devoted to cosmological tests with galaxy clusters thanks to the high complementarity with the other tests (Mantz et al. 2010). Recently, the emphasis has shifted towards the search of deviations from the reference ΛCDM model, like tests of general relativity (Schmidt et al. 2009; Rapetti et al. 2012), coupled dark energy models (Amendola et al. 2012), or non-Gaussianity in the primordial density perturbation field (e.g., Sartoris et al. 2010; Sawangwit et al. 2012). Potentially, the mere presence of few massive, high-z galaxy clusters such as those recently discovered (e.g., Jee et al. 2009; Foley et al. 2011; Santos et al. 2011) could create some tension with the standard ΛCDM and quintessence models (e.g., Jimenez & Verde 2009; Baldi & Pettorino 2011; Chongchitnan & Silk 2012; Mortonson et al. 2011; Hoyle et al. 2011; Harrison & Coles 2012; Waizmann et al. 2012). So far, no evidence for such a discrepancy has been found, except when considering the combined probability of the most massive, high-z clusters (Jee et al. 2011).
X-ray selected clusters play a key role in this context. Thanks to the X-ray thermal emission from the intracluster medium (ICM), which is the largest baryonic component of galaxy clusters, it is possible to measure the cluster mass with good accuracy up to high-z. Unfortunately, X-ray studies of distant galaxy clusters are limited not only by relatively small samples, but also by low fluxes and surface brightness, which hamper a meaningful X-ray spectral analysis in most cases. This can be achieved only with very deep exposures, possibly with the high imaging quality that only Chandra can reach. An independent strategy is to find clusters and estimate their masses through the Sunyaev-Zeldovich (SZ) effect. Surveys carried out with the Atacama Cosmology Telescope (Sehgal et al. 2011) and the South Pole Telescope (Reichardt et al. 2013) are delivering the first remarkable results. However, the calibration of mass proxies for SZ-selected clusters still relies on a cross-calibration with X-ray data (Andersson et al. 2011; Planck Collaboration 2013). Before SZ mass measurements are robustly calibrated, the two major existing X-ray facilities, XMM-Newton and Chandra, still offer the best way to find and characterize distant massive clusters.
Significant progress in this field can be pursued with a two-step strategy. The first step consists of exploiting the Chandra and XMM-Newton archives to identify high-z cluster candidates. The total solid angle covered by both telescopes amounts to about 100−200 deg2 (excluding the Galactic plane), and only a minor fraction of these fields reaches the required sensitivity to detect clusters at z > 1, whose typical flux is about 10-14 erg s-1 cm-2. This has been best achieved by a number of ongoing surveys, namely, the XMM Distant Clusters Project (XDCP, Fassbender et al. 2011a), by far the most sucessful to date, the XMM-Cluster Survey (XCS, Lloyd-Davies et al. 2011), and the XMM Large Scale Structure Survey (XMM-LSS, Adami et al. 2011)1. As a second step, it is necessary to perform in-depth studies of the most massive, distant cluster candidates. This strategy requires time-expensive observations with Chandra in order to obtain good signal-to-noise ratio (S/N) spectra (typically collecting a total of 1000 net photons or more in the 0.5−7 keV band) and high-resolution images to remove the effect of contaminating active galactic nuclei (AGN) emission and of central cool cores. Clearly, this goal can also be pursued with deep X-ray follow-up of SZ-selected targets.
If we focus on the most distant cluster candidates, we find that only nine clusters have been spectroscopically confirmed at z ≥ 1.5 to date and only some of them have estimated masses in excess of 1014M⊙ (Brodwin et al. 2011, 2012; Fassbender et al. 2011b; Nastasi et al. 2011; Santos et al. 2011; Papovich et al. 2010; Gobat et al. 2011; Zeimann et al. 2012; Stanford et al. 2012). We note that most of them have been identified in infrared (IR) surveys or by combining near infrared (NIR) and X-ray data2. Moreover, the apparent lack of extended X-ray emission in some of these systems suggests low X-ray luminosities and points towards a re-classification of these objects as protoclusters. Typically, data used for detection do not allow one to determine the virialization status of a structure or to measure the average temperature of the ICM.
In this paper, we present the identification and characterization of the most distant X-ray cluster discovered with Chandra at z ~ 1.5 in the same field of the cluster WARPJ1415.1+3612 (hereafter WARPJ1415, at zspec = 1.03, see Santos et al. 2012). Since these X-ray data are the deepest observation ever carried out with Chandra on clusters at z > 1 (370 ks), they allowed us not only to firmly detect the extended ICM emission, but also to measure its properties from the X-ray spectrum. In addition to the X-ray data, we have high-quality multi-band optical/NIR data from Subaru and infrared Spitzer-IRAC (3.6 μm) imaging. Currently, the only comparable systems in terms of redshift and estimated mass are XMMUJ2235.3-2557 at z = 1.393 (Rosati et al. 2009), XMMUJ0044 at z = 1.578 (Santos et al. 2011), and, recently, IDCS J1426+3508 at z = 1.75 (Stanford et al. 2012). Only the first one, however, was observed with sufficiently deep Chandra and XMM-Newton data to derive a robust total mass estimate.
The paper is organized as follows. In Sect. 2 we describe our X-ray spectral analysis, which provides us with X-ray redshift, temperature, and metallicity. We also measure the surface brightness profile and concentration and derive the ICM mass and the total cluster mass. In Sect. 3 we describe the optical and IR data, discuss the red sequence, and compute galaxy photometric redshifts. In Sect. 4 we discuss the properties of CXO J1415.2+3610 in a cosmological context and in comparison with other distant X-ray clusters. Finally, our conclusions are summarized in Sect. 5. Throughout the paper, we adopt the seven-year WMAP cosmology (ΩΛ = 0.73, Ωm = 0.27, and H0 = 70.4 km s-1 Mpc-1 (Komatsu et al. 2011). In this cosmology, 1″ on the sky corresponds to about 8.56 kpc at z = 1.5. Quoted errors always correspond to a 1σ confidence level. Filter magnitudes are presented in the AB system, unless stated otherwise.
2. Cluster detection and X-ray data analysis
2.1. X-ray data
CXO J1415.2+3610 (hereafter CXO1415, RA: 14:15:20.143, DEC:+36:10:27.56) was serendipitously detected in a deep Chandra GO observation of 280 ks with ACIS-S granted in Cycle 12 (PI J Santos) to study the ICM properties of the cool-core cluster WARPJ1415 at z = 1.03. The new system, located at a distance of ~2 arcmin in the south-west direction of WARPJ1415, was immediately detected by visual inspection as an extended X-ray source in the ACIS-S image (see Fig. 1). The cluster was also visible in a shallower ACIS-I image of 90 ks available in the Chandra archive, which we also use in this study. We tried to recover the XMM data for WARPJ1415 to extract more information on CXO1415. Unfortunately, CXO1415 is barely visible in the total XMM image (PN plus 2 MOS) and is partially affected by a gap. The XMM exposure time after cleaning from high-background interval is about 16 ks. Therefore, XMM data do not provide any useful signal, and our analysis is entirely based on the Chandra data.
The total exposure time of the analyzed data is 370 ks (ACSI-S+ACIS-I). The data reduction and source extraction were performed with CIAO 4.3 and CALDB v4.4.5. A detailed description of the data reduction procedures can be found in Santos et al. (2012). The circular region of maximum S/N is obtained for a radius of 24 arcsec centered on RA = 14:15:20.143, Dec = +36:10:27.56. The source is detected with a S/N of 11.6 and ~3, corresponding to about 540 and 115 net counts (0.5−7 keV band) in ACIS-S and ACIS-I, respectively.
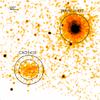 |
Fig. 1 ACIS-S+I image of the clusters field, smoothed with a 3″ Gaussian kernel. The bright cluster WARPJ1415 at z = 1 is visible in the upper right, whereas CXO1415 lies at ~2′ in the south-west direction. The solid circles have a radius of 35″ (corresponding to 300 kpc at z = 1.46), whereas the dashed circle with r = 24″ refers to the aperture of maximum S/N used for the spectral analysis. The image has a size of 4′ × 4′. |
2.2. Spectral analysis: temperature, metallicity, and redshift
We perform a combined spectral analysis of the ACIS-S and ACIS-I data with Xspec v12.6 Arnaud (1996). The adopted spectral model is a single-temperature mekal model (Kaastra 1992; Liedahl et al. 1995), using as a reference the solar abundance of Asplund et al. (2005). The local absorption is fixed to the Galactic neutral hydrogen column density measured at the cluster position and equal to NH = 1.05 × 1020 cm-2 taken from the LAB Survey of Galactic HI (Kalberla et al. 2005). The fits are performed over the energy range 0.5−8.0 keV. We used Cash statistics applied to the source plus background, which is preferable for low S/N spectra (Nousek & Shue 1989).
First, we search for the Kα Fe line complex in order to measure the redshift zX directly from the X-ray analysis. For Chandra observations, about 1000 net counts are needed to measure zX at a 3σ confidence level, and even more are needed in the case of hot clusters, as shown in Yu et al. (2011). Nevertheless, we run a combined fit on the ACIS-S and ACIS-I spectra, leaving free redshift, temperature, metal abundance, and normalization. We find that the best fit gives zX = 1.46 ± 0.025. To better quantify the robustness of the detection of the Fe Kα line complex, we plot in Fig. 2 the quantity Cstat as a function of the redshift parameter, while all the other spectral parameters are set to the best-fit values. The best-fit redshift is obtained with a ΔCstat ~ 8. Formally, a 3 σ confidence level is obtained when ΔCstat = 9 (see Yu et al. 2011). As a result, the redshift measured from the X-ray analysis corresponds to a ~2.8σ (99.5% confidence level) detection of the Fe line. However, as we show later, another relevant piece of information comes from the photometric redshift, which allows us to exclude secondary minima at z ~ 0.8 and z ~ 2.5 and increases the robustness of the redshift value obtained from the X-ray analysis. Therefore, in the following analysis we assume z = zX = 1.46. This result shows that the measure of the redshift from X-ray spectral analysis is possible up to the highest redshift where X-ray clusters are currently detected. This aspect is extremely important when designing a wide and deep survey mission for the future, such as the Wide Field X-ray Telescope (Murray & WFXT Team 2010; Rosati et al. 2011; Tozzi et al. 2011).
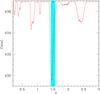 |
Fig. 2 Cstat as a function of redshift parameter for the combined (ACIS-S+ACIS-I) spectral analysis of CXO1415. The minimum is obtained for z = 1.46, when ΔCstat ~ 8. The cyan stripe shows the 1σ confidence interval obtained from the photo-z (zphot = 1.52 ± 0.06, see Sect. 3.2). |
The cluster unabsorbed soft-band flux within a circular region of 24″ radius is
S0.5−2.0 keV = (6.4 ± 0.8) × 10-15
erg s-1 cm-2, and the hard flux
S2−10 keV = (5.8 ± 0.7) × 10-15. The cluster
emission-weighted temperature is  keV. The measured Fe abundance, in units of Asplund et al.
(2005), is
keV. The measured Fe abundance, in units of Asplund et al.
(2005), is  . We
warn that Fe abundance values measured freezing the redshift parameter to the
zX value are slightly biased high (see Yu et al. 2011). Finally, we note that this analysis is in very good
agreement with that based on the ACIS-S data only, which indeed carries most of the
signal. The inclusion of the ACIS-I data helps to slightly reduce the statistical error
bars. For sake of clarity, we show in Fig. 3 the
spectrum of CXO1415 obtained only with ACIS-S, along with the best-fit model.
. We
warn that Fe abundance values measured freezing the redshift parameter to the
zX value are slightly biased high (see Yu et al. 2011). Finally, we note that this analysis is in very good
agreement with that based on the ACIS-S data only, which indeed carries most of the
signal. The inclusion of the ACIS-I data helps to slightly reduce the statistical error
bars. For sake of clarity, we show in Fig. 3 the
spectrum of CXO1415 obtained only with ACIS-S, along with the best-fit model.
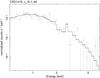 |
Fig. 3 Folded Chandra ACIS-S spectrum of CXO1415 with its best-fit mekal model (solid line). The iron Kα line complex is detected at the 99.5% confidence level at 2.8 keV in the observed reference frame. |
2.3. Surface brightness profile and concentration
To measure the surface brightness of CX01415 we use only the ACIS-S image. The
azymuthally averaged surface brightness profile, which was computed in the
exposure-corrected ACIS-S image in the soft band, is traced out to about 35″ and is well
described by a single β model,
S(r) = S0(1 + (r/rc)2)−3β+0.5 + bkg
(Cavaliere & Fusco-Femiano 1976). The
best-fit model, shown in Fig. 4, left-hand panel, has
a slope β = 1.2 and a core radius rc = 240
kpc for a reduced  . The
uncertainties on the profile parameters are quite large, given the degeneracy between
β and rc (see Fig. 4, right-hand panel). This degeneracy does not significantly affect the
overall profile within the extraction radius, which is used to derive both total and
baryonic mass within 300 kpc in Sect. 2.4. However, the extrapolation of the surface
brightness profile at larger radii is uncertain, and further assumptions are needed to
estimate the total mass up to the virial radius. The total luminosity, being dominated by
the inner regions, will be mildly affected.
. The
uncertainties on the profile parameters are quite large, given the degeneracy between
β and rc (see Fig. 4, right-hand panel). This degeneracy does not significantly affect the
overall profile within the extraction radius, which is used to derive both total and
baryonic mass within 300 kpc in Sect. 2.4. However, the extrapolation of the surface
brightness profile at larger radii is uncertain, and further assumptions are needed to
estimate the total mass up to the virial radius. The total luminosity, being dominated by
the inner regions, will be mildly affected.
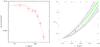 |
Fig. 4 Left: background-subtracted surface brightness profile in the soft (0.5−2 keV) band (points) and best-fit β model (red dashed line) for CXO1415. Error bars correspond to 1σ uncertainty. Right: 1-2-3σ confidence levels for two relevant parameters in the β − rc parameter space. |
The luminosity emitted within 24 arcsec in the soft band is LX [0.5−2.0] = (0.61 ± 0.07) × 1044 erg s-1 and the bolometric luminosity Lbol = (2.1 ± 0.2) × 1044 erg s-1. To compute the total cluster rest-frame luminosity, we apply a correction factor obtained by extrapolating the fit of the surface brightness profile up to the virial radius (see Sect. 2.4). We obtain a total soft-band luminosity of LX [0.5−2.0] = (0.93 ± 0.10) × 1044 erg s-1 and a bolometric Lbol = (3.2 ± 0.3) × 1044 erg s-1. This is probably an upper limit, given that surface brightness profiles are generally observed to steepen in the outer regions with respect to the extrapolation of the beta-fit model (Ettori & Balestra 2009).
The rather flat surface brightness profile within 100 kpc does not support the presence of a cool core. To quantify the core strength, we compute the value of cSB, a concentration parameter defined in Santos et al. (2008) as the ratio of the surface brightness within 40 kpc and 400 kpc: cSB = SB (<40 kpc) / SB (<400 kpc). A cluster is expected to host a cool core if cSB > 0.075. This simple phenomenological parameter has proven to be a robust cool core estimator, particularly in low S/N data typical of distant clusters. We measured cSB = 0.059 ± 0.017, thus confirming that CXO1415 does not show evidence of a well developed cool core.
2.4. Mass measurement
The baryonic mass can be directly computed once the three-dimensional electron density
profile is known. For a simple beta model, this is given by
ne(r) = ne0 [(1 + (r/rc)2)− 3β/2].
To measure ne0, we use the relation between the normalization
of the X-ray spectrum and the electron and proton density in the ICM for the mekal model:
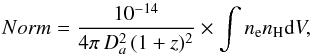 (1)where
Da is the angular diameter distance to
the source (cm), and ne and nH
(cm-3) are the electron and hydrogen densities, respectively, and the volume
integral is performed over the projected region used for the spectral fit (24 arcsec). For
CXO1415, this gives a central density of
ne0 = (0.99 ± 0.13) × 10-2 cm-3.
(1)where
Da is the angular diameter distance to
the source (cm), and ne and nH
(cm-3) are the electron and hydrogen densities, respectively, and the volume
integral is performed over the projected region used for the spectral fit (24 arcsec). For
CXO1415, this gives a central density of
ne0 = (0.99 ± 0.13) × 10-2 cm-3.
The total cluster mass can be estimated under the assumptions of hydrostatic equilibrium
and spherical symmetry, which leads to the simple equation (Sarazin 1988) 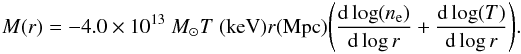 (2)Since we are not able to
measure the temperature profile, we assume isothermality inside the extraction radius and
beyond that adopt a mildly decreasing temperature profile
kT ∝ r-0.24, as found in local clusters
(see Leccardi & Molendi 2008). Therefore
the term in parenthesis in Eq. (2) is contributed by a term due to the slowly declining
temperature profile and by the slope of the density profile, which is simply
−3 β x2/(1 + x2),
where
x = r/rc.
Since we can robustly measure the slope of the density profile only up to 300 kpc, we
decide to keep the slope constant beyond 300 kpc
(dlog (ne)/dlog r = 2.2).
(2)Since we are not able to
measure the temperature profile, we assume isothermality inside the extraction radius and
beyond that adopt a mildly decreasing temperature profile
kT ∝ r-0.24, as found in local clusters
(see Leccardi & Molendi 2008). Therefore
the term in parenthesis in Eq. (2) is contributed by a term due to the slowly declining
temperature profile and by the slope of the density profile, which is simply
−3 β x2/(1 + x2),
where
x = r/rc.
Since we can robustly measure the slope of the density profile only up to 300 kpc, we
decide to keep the slope constant beyond 300 kpc
(dlog (ne)/dlog r = 2.2).
To measure the total mass at a given density contrast, we solve the equation
 to
compute the radius where the average density level with respect to the critical density
ρc(zcl) is Δ.
Typically, mass measurements are reported for Δ = 2500,500, and 200. The
1σ confidence intervals on the mass are computed by including the error
on the temperature and on the gas density profile. The results are shown in Table 1. Only the radius
r2500 = (220 ± 55) kpc is well within the detection region. We
obtain
to
compute the radius where the average density level with respect to the critical density
ρc(zcl) is Δ.
Typically, mass measurements are reported for Δ = 2500,500, and 200. The
1σ confidence intervals on the mass are computed by including the error
on the temperature and on the gas density profile. The results are shown in Table 1. Only the radius
r2500 = (220 ± 55) kpc is well within the detection region. We
obtain  . We also report
the total mass within 300 kpc
. We also report
the total mass within 300 kpc  and the
corresponding ICM mass
and the
corresponding ICM mass  .
.
The total mass extrapolated to r500, with the additional
assumption about the temperature and density profiles, are
 for
for
 kpc. We also extrapolate the mass measurement up to the nominal virial radius, finding
 for
for
 kpc. The ICM mass fraction is almost constant with a value
fICM = 0.10 ± 0.02, which is in very good agreement
with the empirical relation between fICM and
M500 shown in Vikhlinin
et al. (2009).
kpc. The ICM mass fraction is almost constant with a value
fICM = 0.10 ± 0.02, which is in very good agreement
with the empirical relation between fICM and
M500 shown in Vikhlinin
et al. (2009).
Finally, for completeness, we recompute the masses after relaxing the assumption of isothermality within the extraction radius and adopting the temperature profile kT ∝ r-0.24 at any radius. In this case, the only requirement is that the average temperature within this radius is 5.8 keV as observed. With these assumptions, masses at M500 and M200 are ~18% lower than those obtained with the simplest choice T = const. for r < rext. This difference should be regarded as systematic, since the temperature profile within the extraction radius may well behave differently from a simple power law, with significantly different effects on the extrapolated masses. We prefer not to consider this value in the following discussion.
Summary of the mass estimates for CXO1415.
2.5. Systematics in the total mass measurements
Total mass at R500 and R200 obtained under different assumptions for CXO1415.
The mass measurements at R500 and R200 have been obtained under the assumption of hydrostatic equilibrium as an extrapolation of the observed profile beyond the largest radius where X-ray emission is detected (300 kpc), as well as under some reasonable assumptions on the slope of the ICM density and temperature profiles beyond this radius. Our assumptions are: (i) the slope of the density profile remains constant, ~2.2 beyond 300 kpc; (ii) the temperature profile declines as ∝r-0.24 outside the extraction radius as observed in local clusters in the (0.1−0.6) × r180 range (Leccardi & Molendi 2008). In order to evaluate possible systematics associated to the extrapolation of the total mass to R500 and R200, we present the mass estimates adopting three different methods.
Summary of the optical/NIR/IR imaging datasets.
The first estimate (method 2) is based on the redshift-dependent scaling relations
calibrated on local clusters and presented in Vikhlinin
et al. (2009). From the empirical relation described in their Table 3, we find
M500 = (2.4 ± 0.6) × 1014 M⊙.
As a third method, we use the integrated Compton parameter
YX ≡ TX × MICM,
which is considered a robust mass proxy within R500, as shown
by numerical simulations (e.g., Kravtsov et al.
2006). The observed value for CXO1415, assuming r500
as obtained from method 1, is  keV
M⊙.
keV
M⊙.
If we use the YX-M empirical relation taken
from Table 3 of Vikhlinin et al. (2009), we obtain
R500 = (495 ± 45) kpc and
 . Using the
calibration based on numerical simulations obtained in Fabjan et al. (2011), we find
. Using the
calibration based on numerical simulations obtained in Fabjan et al. (2011), we find  , for
, for
 kpc. Both values are obtained iteratively in order to compute consistently all the
quantities at r500. The discrepancy of a factor ~1.5 between
the numerical simulations and the phenomenological
M500 − YX relation can be
partially explained with some nonthermal pressure support not accounted for in the
hydrostatic mass estimates (see Kravtsov et al.
2006).
kpc. Both values are obtained iteratively in order to compute consistently all the
quantities at r500. The discrepancy of a factor ~1.5 between
the numerical simulations and the phenomenological
M500 − YX relation can be
partially explained with some nonthermal pressure support not accounted for in the
hydrostatic mass estimates (see Kravtsov et al.
2006).
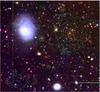 |
Fig. 5 Field color image (Suprime-Cam BRZ filters) of WARPJ1415 (top right) and CXO1415 (bottom left) with soft X-ray contours overlaid in green. The image is 3.5 arcmin horizontally across. |
We also extrapolate the mass according to the Navarro, Frenk & White profile
(NFW, Navarro et al. 1996, method 4), after
requiring a normalization at 300 kpc to the total mass value actually measured from the
data. Still, the extrapolation depends on the unknown concentration parameter. However,
such dependence is not strong and can be included in the extrapolated value once we
restrain the concentration in the plausible range
cNFW = 4.0 ± 0.5, as found in simulations for the wide mass
range
5 × 10¹³ M⊙ < M < 5 × 10¹⁴ M⊙
(Gao et al. 2008). We find
 and
and
 . Here, the much
larger error bars include both the statistical error on the measured mass at
R = 300 kpc and the uncertainty on the concentration parameter.
. Here, the much
larger error bars include both the statistical error on the measured mass at
R = 300 kpc and the uncertainty on the concentration parameter.
The systematic uncertainty due to the different mass measurement methods can be appreciated in Table 2. We find that the systematics error on M500 is about 20%, slightly lower than the 1σ confidence level associated to the statistical uncertainty, which is ~30%. We note that mass estimates based on a beta-profile fitting and the assumption of the hydrostatic equilibrium can give values ~20% lower around r500 (and even larger for larger radii) due to the violation of hydrostatic equilibrim and the presence of significant bulk motions in the ICM. This has been shown in numerical simulations (see Bartelmann & Steinmetz 1996; Rasia et al. 2004; Borgani et al. 2004). Observational calibrations also show that hydrostatic masses underestimate weak lensing masses by 10% on average ar r500 (see Hoekstra 2007; Mahdavi et al. 2012). We do not find evident bias when comparing our hydrostatic mass (method 1) with values obtained with empirical calibrations (methods 2, 3), also because the statistical errors are larger than the possible effects of residual bulk motions. Therefore, all the mass measurements we obtained are consistent with each other within the errors. Our conclusion is that it is feasible to measure M500 for high-z, massive clusters using deep Chandra exposures, although clusters with fluxes below 10-14 erg s-1 cm-2, like CXO1415, suffer a nonnegligible systematic uncertainty due to some unavoidable extrapolation.
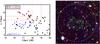 |
Fig. 6 Left: (z − 3.6 μm) color−magnitude relation of CXO1415. Only objects within 1′ distance from the X-ray center are shown (black circles). The 21 red cluster candidates (red circles) are selected on the basis of the color cut 5 < z − 3.6 μm < 6.5. For comparison we also plot 19 confirmed members of WARPJ1415 at z = 1 (blue triangles). The magenta star indicates the galaxy coincident with the X-ray peak. Right: selection of red, high-z cluster galaxy candidates (white circles), with X-ray contours displayed in green. The brightest candidate is marked by a yellow circle. |
3. Optical/IR analysis
The field of CXO1415 has wide optical photometric coverage with Subaru-Suprime (BVRiz), in addition to near-IR JKs with Subaru-Moircs and Spitzer-IRAC 3.6 μm. A summary of the archival photometric data used in our analysis is provided in Table 3. Standard reduction procedures using IRAF routines were used to produce the optical/NIR science images retrieved from SMOKA (Baba et al. 2002), with an average seeing of 0.68″ in the optical bands, and 0.60″ in the near-IR. Finally, we used level 2 Spitzer-IRAC 3.6 μm observations from the archive, which are higher level reduced (pbcd) products.
3.1. Color−magnitude diagram
Relaxed galaxy clusters are characterized by a well-defined sequence of red, passively evolving galaxies (see Gladders & Yee 2005). This relation has been shown to remain fairly constant up to z = 1.4 (Mei et al. 2009; Strazzullo et al. 2010; Rosati et al. 2009). However, recent studies at z > 1.4 indicate the appearance of star formation in the central brightest galaxies (Hilton et al. 2010; Fassbender et al. 2011b; Santos et al. 2011), with an increasing scatter in the red sequence.
In this section, we investigate the (z′ − 3.6 μm) color−magnitude relation (CMR) of CXO1415. This optical/IR diagnostic has proven to be an accurate tool to study the galaxy population of z > 1 clusters (e.g., Muzzin et al. 2009; Brodwin et al. 2010). The BRz color image reveals a population of red galaxies centered on the X-ray contours, as shown in Fig. 5. We use SExtractor (Bertin & Arnouts 1996) to perform source detection and galaxy photometry. We measure aperture magnitudes corrected to 1″ in the z-band and apertures of 1.8″ in the 3.6 μm band. The total 3.6 μm magnitude is given by the SExtractor parameter MAGAUTO. An aperture correction corresponding to 2.5 × log (1.112) was applied to the IRAC band to match the optical magnitudes3.
The z′ − 3.6 μm CMR, which includes only objects within a cluster-centric distance of 1′, is presented in Fig. 6, left-hand panel. The galaxy coincident with the X-ray peak (indicated by a magenta star) has a total 3.6 μm magnitude of 16.9 and a color equal to 5.7. Contrary to what is commonly observed at lower redshifts, this galaxy is not the brightest cluster galaxy. A sequence of red galaxies clearly stands out at 5 < z′ − 3.6 μm < 6.5. For comparison we also plot the red sequence of 21 out of 25 spectroscopically confirmed members of WARPJ1415 (Huang et al. 2009), which has a median color of 4.4 mag. If we further restrict the color cut to 5.5 < z′ − 3.6 μm < 6.3 and the total magnitude to below 18 mag, we obtain a more stringent locus for the red sequence, described by a linear fit with a slope of − 0.25. The mean (z′ − 3.6 μm) color computed for the enclosed 12 galaxies is then 5.8 mag, with a spread of 0.21 mag. This already shows that CXO1415 is at considerably higher redshift than 1. The cluster red sequence is well approximated by a Bruzual & Charlot (2003) single starburst model with passively evolving galaxies with an age of 2 Gyr. These models, which accurately reproduce the red-sequence of WARPJ1415 at z = 1, predict a redshift of ~1.5 for CXO1415 for a color (z′ − 3.6 μm)= 5.8. This simple redshift estimate is improved in the next section by using all eight photometric bands.
3.2. Photometric redshifts
Using our eight-band multicolor catalog, we computed photometric redshifts for the candidate red galaxies with the photo-z code zebra (Feldmann et al. 2006) by comparing the observed magnitudes with those expected from template spectral energy distributions (SED) by Bruzual & Charlot (2003) through a standard SED fitting procedure. Our results for CXO1415 were calibrated against WARPJ1415 at z = 1.03, for which we obtained an accurate mean photo-z of ⟨ zphot ⟩ = 0.98, with an rms dispersion ~0.08 based on the colors of 17 spectroscopic members. The comparison of spectroscopic and photometric redshift for WARPJ1415 members shows that the photo-z accuracy on the average redshift is Δ ⟨ z ⟩ = 0.05. Of the 21 CXO1415 galaxy candidates selected in the CMR, four are outside the FoV of the Moircs data. A visual inspection of these galaxies forced us to discard another four galaxies because of their faint magnitudes and blending with nearby objects, which may result in unreliable photometry. The histogram of the photometric redshifts is shown in Fig. 7. Based on the SED fit of 13 red candidates, we find for CXO1415 ⟨ zphot ⟩ = 1.52 ± 0.06, where the 1σ error is estimated by extrapolating to z = 1.5 the photo-z accuracy measured at z = 1, assuming a dependence ∝ (1 + z). This result is in good agreement with the zX obtained from the X-ray spectral analysis.
At present, we do not yet have the spectral confirmation of the redshift of CXO1415. We recently analyzed long-slit spectra of two galaxies (including the central one) obtained with OSIRIS (Optical System for Imaging and low-intermediate Resolution Integrated Spectroscopy, Cepa et al. 2000) on the 10m facility Grantecan at La Palma (Spain). Unfortunately, we collected only one out of seven hours originally requested, and the quality of the spectra was not sufficient to derive reliable redshifts. More efforts to achieve a spectroscopic measure of the redshift of CXO1415 are ongoing.
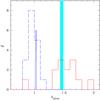 |
Fig. 7 Histogram of photometric redshifts computed in the cluster field. We show the photometric redshift distribution of 17 spectroscopic members of WARPJ1415 at z = 1.03 (blue dashed line) and the photometric redshift distribution of 13 candidate members selected from the red sequence of CXO1415 (red solid line). The thinner histogram (solid blue line) marks the spectroscopic redshift distribution of WARPJ1415, while the cyan stripe corresponds to the X-ray redshift zX = 1.46 ± 0.025. |
Finally, we note that an in-depth morphological study of the cluster galaxies would be extremely interesting. Robust morphological classification of cluster galaxy candidates would require HST/WFC3 imaging. Our Subaru NIR imaging in very good seeing data suggests that about half of the selected red sequence galaxies show a distorted late-type morphology, which is not uncommon in clusters at these redshifts (see Hilton et al. 2010; Fassbender et al. 2011b; Santos et al. 2011).
4. Discussion
CXO1415 was originally discovered by visual inspection in the original 80 ks ACIS-I exposure4. In order to estimate the effective sky area within which it was found, we carried out a simple experiment based on an inspection of the same image at different exposure times. This experiment allowed us to determine the minimum exposure time necessary for a mere detection of the extended emission. By trimming the exposure time of the ACIS-S and ACIS-I image of CXO1415, we found that 20 net counts can be considered a firm limit for detection as an extended source via visual inspection. This implies that CXO1415 could have been detected in all the ACIS-I observations with more than 15 ks and all the ACIS-S observations with more than 12 ks. The most conservative choice is to compute the solid angle covered by all the Chandra ACIS-I and ACIS-S extragalactic fields where CXO1415 may have been detected. We browsed the entire Chandra archive up to Cycle 12, combined multiple exposures of the same region of the sky, and found that a total of about 70 deg2 had been observed at the required depth. This must be considered as an upper limit, since we do not take into account the solid angle lost due to the presence of bright extended targets in several extragalactic Chandra fields.
We can use this extremely conservative choice of sky coverage to estimate the maximum
search volume from where CXO1415 has been drawn. Using this information in combination with
the cluster mass function of Tinker et al. (2008)
with WMAP7 parameters (Komatsu et al. 2011)5, we find that CXO1415 by itself, after considering the
uncertainty in its virial mass and accounting for the corresponding Malmquist bias (Mortonson et al. 2011), does not create any tension with
the reference ΛCDM model. In order to compare our data with the theoretical predictions, we
computed the mass of CXO1415 for a given overdensity with respect to the background density
(as opposed to the critical density, which is more commonly used) according to the masses
defined in Tinker et al. (2008). Therefore we measure
the mass of CXO1415 within an overdensity of Δ = 600 with respect to the background density,
finding  . Finally, we find
that six clusters with the mass of CXO1415 are expected at z ≥ 1.46 in 70
deg2. If we consider a 20% higher mass as expected in the presence of a bias
due to the violation of the hydrostatic equilibrium (as discussed in Sect. 2.5), we find
that only three clusters are expected at z ≥ 1.46 in 70 deg2.
Therefore, even if CXO1415 is not an extreme cluster, it is clear that a deep investigation
of the entire Chandra archive in search of faint extended sources can
provide a sizeable number of clusters with masses
~1014 M⊙. Such a sample can provide tight
constraints on the cosmological parameters and possibly some discrepancy with respect to the
reference ΛCDM. On the other hand, to achieve the same accuracy on the mass on the entire
sample, a large amount of Chandra time would be required.
. Finally, we find
that six clusters with the mass of CXO1415 are expected at z ≥ 1.46 in 70
deg2. If we consider a 20% higher mass as expected in the presence of a bias
due to the violation of the hydrostatic equilibrium (as discussed in Sect. 2.5), we find
that only three clusters are expected at z ≥ 1.46 in 70 deg2.
Therefore, even if CXO1415 is not an extreme cluster, it is clear that a deep investigation
of the entire Chandra archive in search of faint extended sources can
provide a sizeable number of clusters with masses
~1014 M⊙. Such a sample can provide tight
constraints on the cosmological parameters and possibly some discrepancy with respect to the
reference ΛCDM. On the other hand, to achieve the same accuracy on the mass on the entire
sample, a large amount of Chandra time would be required.
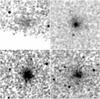 |
Fig. 8 Chandra images of four high-redshift massive clusters observed with deep Chandra observations. The four clusters are all re-imaged at the same redshift of CXO1415 (z = 1.46) and their observations rescaled to a 100 ks ACIS-S observation (including CXO1415) in order to offer an immediate comparison. Top left: CXO1415; top right: WARPJ1415; bottom left: XMM2235; bottom right: RXJ1252. Images are smoothed with a 1 arcsec Gaussian kernel and cover 3 × 3 arcmin. |
The mass determination of CXO1415 is also difficult as it appears to be less luminous than other distant massive galaxy clusters. Its total6 soft-band luminosity is estimated to be LX [0.5−2.0] = (0.93 ± 0.10) × 1044 erg s-1. Since the measured mass of WARPJ1415 at z = 1.03 is comparable to that of CXO1415, it is interesting to compare their luminosities. We find that the total luminosity of WARPJ1415 is LX [0.5−2.0] = (4.0 ± 0.2) × 1044 erg s-1. If we remove the contribution of the cool core of WARPJ1415, using the double beta model fitting of Santos et al. (2012), we find a total luminosity of LX [0.5−2.0] ~ (3.4 ± 0.2) × 1044 erg s-1, which is the correct value to be compared with CXO1415. Therefore, we find that CXO1415 is more than three times less luminous with respect to WARP1415.
It is also interesting to compare these values with those expected from the empirical, redshift-dependent M − L relation presented in Vikhlinin et al. (2009). We find that WARPJ1415 is expected to have LXexp = (1.6 ± 0.4) × 1044 erg s-1, while CXO1415 LXexp = (2.0 ± 0.5) × 1044 erg s-1. The expected values do not include an uncertainty of a factor ~1.5 due to the observed intrinsic scatter in luminosity for a fixed mass. Remarkably, WARPJ1415 is scattered above the average L − M relation by a factor of 2, while CXO1415 is scattered below it by about the same factor. If we consider the most massive X-ray cluster investigated so far at high z, XMM2235 (Rosati et al. 2009), we find once again that the measured total luminosity LX [0.5−2.0] = (3.0 ± 0.15) × 1044 is lower than the expected one by a factor of 2. Finally, the less massive RXJ1252 (Rosati et al. 2004) at z = 1.235 is consistent with the average L − M relation.
The striking difference of the appearance of the four clusters is shown in Fig. 8, where XMM2235, WARPJ1415, and RXJ1252 are re-imaged at the same redshift of CXO1415 for a hypothetical 100 ks exposure with Chandra ACIS-S. Although very small, K-correction effects are taken into account, and the proper background for a 100 ks ACIS-S observation is simulated. Therefore, these images can be considered as real data, since they were obtained simply by trimming real exposures in order to achieve the exact brightness that each cluster would have at z = 1.46 for a 100 ks ACIS-S observation7. The only artificial interventions are the almost negligible resizing (since they are all high-z clusters and the angular distance has a weak dependence on z for z > 1) and the added background in order to be consistent with a real ACIS-S observation. Thanks to these properties, the images offer an immediate visual comparison of the four clusters as if all of them were at the same redshift of z = 1.46. We perform a simple radial profile analysis on the four images shown in Fig. 9. Clearly, the differences in luminosity are not only due to the presence of a cool core, but also to the overall normalization of the brightness profiles. The diversity of this small sample suggests an increasing spread in the properties of high-z clusters, possibly related to the transition from the formation of protoclusters with little ICM emission (z ≥ 2) and the first virialized massive clusters around z ~ 1.5. A large fraction of clusters at this redshift may be in the first stage of collapse, an occurrence that could explain both the low luminosity of CXO1415 and its elongated shape. We argue that the deep X-ray investigation of very high redshift clusters will provide useful insights into the ICM and dynamical properties of clusters in this crucial transition epoch. A high-z cluster that will be observed with a deep exposure by Chandra in Cycle 14 is XMMUJ0044 at z = 1.578 (Santos et al. 2011). Another remarkable target is the IR-selected cluster IDCS1426 at z = 1.75 (Stanford et al. 2012), which has a flux five times higher than CXO1415. Unfortunately, at present this cluster has only a 10 ks Chandra ACIS-I exposure and therefore no X-ray mass estimate. We note, however, that IDCSJ1426 will be observed for 100 ks in Chandra AO14 (PI M. Brodwin).
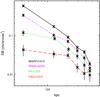 |
Fig. 9 Radial profiles from the four clusters re-imaged at z = 1.5 shown in Fig. 8: WARPS1415 (solid black line); XMMUJ2235 (dashed magenta line); RXJ1252 (dotted green line); CXO1415 (long-dashed red line). |
Finally, as for the chemical properties of the ICM, we notice that the measured Fe abundance of CXO1415 is supersolar, but the 1σ error is large enough to make it consistent with the average values measured at z ~ 1.3 (see Tozzi et al. 2003; Balestra et al. 2007). Given the flux of CXO1415, an exposure time exceeding 1Ms would be necessary to measure the Fe abundance with a 20% error and to confirm the Fe excess. This would be extremely interesting though, since this value cannnot be traced back to the presence of a cool core hosting a brightest cluster galaxy (BCG). Both the low value of the cSB parameter and the absence of a clear BCG in the optical image exclude the presence of a strong cool core. If confirmed, the high Fe abundance value would be another striking difference with respect to low-z clusters, where supersolar Fe abundances are always associated to cool cores and clear BCG (De Grandi et al. 2004; de Grandi & Molendi 2009). In addition, the lookback time of 9.2 Gyr can put strong constraints on the early phases of ICM enrichment by Type Ia supernovae. This is clearly a case for future X-ray facilities with high effective area and high angular resolution.
To summarize, although the number of cluster candidates in the range 1 < z < 2 is steadily increasing, mostly thanks to IR surveys, very few deep X-ray studies are available. Targets drawn from non-X-ray selected samples may turn out to be very faint in X-ray, and deep Chandra exposures will remain the only means to physically characterize such faint sources. It is clear that only a sensitive, survey-dedicated mission can provide a major breakthrough in this field. Even though eROSITA (Predehl et al. 2010; Cappelluti et al. 2011) will finally provide an X-ray all-sky coverage 20 years after ROSAT, it does not have the sensitivity or the spectral response needed to find and characterize clusters at fluxes as low as few × 10-14 erg s-1 cm-2. On the other hand, a wide field imager with CCD spectral resolution and an angular resolution as good as 5 arcsec (HEW) has been shown to be highly effective in this science case (see Murray & WFXT Team 2010; Rosati et al. 2011), and in many others concerning the rich, high-z X-ray sky.
5. Conclusions
In this paper, we presented the deep X-ray observation of the most distant X-ray cluster of galaxies discovered with Chandra so far. CXO1415 was serendipitously discovered in the WARPJ1415 field, and imaged in the deep exposure aimed at studying the ICM properties of WARPJ1415 at z = 1.03. Even though we do not have optical spectroscopy, our rich multi-wavelength observations allowed us to estimate a robust photometric redshift, based on the CMR technique and on standard SED fitting procedures. Our photometric analysis is further strengthened by the presence of WARPJ1415 in the imaging fields, which acted as redshift calibrator. The photometric redshift of CXO1415 turns out to be zphot = 1.52 ± 0.06. This result is confirmed by the detection of the Kα Fe emission line in the X-ray spectrum, which gives zX = 1.46 ± 0.025. Contrary to the few currently known very high-redshift clusters, we are able to obtain a robust measure of the ICM temperature and total mass within 300 kpc and a reliable extrapolation up to R500. Here we summarize our main results:
-
CXO1415 is detected with a S/N ~ 11 within a circle with a radius of 24 arcsec. The surface brightness can be fitted by a beta model; the soft-band flux within r = 24″ is equal to S0.5−2.0 keV = (6.5 ± 0.3) × 10-15 erg s-1 cm-2;
-
we identify the Fe Kα complex line with a ~2.8σ confidence level, showing that the measure of redshift through X-ray spectral analysis is possible up to the highest redshift where X-ray clusters are currently detected;
-
the spectral fit with a mekal model gives
 keV and a Fe abundance
  ;
; -
the total mass measured at R2500 = (220 ± 55) kpc is
 . The total
mass is measured up to 300 kpc, where it amounts to
. The total
mass is measured up to 300 kpc, where it amounts to
 , while the
ICM mass is
, while the
ICM mass is  , resulting
in a ICM mass fraction of ~10%;
, resulting
in a ICM mass fraction of ~10%; -
by fixing the slope of the density profile to the value measured at 300 kpc and assuming a mildly decreasing temperature profile as observed in local clusters, we are able extrapolate the mass measurement up to
kpc, finding ; this value
is consistent with those obtained using empirical relations between X-ray observable
and total mass; -
considering its mass, CXO1415 appears to be underluminous, particularly if compared with other high-z massive clusters;
-
the color−magnitude diagram of cluster member candidates shows both a red sequence and a significant fraction of blue, irregular-morphology galaxies. A spectroscopic follow up is needed to perform an in-depth study of the galaxy population, which is expected to show the signature of the red sequence assembly around z ~ 1.5;
-
when compared with the expectations for a ΛCDM universe based on the mass function of Tinker et al. (2008), CXO1415 appears to be a typical cluster at z ~ 1.5 for a WMAP cosmology (Komatsu et al. 2011); however, the redshift and the total mass of CX01415 place it among the sample of massive, distant galaxy clusters which may be used to test the standard ΛCDM model once a complete census of the Chandra archive is performed.
We note that the realm of high-z clusters (z ~ 1.5 and higher, when the lookback time is larger than 9 Gyr) is at the limit of the capability of Chandra and well beyond what XMM-Newton and eROSITA can reach. At present, only an handful of sources have the X-ray coverage sufficient for a detailed analysis. While the Chandra and XMM-Newton missions will somewhat increase this sample, it is not realistic to foresee a significant increase of data on massive high-z clusters with the required high S/N. In the near future, this field is likely to be dominated by SZ observations and other near-IR large-area surveys, which will unveil more and more clusters at z ≫ 1. However, X-ray observations will still be required for a physical characterization of these systems and a vast range of astrophysical and cosmological applications. Only a wide-field, high angular resolution X-ray mission with a large collecting area and good spectral resolution up to 7 keV seems to be able to match such requirements.
For a quick overview of current X-ray surveys, see Tundo et al. (2012).
No SZ-selected clusters are currently found above z = 1.5, the most distant confirmed SZ-selected cluster is reported at z ~ 1.32 (Stalder et al. 2013).
This also suggests that a “crowd-sourcing” project of the kind of Galaxy Zoo (see Lintott et al. 2011) may be very useful if applied to Chandra X-ray images.
Specifically, we assumed a flat ΛCDM model with σ8 = 0.81, Ω0 = 0.275, h = 0.70 for a flat geometry.
The total luminosities are obtained by integrating the surface brightness distribution up to the nominal virial radius. Although the large majority of the emission is concentrated towards the center, the total luminosity is estimated to be about a factor 1.4 larger than what was actually measured within the extraction region.
We also note that the profile of CXO1415 shown in Fig. 8 is noisier than that shown in this paper, since it refers only to ~1/3 (100 ks) of the total exposure time.
Acknowledgments
The authors thank Dunja Fabjan and Renee Fassbender for discussion. We also thank the referee, Manolis Plionis, for useful comments. We acknowledge financial contribution from contract ASI-INAF I/088/06/0 and ASI-INAF I/009/10/0, and from the PD51 INFN grant. This work was carried out with Chandra Observation Award Number 12800510 in GO 12. P.R. acknowledges partial support from the DFG cluster of excellence Origin and Structure of the Universe program. Results are also based on data collected at Subaru Telescope, Okayama Astrophysical Observatory, Kiso Observatory (University of Tokyo) and obtained from the SMOKA, which is operated by the Astronomy Data Center, National Astronomical Observatory of Japan. This research has made use of the NASA/IPAC Infrared Science Archive, which is operated by the Jet Propulsion Laboratory, California Institute of Technology, under contract with the National Aeronautics and Space Administration.
References
- Adami, C., Mazure, A., Pierre, M., et al. 2011, A&A, 526, A18 [NASA ADS] [CrossRef] [EDP Sciences] [Google Scholar]
- Allen, S. W., Schmidt, R. W., & Fabian, A. C. 2002, MNRAS, 334, L11 [NASA ADS] [CrossRef] [Google Scholar]
- Allen, S. W., Evrard, A. E., & Mantz, A. B. 2011, ARA&A, 49, 409 [NASA ADS] [CrossRef] [Google Scholar]
- Amendola, L., Pettorino, V., Quercellini, C., & Vollmer, A. 2012, Phys. Rev. D, 85, 103008 [NASA ADS] [CrossRef] [Google Scholar]
- Andersson, K., Benson, B. A., Ade, P. A. R., et al. 2011, ApJ, 738, 48 [NASA ADS] [CrossRef] [Google Scholar]
- Arnaud, K. A. 1996, in Astronomical Data Analysis Software and Systems V, eds. G. H. Jacoby, & J. Barnes, ASP Conf. Ser., 101, 17 [Google Scholar]
- Asplund, M., Grevesse, N., & Sauval, A. J. 2005, in Cosmic Abundances as Records of Stellar Evolution and Nucleosynthesis, eds. T. G. Barnes III, & F. N. Bash, ASP Conf. Ser., 336, 25 [Google Scholar]
- Baba, H., Yasuda, N., Ichikawa, S.-I., et al. 2002, Rep. Nat. Astron. Obs. Japan, 6, 23 [Google Scholar]
- Balaguera-Antolínez, A., Sánchez, A. G., Böhringer, H., et al. 2011, MNRAS, 413, 386 [NASA ADS] [CrossRef] [Google Scholar]
- Baldi, M., & Pettorino, V. 2011, MNRAS, 412, L1 [NASA ADS] [CrossRef] [Google Scholar]
- Balestra, I., Tozzi, P., Ettori, S., et al. 2007, A&A, 462, 429 [NASA ADS] [CrossRef] [EDP Sciences] [Google Scholar]
- Bartelmann, M., & Steinmetz, M. 1996, MNRAS, 283, 431 [NASA ADS] [Google Scholar]
- Bertin, E., & Arnouts, S. 1996, A&AS, 117, 393 [NASA ADS] [CrossRef] [EDP Sciences] [Google Scholar]
- Borgani, S., Murante, G., Springel, V., et al. 2004, MNRAS, 348, 1078 [NASA ADS] [CrossRef] [Google Scholar]
- Brodwin, M., Ruel, J., Ade, P. A. R., et al. 2010, ApJ, 721, 90 [NASA ADS] [CrossRef] [Google Scholar]
- Brodwin, M., Stern, D., Vikhlinin, A., et al. 2011, ApJ, 732, 33 [NASA ADS] [CrossRef] [Google Scholar]
- Brodwin, M., Gonzalez, A. H., Stanford, S. A., et al. 2012, ApJ, 753, 162 [NASA ADS] [CrossRef] [Google Scholar]
- Bruzual, G., & Charlot, S. 2003, MNRAS, 344, 1000 [NASA ADS] [CrossRef] [Google Scholar]
- Cappelluti, N., Predehl, P., Böhringer, H., et al. 2011, Mem. Soc. Astron. It. Suppl., 17, 159 [Google Scholar]
- Cavaliere, A., & Fusco-Femiano, R. 1976, A&A, 49, 137 [NASA ADS] [Google Scholar]
- Cepa, J., Aguiar, M., Escalera, V. G., et al. 2000, in SPIE Conf. Ser. 4008, eds. M. Iye, & A. F. Moorwood, 623 [Google Scholar]
- Chongchitnan, S., & Silk, J. 2012, Phys. Rev. D, 85, 063508 [NASA ADS] [CrossRef] [Google Scholar]
- De Grandi, S., Ettori, S., Longhetti, M., & Molendi, S. 2004, A&A, 419, 7 [NASA ADS] [CrossRef] [EDP Sciences] [Google Scholar]
- de Grandi, S., & Molendi, S. 2009, A&A, 508, 565 [NASA ADS] [CrossRef] [EDP Sciences] [Google Scholar]
- Ettori, S., & Balestra, I. 2009, A&A, 496, 343 [NASA ADS] [CrossRef] [EDP Sciences] [Google Scholar]
- Ettori, S., Tozzi, P., & Rosati, P. 2003, A&A, 398, 879 [NASA ADS] [CrossRef] [EDP Sciences] [Google Scholar]
- Ettori, S., Morandi, A., Tozzi, P., et al. 2009, A&A, 501, 61 [NASA ADS] [CrossRef] [EDP Sciences] [Google Scholar]
- Fabjan, D., Borgani, S., Rasia, E., et al. 2011, MNRAS, 416, 801 [NASA ADS] [CrossRef] [Google Scholar]
- Fassbender, R., Böhringer, H., Nastasi, A., et al. 2011a, New J. Phys., 13, 125014 [NASA ADS] [CrossRef] [Google Scholar]
- Fassbender, R., Nastasi, A., Böhringer, H., et al. 2011b, A&A, 527, L10 [NASA ADS] [CrossRef] [EDP Sciences] [Google Scholar]
- Feldmann, R., Carollo, C. M., Porciani, C., et al. 2006, MNRAS, 372, 565 [NASA ADS] [CrossRef] [Google Scholar]
- Foley, R. J., Andersson, K., Bazin, G., et al. 2011, ApJ, 731, 86 [NASA ADS] [CrossRef] [Google Scholar]
- Gao, L., Navarro, J. F., Cole, S., et al. 2008, MNRAS, 387, 536 [NASA ADS] [CrossRef] [Google Scholar]
- Gladders, M. D., & Yee, H. K. C. 2005, ApJS, 157, 1 [NASA ADS] [CrossRef] [Google Scholar]
- Gobat, R., Daddi, E., Onodera, M., et al. 2011, A&A, 526, A133 [NASA ADS] [CrossRef] [EDP Sciences] [Google Scholar]
- Harrison, I., & Coles, P. 2012, MNRAS, 421, L19 [NASA ADS] [Google Scholar]
- Hilton, M., Lloyd-Davies, E., Stanford, S. A., et al. 2010, ApJ, 718, 133 [NASA ADS] [CrossRef] [Google Scholar]
- Hoekstra, H. 2007, MNRAS, 379, 317 [NASA ADS] [CrossRef] [Google Scholar]
- Hoyle, B., Jimenez, R., & Verde, L. 2011, Phys. Rev. D, 83, 103502 [NASA ADS] [CrossRef] [Google Scholar]
- Huang, X., Morokuma, T., Fakhouri, H. K., et al. 2009, ApJ, 707, L12 [NASA ADS] [CrossRef] [Google Scholar]
- Jee, M. J., Rosati, P., Ford, H. C., et al. 2009, ApJ, 704, 672 [NASA ADS] [CrossRef] [Google Scholar]
- Jee, M. J., Dawson, K. S., Hoekstra, H., et al. 2011, ApJ, 737, 59 [NASA ADS] [CrossRef] [Google Scholar]
- Jimenez, R., & Verde, L. 2009, Phys. Rev. D, 80, 127302 [NASA ADS] [CrossRef] [Google Scholar]
- Kaastra, J. 1992, An X-Ray Spectral Code for Optically Thin Plasmas, Internal SRON Leiden Report, updated version 2.0 [Google Scholar]
- Kalberla, P. M. W., Burton, W. B., Hartmann, D., et al. 2005, A&A, 440, 775 [NASA ADS] [CrossRef] [EDP Sciences] [Google Scholar]
- Komatsu, E., Smith, K. M., Dunkley, J., et al. 2011, ApJS, 192, 18 [NASA ADS] [CrossRef] [Google Scholar]
- Kravtsov, A. V., & Borgani, S. 2012, ARA&A, 50, 353 [NASA ADS] [CrossRef] [Google Scholar]
- Kravtsov, A. V., Vikhlinin, A., & Nagai, D. 2006, ApJ, 650, 128 [NASA ADS] [CrossRef] [Google Scholar]
- Leccardi, A., & Molendi, S. 2008, A&A, 487, 461 [NASA ADS] [CrossRef] [EDP Sciences] [Google Scholar]
- Liedahl, D. A., Osterheld, A. L., & Goldstein, W. H. 1995, ApJ, 438, L115 [NASA ADS] [CrossRef] [Google Scholar]
- Lintott, C., Schawinski, K., Bamford, S., et al. 2011, MNRAS, 410, 166 [NASA ADS] [CrossRef] [Google Scholar]
- Lloyd-Davies, E. J., Romer, A. K., Mehrtens, N., et al. 2011, MNRAS, 418, 14 [NASA ADS] [CrossRef] [Google Scholar]
- Mahdavi, A., Hoekstra, H., Babul, A., et al. 2012, ApJ, submitted [arXiv:1210.3689] [Google Scholar]
- Mantz, A., Allen, S. W., Rapetti, D., & Ebeling, H. 2010, MNRAS, 406, 1759 [NASA ADS] [Google Scholar]
- Mei, S., Holden, B. P., Blakeslee, J. P., et al. 2009, ApJ, 690, 42 [NASA ADS] [CrossRef] [Google Scholar]
- Mortonson, M. J., Hu, W., & Huterer, D. 2011, Phys. Rev. D, 83, 023015 [NASA ADS] [CrossRef] [Google Scholar]
- Murray, S. S., & WFXT Team. 2010, in Bull. Am. Astron. Soc., 42, 520 [Google Scholar]
- Muzzin, A., Marchesini, D., van Dokkum, P. G., et al. 2009, ApJ, 701, 1839 [NASA ADS] [CrossRef] [Google Scholar]
- Nastasi, A., Fassbender, R., Böhringer, H., et al. 2011, A&A, 532, L6 [NASA ADS] [CrossRef] [EDP Sciences] [Google Scholar]
- Navarro, J. F., Frenk, C. S., & White, S. D. M. 1996, ApJ, 462, 563 [NASA ADS] [CrossRef] [Google Scholar]
- Nousek, J. A., & Shue, D. R. 1989, ApJ, 342, 1207 [NASA ADS] [CrossRef] [Google Scholar]
- Papovich, C., Momcheva, I., Willmer, C. N. A., et al. 2010, ApJ, 716, 1503 [NASA ADS] [CrossRef] [Google Scholar]
- Planck Collaboration 2013, A&A, 550, A130 [NASA ADS] [CrossRef] [EDP Sciences] [Google Scholar]
- Predehl, P., Böhringer, H., Brunner, H., et al. 2010, in AIP Conf. Ser. 1248, eds. A. Comastri, L. Angelini, & M. Cappi, 543 [Google Scholar]
- Rapetti, D., Blake, C., Allen, S. W., et al. 2012, MNRAS, submitted [arXiv:1205.4679] [Google Scholar]
- Rasia, E., Tormen, G., & Moscardini, L. 2004, MNRAS, 351, 237 [NASA ADS] [CrossRef] [Google Scholar]
- Reichardt, C. L., Stalder, B., Bleem, L. E., et al. 2013, ApJ, 763, 127 [NASA ADS] [CrossRef] [Google Scholar]
- Reid, B. A., Samushia, L., White, M., et al. 2012, MNRAS, 426, 2719 [NASA ADS] [CrossRef] [Google Scholar]
- Rosati, P., Borgani, S., & Norman, C. 2002, ARA&A, 40, 539 [NASA ADS] [CrossRef] [Google Scholar]
- Rosati, P., Tozzi, P., Ettori, S., et al. 2004, AJ, 127, 230 [NASA ADS] [CrossRef] [Google Scholar]
- Rosati, P., Tozzi, P., Gobat, R., et al. 2009, A&A, 508, 583 [NASA ADS] [CrossRef] [EDP Sciences] [Google Scholar]
- Rosati, P., Borgani, S., Gilli, R., et al. 2011, Mem. Soc. Astron. It. Suppl., 17, 8 [Google Scholar]
- Santos, J. S., Rosati, P., Tozzi, P., et al. 2008, A&A, 483, 35 [NASA ADS] [CrossRef] [EDP Sciences] [Google Scholar]
- Santos, J. S., Fassbender, R., Nastasi, A., et al. 2011, A&A, 531, L15 [NASA ADS] [CrossRef] [EDP Sciences] [Google Scholar]
- Santos, J. S., Tozzi, P., Rosati, P., Nonino, M., & Giovannini, G. 2012, A&A, 539, A105 [NASA ADS] [CrossRef] [EDP Sciences] [Google Scholar]
- Sarazin, C. L. 1988, X-ray emission from clusters of galaxies [Google Scholar]
- Sartoris, B., Borgani, S., Fedeli, C., et al. 2010, MNRAS, 407, 2339 [NASA ADS] [CrossRef] [Google Scholar]
- Sawangwit, U., Shanks, T., Croom, S. M., et al. 2012, MNRAS, 420, 1916 [NASA ADS] [CrossRef] [Google Scholar]
- Schmidt, F., Vikhlinin, A., & Hu, W. 2009, Phys. Rev. D, 80, 083505 [NASA ADS] [CrossRef] [Google Scholar]
- Sehgal, N., Trac, H., Acquaviva, V., et al. 2011, ApJ, 732, 44 [NASA ADS] [CrossRef] [Google Scholar]
- Stalder, B., Ruel, J., Suhada, R., et al. 2013, ApJ, 763, 93 [NASA ADS] [CrossRef] [Google Scholar]
- Stanford, S. A., Brodwin, M., Gonzalez, A. H., et al. 2012, ApJ, 753, 164 [NASA ADS] [CrossRef] [Google Scholar]
- Strazzullo, V., Rosati, P., Pannella, M., et al. 2010, A&A, 524, A17 [NASA ADS] [CrossRef] [EDP Sciences] [Google Scholar]
- Suzuki, N., Rubin, D., Lidman, C., et al. 2012, ApJ, 746, 85 [NASA ADS] [CrossRef] [Google Scholar]
- Tinker, J., Kravtsov, A. V., Klypin, A., et al. 2008, ApJ, 688, 709 [NASA ADS] [CrossRef] [Google Scholar]
- Tozzi, P., Rosati, P., Ettori, S., et al. 2003, ApJ, 593, 705 [NASA ADS] [CrossRef] [Google Scholar]
- Tozzi, P., Santos, J., Yu, H., et al. 2011, Mem. Soc. Astron. It. Suppl., 17, 24 [Google Scholar]
- Tundo, E., Moretti, A., Tozzi, P., et al. 2012, A&A, 547, A57 [NASA ADS] [CrossRef] [EDP Sciences] [Google Scholar]
- Vikhlinin, A., Kravtsov, A. V., Burenin, R. A., et al. 2009, ApJ, 692, 1060 [NASA ADS] [CrossRef] [Google Scholar]
- Waizmann, J.-C., Ettori, S., & Moscardini, L. 2012, MNRAS, 422, 3554 [NASA ADS] [CrossRef] [Google Scholar]
- Yu, H., Tozzi, P., Borgani, S., Rosati, P., & Zhu, Z.-H. 2011, A&A, 529, A65 [NASA ADS] [CrossRef] [EDP Sciences] [Google Scholar]
- Zeimann, G. R., Stanford, S. A., Brodwin, M., et al. 2012, ApJ, 756, 115 [NASA ADS] [CrossRef] [EDP Sciences] [Google Scholar]
All Tables
All Figures
|
Fig. 1 ACIS-S+I image of the clusters field, smoothed with a 3″ Gaussian kernel. The bright cluster WARPJ1415 at z = 1 is visible in the upper right, whereas CXO1415 lies at ~2′ in the south-west direction. The solid circles have a radius of 35″ (corresponding to 300 kpc at z = 1.46), whereas the dashed circle with r = 24″ refers to the aperture of maximum S/N used for the spectral analysis. The image has a size of 4′ × 4′. |
| In the text | |
|
Fig. 2 Cstat as a function of redshift parameter for the combined (ACIS-S+ACIS-I) spectral analysis of CXO1415. The minimum is obtained for z = 1.46, when ΔCstat ~ 8. The cyan stripe shows the 1σ confidence interval obtained from the photo-z (zphot = 1.52 ± 0.06, see Sect. 3.2). |
| In the text | |
|
Fig. 3 Folded Chandra ACIS-S spectrum of CXO1415 with its best-fit mekal model (solid line). The iron Kα line complex is detected at the 99.5% confidence level at 2.8 keV in the observed reference frame. |
| In the text | |
|
Fig. 4 Left: background-subtracted surface brightness profile in the soft (0.5−2 keV) band (points) and best-fit β model (red dashed line) for CXO1415. Error bars correspond to 1σ uncertainty. Right: 1-2-3σ confidence levels for two relevant parameters in the β − rc parameter space. |
| In the text | |
|
Fig. 5 Field color image (Suprime-Cam BRZ filters) of WARPJ1415 (top right) and CXO1415 (bottom left) with soft X-ray contours overlaid in green. The image is 3.5 arcmin horizontally across. |
| In the text | |
|
Fig. 6 Left: (z − 3.6 μm) color−magnitude relation of CXO1415. Only objects within 1′ distance from the X-ray center are shown (black circles). The 21 red cluster candidates (red circles) are selected on the basis of the color cut 5 < z − 3.6 μm < 6.5. For comparison we also plot 19 confirmed members of WARPJ1415 at z = 1 (blue triangles). The magenta star indicates the galaxy coincident with the X-ray peak. Right: selection of red, high-z cluster galaxy candidates (white circles), with X-ray contours displayed in green. The brightest candidate is marked by a yellow circle. |
| In the text | |
|
Fig. 7 Histogram of photometric redshifts computed in the cluster field. We show the photometric redshift distribution of 17 spectroscopic members of WARPJ1415 at z = 1.03 (blue dashed line) and the photometric redshift distribution of 13 candidate members selected from the red sequence of CXO1415 (red solid line). The thinner histogram (solid blue line) marks the spectroscopic redshift distribution of WARPJ1415, while the cyan stripe corresponds to the X-ray redshift zX = 1.46 ± 0.025. |
| In the text | |
|
Fig. 8 Chandra images of four high-redshift massive clusters observed with deep Chandra observations. The four clusters are all re-imaged at the same redshift of CXO1415 (z = 1.46) and their observations rescaled to a 100 ks ACIS-S observation (including CXO1415) in order to offer an immediate comparison. Top left: CXO1415; top right: WARPJ1415; bottom left: XMM2235; bottom right: RXJ1252. Images are smoothed with a 1 arcsec Gaussian kernel and cover 3 × 3 arcmin. |
| In the text | |
|
Fig. 9 Radial profiles from the four clusters re-imaged at z = 1.5 shown in Fig. 8: WARPS1415 (solid black line); XMMUJ2235 (dashed magenta line); RXJ1252 (dotted green line); CXO1415 (long-dashed red line). |
| In the text | |
Current usage metrics show cumulative count of Article Views (full-text article views including HTML views, PDF and ePub downloads, according to the available data) and Abstracts Views on Vision4Press platform.
Data correspond to usage on the plateform after 2015. The current usage metrics is available 48-96 hours after online publication and is updated daily on week days.
Initial download of the metrics may take a while.