Fig. 7
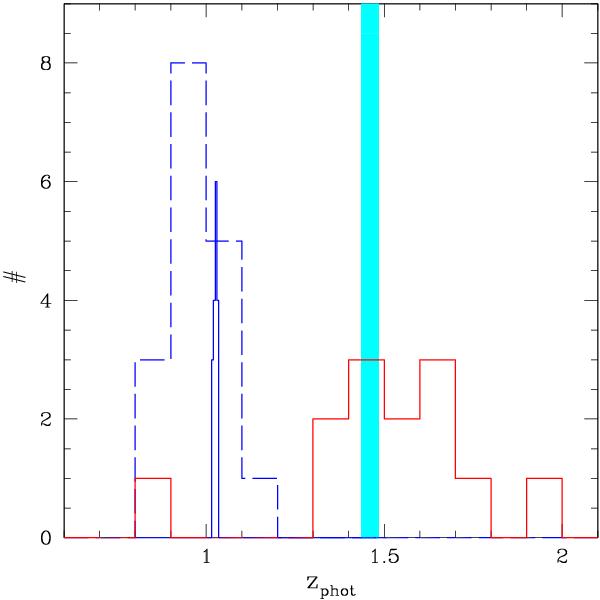
Histogram of photometric redshifts computed in the cluster field. We show the photometric redshift distribution of 17 spectroscopic members of WARPJ1415 at z = 1.03 (blue dashed line) and the photometric redshift distribution of 13 candidate members selected from the red sequence of CXO1415 (red solid line). The thinner histogram (solid blue line) marks the spectroscopic redshift distribution of WARPJ1415, while the cyan stripe corresponds to the X-ray redshift zX = 1.46 ± 0.025.
Current usage metrics show cumulative count of Article Views (full-text article views including HTML views, PDF and ePub downloads, according to the available data) and Abstracts Views on Vision4Press platform.
Data correspond to usage on the plateform after 2015. The current usage metrics is available 48-96 hours after online publication and is updated daily on week days.
Initial download of the metrics may take a while.