| Issue |
A&A
Volume 551, March 2013
|
|
|---|---|---|
| Article Number | A23 | |
| Number of page(s) | 5 | |
| Section | Cosmology (including clusters of galaxies) | |
| DOI | https://doi.org/10.1051/0004-6361/201220403 | |
| Published online | 13 February 2013 | |
The X-ray/SZ view of the virial region
II. Gas mass fraction
1 Astronomical Observatory of the University of Geneva, ch. d’Ecogia 16, 1290 Versoix, Switzerland
e-mail: This email address is being protected from spambots. You need JavaScript enabled to view it.
2 INAF – Osservatorio Astronomico di Bologna, via Ranzani 1, 40127 Bologna, Italy
3 INFN, Sezione di Bologna, viale Berti Pichat 6/2, 40127 Bologna, Italy
4 INAF – IASF-Milano, Via E. Bassini 15, 20133 Milano, Italy
5 Hamburg Observatory, Gojansbergsweg 112, 21029 Hamburg, Germany
Received: 18 September 2012
Accepted: 12 December 2012
Abstract
Aims. Several recent studies used the hot gas fraction of galaxy clusters as a standard ruler to constrain dark energy, which provides competitive results compared to other techniques. This method, however, relies on the assumption that the baryon fraction in clusters agrees with the cosmic value Ωb/Ωm, and does not differ from one system to another. We test this hypothesis by measuring the gas mass fraction over the entire cluster volume in a sample of local clusters.
Methods. Combining the Sunyaev-Zel’dovich thermal pressure from Planck and the X-ray gas density from ROSAT, we measured for the first time the average gas fraction (fgas) out to the virial radius and beyond in a large sample of clusters. We also obtained azimuthally-averaged measurements of the gas fraction for 18 individual systems, which we used to compute the scatter of fgas around the mean value at different radii and its dependence on the cluster’s temperature.
Results. The gas mass fraction increases with radius and reaches the cosmic baryon fraction close to R200. At R200, we measure fgas,200 = 0.176 ± 0.009 (0.166 ± 0.012 for the subsample of 18 clusters in common between Planck and ROSAT). We find significant differences between the baryon fraction of relaxed, cool-core (CC) systems and unrelaxed, non-cool core (NCC) clusters in the outer regions. On average, the gas fraction in NCC clusters slightly exceeds the cosmic baryon fraction, while in CC systems the gas fraction converges to the expected value when accounting for the stellar content, without any evidence for variations from one system to another.
Conclusions. We find that fgas estimates in NCC systems slightly disagree with the cosmic value approaching R200. This result could be explained either by a violation of the assumption of hydrostatic equilibrium or by an inhomogeneous distribution of the gas mass. Conversely, CC clusters are found to provide reliable constraints on fgas at overdensities Δ > 200, which makes them suitable for cosmological studies.
Key words: X-rays: galaxies: clusters / galaxies: clusters: general / galaxies: clusters: intracluster medium / cosmology: observations
© ESO, 2013
1. Introduction
The outskirts of galaxy clusters are the regions where the current activity of structure formation is taking place through the accretion of smaller structures onto massive clusters. In addition, they are the regions where the transition between virialized gas from clusters and accreting material from the large-scale structure occurs. Non-gravitational effects such as turbulence (e.g., Dolag et al. 2005; Vazza et al. 2011a) and cosmic rays (e.g., Vazza et al. 2012; Pfrommer et al. 2007) are expected to play a more important role in these regions than in cluster cores, and the infall of smaller structures along large-scale filaments may cause the material in these regions to be clumpy (Nagai & Lau 2011; Simionescu et al. 2011) and asymmetric (Vazza et al. 2011b; Eckert et al. 2012). These effects may bias the measurements of cluster masses using X-ray and Sunyaev-Zel’dovich (SZ) proxies (Rasia et al. 2004; Nagai et al. 2007b; Piffaretti & Valdarnini 2008), thus setting limitations on the use of galaxy clusters as high-precision cosmological probes (Allen et al. 2011).
Baryons in galaxy clusters, mainly in the form of hot X-ray emitting plasma with some contribution from stars in member galaxies, are subjected to gravitational and radiative processes that, in a cold dark matter (CDM) scenario, affect their distribution in the DM halo accordingly. By forming in the highest peaks of the primordial gravitational fluctuations, massive galaxy clusters are relatively well-isolated gravity-dominated structures, suggesting that their mass function and relative baryon budget are highly sensitive tests of the geometry and matter content of the Universe. In particular, estimates of the gas and total mass content of relaxed hot clusters in hydrostatic equilibrium can be obtained using X-ray observations, allowing one both to place a lower limit on the cluster baryon mass fraction, which is expected to match the cosmic value Ωb/Ωm (e.g., White et al. 1993), and to constrain the cosmic dark energy by imposing the gas mass fraction as standard ruler (see e.g. Ettori et al. 2003, 2009; Allen et al. 2008).
In this paper, we combine the SZ pressure profiles from the sample of 62 galaxy clusters observed with the Planck satellite (Planck Collaboration 2013, hereafter P13) with the ROSAT gas density profiles presented in Eckert et al. (2012, hereafter E12) to reconstruct gravitating mass profiles assuming hydrostatic equilibrium. This allows us to provide the first measurements of the gas fraction in cluster outskirts on relatively large samples, probing a volume several times larger than the typical XMM and Chandra limits and the entire azimuth (as opposed to most of the Suzaku results). We study the importance of additional effects (non-thermal pressure support, gas clumping, asymmetry) on the quantities recovered by assuming that the gas is in hydrostatic equilibrium. Similar results are also presented for a subset of 18 individual clusters (6 CC and 12 NCC) that are in common between the samples of P13 and E12. In a companion paper (Eckert et al. 2013, hereafter Paper I), we demonstrate the validity of the method and apply it to infer the average thermodynamic properties of galaxy clusters.
Throughout the paper, we assume a ΛCDM cosmology with Ωm = 0.3, ΩΛ = 0.7, and H0 = 70 km s-1 Mpc-1. We also refer to the best-fit results on the ΛCDM model provided from WMAP-7 years (see e.g. Table 8 in Jarosik et al. 2011), which imply a cosmic baryon fraction Ωb/Ωm = 0.167 ± 0.011. Because our cluster sample is located at redshift below 0.2, the differences between these cosmological models affect the estimates of the gas mass fraction presented in this work by less than 1 per cent, through the variation of the angular diameter distance.
2. Basic formalism
For this work, the two main observables are the pressure from SZ measurements and the gas number density from X-ray observations. In this case, the hydrostatic mass is simply given by  (1)where μ = 0.6 is the mean molecular weight, while the gas mass profiles can be computed directly by integrating the density profiles,
  (2)An estimate of fgas(r) = Mgas( < r)/Mhyd( < r) can thus be obtained in a straightforward way. To describe the pressure and the gas density, we fit the data points using general parametric functions (see Paper I for details). Following P13, the pressure is described by a generalized Navarro-Frenk-White profile (GNFW, Navarro et al. 1997; Nagai et al. 2007a). The pressure gradient can be expressed analytically by differentiating the GNFW profile. The pressure profiles are taken from P13, for the average population as well as for the 18 individual clusters in common between the two samples.
For the density, we used a simplified version of the functional form introduced by Vikhlinin et al. (2006). This functional form was projected along the line-of-sight and fit to the ROSAT emission-measure profiles. The error budget was estimated through a Monte-Carlo Markov chain (MCMC) method, which allows us to compute the envelopes of the curves derived from the fitting procedure. Alternatively, we also used deprojected density profiles as computed in E12, and interpolated them along a common grid through a cubic spline method. For more details and a thorough validation of the method, we refer the reader to Paper I, also for the details of the error calculation. In Fig. 1 we show the gas fraction profiles derived for the 18 individual systems and the average pressure and density profiles. Since we focus our work on the outer regions, the MCMC procedure was performed only on the data beyond 0.2 R500, which causes the bumps at low radii. Beyond 0.5 R500, the most strongly deviating profile is that of A2163, a violently merging cluster that is likely out of hydrostatic equilibrium (see Appendix C of Paper I for a discussion of this system).
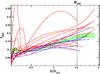 |
Fig. 1 Observed gas mass fraction profiles for CC (blue) and NCC (red) clusters. All profiles stop at the maximum detection radius (2σ above the background) in ROSAT/PSPC. The green-shaded region shows the fgas profile from the average gas density and Planck pressure profiles. The most strongly deviating profile is that of A2163. |
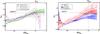 |
Fig. 2 (Left) Average gas fraction profile computed from the sample-average pressure and density profiles and from the subsample of 18 individual objects. We show the profiles obtained through parametric forward fitting with MCMC error envelopes for both cases (sample average, green shaded area; median of 18 objects, black circles), and by interpolating the deprojected density profiles (sample average, red triangles; median of 18 objects, blue circles). The error bars are given at the 1σ level. (Right) Average gas fraction profiles for the CC (blue) and NCC (red) populations separately. The shaded areas represent the profiles obtained from the sample-averaged profiles, while the data points show the median of the 18 individual systems. |
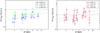 |
Fig. 3 Distribution of the gas mass fraction estimates normalized to the cosmic baryon fraction (Jarosik et al. 2011) as a function of the cluster’s temperature (from E12) and core state at different overdensities. The error bars are given at the 1σ level. The dashed lines show the best fit to the entire sample using Eq. (3). For better readability, A2163 (kT ~ 18 keV) is not shown in the plots. |
3. Results
For a fiducial cluster with a virial temperature kT = 5 keV, we used the universal pressure profiles from P13 together with the median gas density profiles from E12 to extract gas fraction profiles using the hydrostatic equilibrium equation (Eq. (1)). Unlike the gas fraction profiles presented in Sect. 7.3 of P13, no extrapolation is needed to compute the gas fraction. In Fig. 2, we show the average gas fraction profile obtained by combining the average profiles from P13 and E12, computed through the parametric forward-fitting method (green-shaded area) and the geometrical deprojection method (red points). Excellent agreement is found between the results obtained between the two methods, and hence the results presented here are stable against the assumed deprojection technique. The profiles obtained from the sample-averaged profiles are also compared to the median of the 18 individual objects for both deprojection methods. The uncertainties in the median were estimated using 1000 bootstrap reshufflings of the sample (see Paper I). Below 1.7 R5001, all methods show a remarkable level of agreement, demonstrating the reliability of the measurements. In the following and for the sake of simplicity we focus on the results obtained with the parametric form, as in Paper I. However, we stress that the geometrical deprojection method always leads to consistent results.
At R500, we find fgas,500 = 0.132 ± 0.005, which agrees well with previous estimates from Chandra (e.g., Vikhlinin et al. 2006) and XMM-Newton (e.g., Ettori et al. 2010). The measured gas fraction reaches the cosmic baryon fraction (Ωb/Ωm = 0.167, Jarosik et al. 2011) at R = 1.4 R500 and slightly exceeds it beyond this radius, although it remains consistent within the error bars. At R200, we measure 0.176 ± 0.009 (0.160 ± 0.019 in the subsample of 18 objects) with the forward-fitting method, 0.158 ± 0.019 (0.160 ± 0.028) with the deprojection technique. Given that the stellar mass contributes another 10 − 20% of the baryon fraction (e.g., Gonzalez et al. 2007; Laganá et al. 2011), the gas fraction recovered assuming hydrostatic equilibrium exceeds the expected value in cluster outskirts at the 2σ level. Although the confidence level is low, this may indicate that either the mass recovered through hydrostatic equilibrium is biased low, as suggested from present hydrodynamical numerical simulations (e.g., Rasia et al. 2006, 2012; Nelson et al. 2012; Burns et al. 2010), or that inhomogeneities in the gas distribution bias high the estimated Mgas (Nagai & Lau 2011; Simionescu et al. 2011), or a combination of the two effects.
Mean fgas values and intrinsic scatter σf (in percent) obtained from various datasets and at different overdensity radii.
Similar to the entropy (see Paper I), we observe differences in the gas fraction profiles computed for the 6 CC and 12 NCC clusters independently (see Fig. 2). The NCC profiles tend to increase more steeply in cluster outskirts compared to CC profiles. From the sample-averaged profiles, at R200 NCC clusters slightly exceed the cosmic baryon fraction (fgas,NCC = 0.169 ± 0.010 using the average profiles; 0.178 ± 0.016 for the 12 individual NCC systems), while the gas fraction in CC systems is close to the expected gas fraction around R200 (fgas,CC = 0.134 ± 0.011; 0.143 ± 0.015 for the subsample of 6 CC objects). Despite its low statistical significance (less than 2σ), this result likely indicates that hydrostatic equilibrium breaks down in the outskirts of NCC systems, while in CC (relaxed) clusters the behavior is closer to self-similar expectations, in agreement with our results for the entropy (see Paper I).
In all cases, we can see that the enclosed gas fraction increases steadily with radius and gas temperature, as expected from previous work (see e.g., Arnaud & Evrard 1999; Ettori & Fabian 1999; Vikhlinin et al. 2006). To quantify the dependence on the gas temperature at different mass overdensities (200, 500, 1000, and 2500, see Fig. 3), we fit a multi-linear function of the form  (3)where bgas = fgas/fb,WMAP7 is the depletion factor. The best-fitting values for the parameters are provided in Table 2. Only the normalization b500 is found to change significantly between the CC and NCC populations, in agreement with Fig. 2. The quality of the fit, however, is found to change significantly when comparing the CC and NCC populations, with only the fit to CC objects being formally acceptable. This indicates a significant cluster-to-cluster scatter in the latter population.
4. Discussion
We discuss here two important implications of our results on (i) the use of gas mass fraction as cosmological probe and (ii) the comparison with predictions from hydrodynamically simulated objects.
4.1. Implications on the use of clusters for cosmology
The use of fgas as a standard ruler for cosmology (Ettori et al. 2003; Allen et al. 2008) implies that galaxy clusters are representative of the cosmic baryonic budget. In the previous section, we quantified how the gas mass fraction depends on the gas temperature and matter overdensity, providing for the first time an observationally constrained calibration of the cluster baryon budget in the hot X-ray emitting phase. We assess here the cluster-to-cluster scatter of fgas at different overdensity radii. To compute the intrinsic scatter of a given population, we used a maximum-likelihood estimator as introduced by Maccacaro et al. (1988, see also Appendix A of E12). This method allows the mean value and the intrinsic scatter to be computed jointly. In Table 1 we give the mean fgas values and the intrinsic scatter σf at overdensities of 2500, 1000, 500, and 200, for the entire population as well as for the CC and NCC clusters separately. We also report the scatter obtained when correcting the fgas values for their dependence on the cluster’s virial temperature, i.e., by rescaling each value by the quantity (Tvir/7 keV)β (see Eq. (3) and Table 2).
In Table 1, we can see that the level of scatter increases with radius, from ~15% of the measured value at R2500 to ~25% at R200. As expected, when a temperature scaling is performed, a lower scatter is measured in all cases. Interestingly, we note that the level of scatter is substantially higher for the NCC population than for the more relaxed, CC objects. When performing a temperature scaling, the level of intrinsic scatter is even consistent with 0 in CC systems out to R500, while at R200 some scatter at the level of ~18% is measured, indicating that at the outermost radii even the most relaxed systems are affected by non-gravitational physics and/or inhomogeneous gas distributions (see E12). In the case of NCC systems, substantial cluster-to-cluster variations are found at all radii.
We remark that the trend of increasing scatter with radius is opposite to what we would expect when probing a larger volume, which shows that the the trend is likely caused by a physical effect. Both non-gravitational effects (turbulence, cosmic rays) and inhomogeneous gas densities can qualitatively explain this result. Indeed, numerical simulations show that non-thermal effects can be several times stronger in NCC systems (e.g., Lau et al. 2009; Pfrommer et al. 2007; Vazza et al. 2011a, 2012). Gas clumping and large-scale asymmetries are also expected to be more prominent along large-scale filaments (Nagai & Lau 2011; Vazza et al. 2013), and thus the effect should be stronger in merging systems. For instance, if clumping biases the observed density high by ~20%, as found in Paper I for NCC clusters, the actual gas fraction for this class of objects would be consistent with the expected hot gas fraction. For a more detailed discussion of the implications of our results on the physics of cluster outskirts, we refer the reader to Paper I.
To summarize, our findings (both on the global baryon budget and the variations in fgas from one system to another) demonstrate that the gas fraction of CC systems can be used efficiently as a standard ruler, while in NCC systems non-gravitational effects and/or inhomogeneities in the gas distribution introduce significant systematics in the computation of the gas fraction. A very similar conclusion was recently obtained by Mahdavi et al. (2012) by comparing X-ray and weak-lensing mass estimates. Indeed, X-ray mass estimates appear to be underestimated by ~15% in NCC clusters, while good agreement is found for CC systems. The fact that a qualitatively similar result was obtained using different samples and techniques thus reinforces our conclusion.
4.2. Comparison with numerical simulations
Using the shock-capturing Eulerian adaptive mesh refinement N-body + gas-dynamical adaptive refinement tree code, Kravtsov et al. (2005) measured in the most massive system of M200 ≈ 9.6 × 10¹⁴ M⊙ a value of bgas that rises from 0.86 (at Δ = 2500) to 1.04 (at the virial radius) in the run without dissipation and from 0.56 to 0.76 when radiative cooling, star formation, metal enrichment, and stellar feedback are considered. The constraints we obtain lie between these predictions, suggesting that both radiative processes are required and the feedback provided has to be less incisive in its action on distributing the intracluster medium (ICM).
In a set of hydrodynamical simulations of massive galaxy clusters performed using the Tree+SPH code GADGET-2, Ettori et al. (2006; see also De Boni et al. 2011) estimated, at z = 0 a bgas that increases from 0.82 to 0.89 from Δ = 2500 to 200 in runs with gravitational heating only. On the other extreme, introducing cooling and star formation but no winds drastically reduces the expected relative gas fraction (0.29 at Δ = 2500; 0.59 at Δ = 200). Overall, however, none of the feedback models explored in that work are able to reproduce the high bgas value of 0.74−0.9 we observe at Δ < 500, apart from the case where the alternative artificial low-viscosity scheme from Morris & Monaghan (1997) is considered, allowing about 30 per cent of the ICM thermal energy in the form of turbulent motion.
For massive halos extracted from a non-radiative gas-dynamical realization of the Millennium Simulations, Crain et al. (2007) measured bbar of about 0.9 (and rms of 6 percent) with almost no dependence on the radius between R500 and R200, implying a relative contribution from stars, with respect to the gas component, of 0.22 and 0.19 at the two radii, respectively, slightly higher than the present observational constraints (e.g., <0.17 for M500 > 3 × 10¹⁴ M⊙ in Laganá et al. 2011). In the Millennium Gas Project, Young et al. (2011) studied the baryon distribution in 170 objects, as SPH re-simulation of the Millennium simulation, with gas temperature higher than 3 keV. They considered models where the ICM is heated (i) solely by gravitational process; (ii) by pre-heating in the order of 200 keV cm2 occuring at z = 4 combined with cooling; (iii) by feedback from supernovae (SNe) and active galactic nuclei (AGN) as expected from the semi-analytic predictions on galaxy formation but not including radiative cooling. For the most massive systems, they measured bgas in the range 0.88−0.91, 0.57−0.83, 0.70–0.82 between Δ = 2500 and 200 for cases (i), (ii), (iii), respectively, suggesting that (a) some cooling is needed to lower the gas fraction predicted in the inner part and (b) the implemented action of either pre-heating or feedback from SNe and AGN is probably too strong to fully explain the observed gas fraction in the clusters’ outskirts.
5. Conclusion
Combining X-ray (ROSAT/PSPC) and SZ (Planck) data, we analyzed the properties of the ICM at large radii using both sample-averaged profiles and the data for 18 individual systems. This allowed us to measure for the first time hydrostatic mass and gas fraction profiles out to the virial radius in a relatively large sample of objects. The results on the thermodynamic properties of galaxy clusters close to the virial radius are presented in a companion paper. Our results can be summarized as follows:
-
The gas fraction reconstructed through the hydrostatic equilibrium equation increases with radius and reaches the value of fgas,200 = 0.176 ± 0.009 around R200. Different input data and deprojection techniques yield results that excellently agree. This value is consistent with the cosmic baryon fraction Ωb/Ωm = 0.167 (Jarosik et al. 2011). Given that the stellar content is expected to account for 10 − 20% of the baryons in galaxy clusters, the measured gas fraction slightly exceeds the expected value. A 15% bias either in raising the hydrostatic masses, as expected from numerical simulations, or in lowering the gas mass allows us to reconcile our measurement with the expected gas fraction.
-
We observe differences between the gas fraction measured in relaxed, CC systems compared to dynamically active, NCC systems. In NCC clusters, the gas fraction exceeds the cosmic baryon fraction significantly, indicating that hydrostatic equilibrium breaks down in the outer regions of perturbed systems, and/or that the gas is distributed in an inhomogeneous way. Conversely, in CC systems the gas fraction converges to the expected hot gas fraction, confirming that they correspond to more relaxed systems, which can be used more efficiently for cosmological purposes.
-
From the 18 objects comprising our sample, we measured the scatter around the average fgas value using a maximum-likelihood estimator. We find that the scatter increases with radius, from 15% at R2500 to 25% at R200. In contrast to NCC systems, in which we measure substantial cluster-to-cluster variations at all radii, CC systems exhibit a negligible level of scatter out to R500, confirming that they are better suited for cosmological studies.
-
We quantified the fgas dependence upon gas temperature and matter overdensity with the relation
 and measured b500 = 0.76 ± 0.02 in CC systems and 0.92 ± 0.02 in NCC clusters, α = −0.2 and β = 0.5. The gas bias (or depletion) factor b500, and its variation with temperature and radii, disagrees with the results obtained for clusters extracted from recent hydrodynamical simulations, implying that the action of cooling and AGN and/or SN feedback is indeed needed but has to be regulated differently from what has been used so far.
For a given overdensity Δ, RΔ is the radius for which  .
.
References
- Allen, S. W., Rapetti, D. A., Schmidt, R. W., et al. 2008, MNRAS, 383, 879 [NASA ADS] [CrossRef] [Google Scholar]
- Allen, S. W., Evrard, A. E., & Mantz, A. B. 2011, ARA&A, 49, 409 [NASA ADS] [CrossRef] [Google Scholar]
- Arnaud, M., & Evrard, A. E. 1999, MNRAS, 305, 631 [NASA ADS] [CrossRef] [Google Scholar]
- Burns, J. O., Skillman, S. W., & O’Shea, B. W. 2010, ApJ, 721, 1105 [Google Scholar]
- Crain, R. A., Eke, V. R., Frenk, C. S., et al. 2007, MNRAS, 377, 41 [NASA ADS] [CrossRef] [Google Scholar]
- De Boni, C., Dolag, K., Ettori, S., et al. 2011, MNRAS, 415, 2758 [NASA ADS] [CrossRef] [Google Scholar]
- Dolag, K., Vazza, F., Brunetti, G., & Tormen, G. 2005, MNRAS, 364, 753 [NASA ADS] [CrossRef] [Google Scholar]
- Ettori, S., & Fabian, A. C. 1999, MNRAS, 305, 834 [NASA ADS] [CrossRef] [Google Scholar]
- Ettori, S., Tozzi, P., & Rosati, P. 2003, A&A, 398, 879 [NASA ADS] [CrossRef] [EDP Sciences] [Google Scholar]
- Ettori, S., Dolag, K., Borgani, S., & Murante, G. 2006, MNRAS, 365, 1021 [NASA ADS] [CrossRef] [Google Scholar]
- Ettori, S., Morandi, A., Tozzi, P., et al. 2009, A&A, 501, 61 [NASA ADS] [CrossRef] [EDP Sciences] [Google Scholar]
- Ettori, S., Gastaldello, F., Leccardi, A., et al. 2010, A&A, 524, A68 [NASA ADS] [CrossRef] [EDP Sciences] [Google Scholar]
- Eckert, D., Vazza, F., Ettori, S., et al. 2012, A&A, 541, A57 [NASA ADS] [CrossRef] [EDP Sciences] [Google Scholar]
- Eckert, D., Molendi, S., Vazza, F., Ettori, S., Paltani, S. 2013, A&A, 551, A22 [NASA ADS] [CrossRef] [EDP Sciences] [Google Scholar]
- Gonzalez, A. H., Zaritsky, D., & Zabludoff, A. I. 2007, ApJ, 666, 147 [NASA ADS] [CrossRef] [Google Scholar]
- Jarosik, N., Bennett, C. L., Dunkley, J., et al. 2011, ApJS, 192, 14 [NASA ADS] [CrossRef] [Google Scholar]
- Kravtsov, A. V., Nagai, D., & Vikhlinin, A. A. 2005, ApJ, 625, 588 [NASA ADS] [CrossRef] [Google Scholar]
- Laganá, T. F., Zhang, Y.-Y., Reiprich, T. H., & Schneider, P. 2011, ApJ, 743, 13 [NASA ADS] [CrossRef] [Google Scholar]
- Lau, E. T., Kravtsov, A. V., & Nagai, D. 2009, ApJ, 705, 1129 [NASA ADS] [CrossRef] [Google Scholar]
- Maccacaro, T., Gioia, I. M., Wolter, A., Zamorani, G., & Stocke, J. T. 1988, ApJ, 326, 680 [NASA ADS] [CrossRef] [Google Scholar]
- Mahdavi, A., Hoekstra, H., Babul, A., et al. 2012, ApJ, submitted [arXiv:1210.3689] [Google Scholar]
- Morris, J. P., & Monaghan, J. J. 1997, J. Comput. Phys., 136, 41 [NASA ADS] [CrossRef] [MathSciNet] [Google Scholar]
- Nagai, D., & Lau, E. T. 2011, ApJ, 731, L10 [NASA ADS] [CrossRef] [Google Scholar]
- Nagai, D., Kravtsov, A. V., & Vikhlinin, A. 2007a, ApJ, 668, 1 [NASA ADS] [CrossRef] [Google Scholar]
- Nagai, D., Vikhlinin, A., & Kravtsov, A. V. 2007b, ApJ, 655, 98 [NASA ADS] [CrossRef] [Google Scholar]
- Navarro, J. F., Frenk, C. S., & White, S. D. M. 1997, ApJ, 490, 493 [NASA ADS] [CrossRef] [Google Scholar]
- Nelson, K., Rudd, D. H., Shaw, L., & Nagai, D. 2012, ApJ, 751, 121 [NASA ADS] [CrossRef] [Google Scholar]
- Pfrommer, C., Enßlin, T. A., Springel, V., Jubelgas, M., & Dolag, K. 2007, MNRAS, 378, 385 [NASA ADS] [CrossRef] [Google Scholar]
- Piffaretti, R., & Valdarnini, R. 2008, A&A, 491, 71 [NASA ADS] [CrossRef] [EDP Sciences] [Google Scholar]
- Planck Collaboration 2013, A&A, 550, A131 [NASA ADS] [CrossRef] [EDP Sciences] [Google Scholar]
- Rasia, E., Tormen, G., & Moscardini, L. 2004, MNRAS, 351, 237 [NASA ADS] [CrossRef] [Google Scholar]
- Rasia, E., Ettori, S., Moscardini, L., et al. 2006, MNRAS, 369, 2013 [NASA ADS] [CrossRef] [Google Scholar]
- Rasia, E., Meneghetti, M., Martino, R., et al. 2012, New J. Phys., 14, 055018 [NASA ADS] [CrossRef] [Google Scholar]
- Simionescu, A., Allen, S. W., Mantz, A., et al. 2011, Science, 331, 1576 [NASA ADS] [CrossRef] [Google Scholar]
- Vazza, F., Brunetti, G., Gheller, C., Brunino, R., & Brüggen, M. 2011a, A&A, 529, A17 [NASA ADS] [CrossRef] [EDP Sciences] [Google Scholar]
- Vazza, F., Roncarelli, M., Ettori, S., & Dolag, K. 2011b, MNRAS, 413, 2305 [NASA ADS] [CrossRef] [Google Scholar]
- Vazza, F., Brüggen, M., Gheller, C., & Brunetti, G. 2012, MNRAS, 421, 3375 [NASA ADS] [CrossRef] [Google Scholar]
- Vazza, F., Eckert, D., Simionescu, A., Brüggen, M., & Ettori, S. 2013, MNRAS, 429, 799 [NASA ADS] [CrossRef] [Google Scholar]
- Vikhlinin, A., Kravtsov, A., Forman, W., et al. 2006, ApJ, 640, 691 [NASA ADS] [CrossRef] [Google Scholar]
- White, S. D. M., Navarro, J. F., Evrard, A. E., & Frenk, C. S. 1993, Nature, 366, 429 [NASA ADS] [CrossRef] [Google Scholar]
- Young, O. E., Thomas, P. A., Short, C. J., & Pearce, F. 2011, MNRAS, 413, 691 [NASA ADS] [CrossRef] [Google Scholar]
All Tables
Mean fgas values and intrinsic scatter σf (in percent) obtained from various datasets and at different overdensity radii.
All Figures
|
Fig. 1 Observed gas mass fraction profiles for CC (blue) and NCC (red) clusters. All profiles stop at the maximum detection radius (2σ above the background) in ROSAT/PSPC. The green-shaded region shows the fgas profile from the average gas density and Planck pressure profiles. The most strongly deviating profile is that of A2163. |
| In the text | |
|
Fig. 2 (Left) Average gas fraction profile computed from the sample-average pressure and density profiles and from the subsample of 18 individual objects. We show the profiles obtained through parametric forward fitting with MCMC error envelopes for both cases (sample average, green shaded area; median of 18 objects, black circles), and by interpolating the deprojected density profiles (sample average, red triangles; median of 18 objects, blue circles). The error bars are given at the 1σ level. (Right) Average gas fraction profiles for the CC (blue) and NCC (red) populations separately. The shaded areas represent the profiles obtained from the sample-averaged profiles, while the data points show the median of the 18 individual systems. |
| In the text | |
|
Fig. 3 Distribution of the gas mass fraction estimates normalized to the cosmic baryon fraction (Jarosik et al. 2011) as a function of the cluster’s temperature (from E12) and core state at different overdensities. The error bars are given at the 1σ level. The dashed lines show the best fit to the entire sample using Eq. (3). For better readability, A2163 (kT ~ 18 keV) is not shown in the plots. |
| In the text | |
Current usage metrics show cumulative count of Article Views (full-text article views including HTML views, PDF and ePub downloads, according to the available data) and Abstracts Views on Vision4Press platform.
Data correspond to usage on the plateform after 2015. The current usage metrics is available 48-96 hours after online publication and is updated daily on week days.
Initial download of the metrics may take a while.