Fig. 2
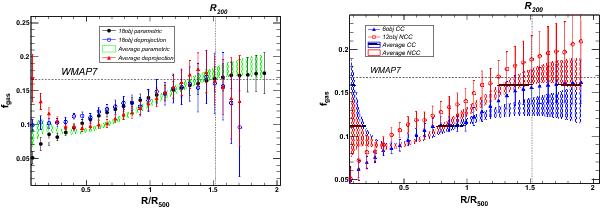
(Left) Average gas fraction profile computed from the sample-average pressure and density profiles and from the subsample of 18 individual objects. We show the profiles obtained through parametric forward fitting with MCMC error envelopes for both cases (sample average, green shaded area; median of 18 objects, black circles), and by interpolating the deprojected density profiles (sample average, red triangles; median of 18 objects, blue circles). The error bars are given at the 1σ level. (Right) Average gas fraction profiles for the CC (blue) and NCC (red) populations separately. The shaded areas represent the profiles obtained from the sample-averaged profiles, while the data points show the median of the 18 individual systems.
Current usage metrics show cumulative count of Article Views (full-text article views including HTML views, PDF and ePub downloads, according to the available data) and Abstracts Views on Vision4Press platform.
Data correspond to usage on the plateform after 2015. The current usage metrics is available 48-96 hours after online publication and is updated daily on week days.
Initial download of the metrics may take a while.