Free Access
Fig. 1
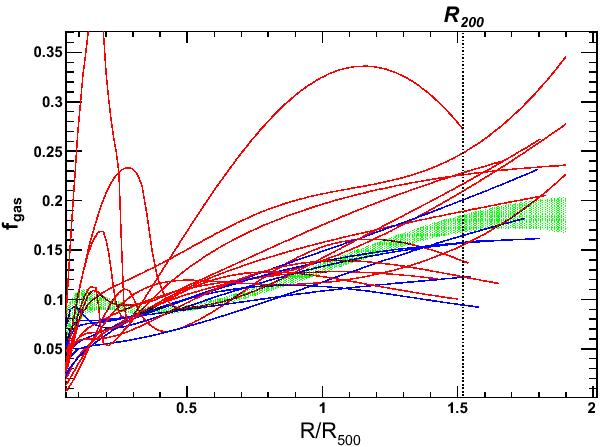
Observed gas mass fraction profiles for CC (blue) and NCC (red) clusters. All profiles stop at the maximum detection radius (2σ above the background) in ROSAT/PSPC. The green-shaded region shows the fgas profile from the average gas density and Planck pressure profiles. The most strongly deviating profile is that of A2163.
Current usage metrics show cumulative count of Article Views (full-text article views including HTML views, PDF and ePub downloads, according to the available data) and Abstracts Views on Vision4Press platform.
Data correspond to usage on the plateform after 2015. The current usage metrics is available 48-96 hours after online publication and is updated daily on week days.
Initial download of the metrics may take a while.