Fig. 3
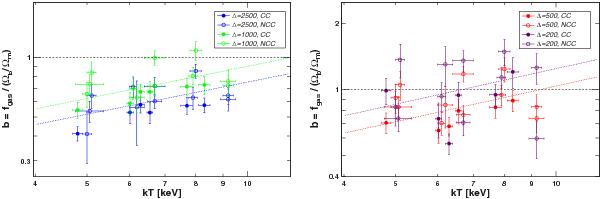
Distribution of the gas mass fraction estimates normalized to the cosmic baryon fraction (Jarosik et al. 2011) as a function of the cluster’s temperature (from E12) and core state at different overdensities. The error bars are given at the 1σ level. The dashed lines show the best fit to the entire sample using Eq. (3). For better readability, A2163 (kT ~ 18 keV) is not shown in the plots.
Current usage metrics show cumulative count of Article Views (full-text article views including HTML views, PDF and ePub downloads, according to the available data) and Abstracts Views on Vision4Press platform.
Data correspond to usage on the plateform after 2015. The current usage metrics is available 48-96 hours after online publication and is updated daily on week days.
Initial download of the metrics may take a while.