| Issue |
A&A
Volume 550, February 2013
|
|
|---|---|---|
| Article Number | A121 | |
| Number of page(s) | 11 | |
| Section | Stellar structure and evolution | |
| DOI | https://doi.org/10.1051/0004-6361/201220127 | |
| Published online | 05 February 2013 | |
γ Doradus pulsation in two pre-main sequence stars discovered by CoRoT⋆
1 University of Vienna, Institute of Astronomy, Türkenschanzstrasse 17, 1180 Vienna, Austria
e-mail: This email address is being protected from spambots. You need JavaScript enabled to view it.
2 Instituut voor Sterrenkunde, K. U. Leuven, Celestijnenlaan 200D, 3001 Leuven, Belgium
3 Argelander-Institut für Astronomie der Universität Bonn, Auf dem Hügel 71, 53121 Bonn, Germany
4 Institute of Astronomy, Russian Academy of Sciences, Pyatnitskaya 48, 119017 Moscow, Russia
5 Department of Astronomy and Physics, St. Marys University, Halifax, NS B3H 3C3, Canada
6 The University of Texas at Austin, McDonald Observatory, 82 Mt. Locke Rd., McDonald Observatory, Texas 79734, USA
7 LESIA, Observatoire de Paris-Meudon, 5 place Jules Janssen, 92195 Meudon, France
Received: 30 July 2012
Accepted: 17 December 2012
Abstract
Context. Pulsations in pre-main sequence stars have been discovered several times within the last years. But nearly all of these pulsators are of δ Scuti-type. γ Doradus-type pulsation in young stars has been predicted by theory, but lack observational evidence.
Aims. We present the investigation of variability caused by rotation and (γ Doradus-type) pulsation in two pre-main sequence members of the young open cluster NGC 2264 using high-precision time series photometry from the CoRoT satellite and dedicated high-resolution spectroscopy.
Methods. The variability found using the CoRoT data was combined with the fundamental parameters and chemical abundances derived from high-resolution spectroscopy, obtained at the Mc Donald Observatory, to discuss the presence of pulsation and rotation in the two NGC 2264 cluster members. Time series photometry of NGC 2264 VAS 20 and NGC 2264 VAS 87 was obtained by the CoRoT satellite during the dedicated short run SRa01 in March 2008. NGC 2264 VAS 87 was re-observed by CoRoT during the short run SRa05 in December 2011 and January 2012. Frequency analysis was conducted using Period04 and SigSpec. The spectral analysis was performed using equivalent widths and spectral synthesis.
Results. The frequency analysis yielded ten (NGC 2264 VAS 20) and fourteen (NGC 2264 VAS 87) intrinsic frequencies in the range from 0 to 1.5 d-1, which are attributed to be caused by a combination of rotation and pulsation. The effective temperatures were derived to be 6380 ± 150 K for NGC 2264 VAS 20 and 6220 ± 150 K for NGC 2264 VAS 87. Membership of the two stars to the cluster is confirmed independently using X-ray fluxes, radial velocity measurements, and proper motions available in the literature. The derived lithium abundances of log n(Li) = 3.34 and 3.54 for NGC 2264 VAS 20 and NGC 2264 VAS 87 agree with the lithium abundance for other stars in NGC 2264 of similar Teff reported in the literature.
Conclusions. We conclude that the two objects are members of NGC 2264 and therefore are in their pre-main sequence evolutionary stage. Their variability is attributed to be caused by rotation and g-mode pulsation rather than rotation only. Assuming that part of their variability is caused by pulsation, these two stars might be the first pre-main sequence γ Doradus candidates.
Key words: stars: pre-main sequence / stars: oscillations / stars: individual: NGC 2264 VAS 20 / techniques: photometric / techniques: spectroscopic / stars: individual: NGC 2264 VAS 87
The CoRoT space mission was developed and is operated by the French space agency CNES, with participation of ESA’s RSSD and Science Programmes, Austria, Belgium, Brazil, Germany, and Spain.
Pegasus Marie Curie post-doctoral fellow of the Research Foundation – Flanders.
© ESO, 2013
1. Introduction
Pre- and post-main sequence evolutionary tracks intersect close to the zero-age main sequence (ZAMS) and cross the instability regions of δ Scuti and γ Doradus stars. Stars of both evolutionary stages are therefore expected to show both types of pulsations. δ Scuti and γ Doradus pulsators are well-established among the hydrogen-core-burning (post-) main sequence stars (e.g., Rodriguez et al. 2000; Handler 1999). Pulsations in pre-main sequence (PMS) stars, which gain their energy mainly from gravitational contraction, have been reported several times within the last years (e.g., Ripepi et al. 2006; Zwintz et al. 2009), but the majority of these pulsators are of δ Scuti-type. PMS δ Scuti stars pulsate in p-modes and have spectral types from A to early F; their pulsation periods range from ~20 min to 6.5 h. However, recently a PMS δ Scuti-γ Doradus hybrid star, CoID0102699796, was found in data obtained with the CoRoT satellite (Ripepi et al. 2011).
The classical (post-) main sequence γ Doradus stars have spectral types from late A to F and are known to pulsate in high-order g-modes with periods ranging from approximately 0.3 to a few days (e.g., Kaye et al. 1999). The modulation of the radiative flux at the base of the convective envelope has been suggested to be the excitation mechanism for γ Doradus stars (e.g. Guzik et al. 2000; Dupret et al. 2005). Similar properties are expected for γ Doradus stars in their PMS evolutionary phase. Bouabid et al. (2011) determined the theoretical seismic properties of PMS γ Doradus pulsators, but no confirmed members of this group have been reported yet.
The search for γ Doradus pulsation in PMS stars is complicated by the likely presence of rotational modulation due to spots in these young objects. Candidates for PMS γ Doradus pulsation are located in the same region of the Hertzsprung Russell (HR) diagram as the hotter members of the group of T Tauri stars. The light curves of T Tauri stars are well-known to show regular and irregular variations caused by spots on the surface and the interaction of the stars with their circumstellar environment (e.g., Alencar et al. 2010). γ Doradus-type pulsation occurs on the same time scales as the variability caused by spots and surface inhomogeneities, i.e., with periods between about seven hours and a few days. It is therefore hard to unambiguously distinguish between the influence of rotation and pulsation in such stars (see, e.g., Uytterhoeven et al. 2010).
Because of their periods, they are also not easy to observe from the ground. Only with dedicated multi-site campaigns it is possible to resolve these frequencies, both spectroscopically and photometrically. The high-precision photometry obtained with the CoRoT satellite allowed us for the first time to study these stars in more detail.
In this study we present the analysis of CoRoT light curves and high-resolution spectroscopy for two PMS members of the young open cluster NGC 2264.
2. NGC 2264: VAS 20 and VAS 87
The young open cluster NGC 2264 (α2000 = 6h41m, δ2000 = +9°53′) has been studied frequently in all wavelength regimes in the past. It is located in the Monoceros OB1 association about 30 pc above the galactic plane and has a diameter of ~39 arcmin. Sung et al. (1997) reported a cluster distance of 759 ± 83 pc, which corresponds to a distance modulus of 9.40 ± 0.25 mag.
The age of NGC 2264 can only be determined with a relatively large error because its main sequence consists only of massive O and B stars and stars of later spectral types are still in their PMS phase. Additionally, not all cluster members might have formed at the same time and star formation is reported to still continue in the cluster (e.g., Flaccomio et al. 1999). Therefore different values for NGC 2264’s age are reported in the literature; they lie between 3 and 10 million years (e.g., Sung et al. 2004; Sagar et al. 1986). If stars are still being formed in NGC 2264, some of its members might even be only 0.15 million years old (Sung et al. 1997).
NGC 2264 is not significantly affected by reddening, and differential reddening is also negligible. The mean value of E(B − V) = 0.071 ± 0.033 mag reported by Sung et al. (1997) agrees well with values found by other authors (e.g., Walker 1956; Park et al. 2000).
The first ever discovered PMS pulsators, the two PMS δ Scuti stars V 588 Mon and V 589 Mon (Breger et al. 1972), are members of NGC 2264. Since then, several studies have been devoted to the search for, and analysis of, its pulsating members, e.g., using data from the MOST space telescope (Zwintz et al. 2009).
Using the high-precision time series photometry of all accessible stars in the field of NGC 2264 obtained with the CoRoT satellite, we conducted a homogeneous survey for pulsating candidates in the magnitude range between 10 and 16 mag in R. Cluster members showing variability on time scales between about 0.3 to a few days were the prime candidates in the search for PMS γ Doradus pulsation. Two of these are NGC 2264 VAS 20 (CoID0500007018) and NGC 2264 VAS 87 (CoID0223979759), named VAS 20 and VAS 87 hereafter. They are the subjects of this work.
VAS 20 (RA2000 = 06:40:05.66, DE2000 = +09:35:49.3) has a V magnitude of 11.248 mag (Sung et al. 1997) and a photometrically determined spectral type F5 (Young 1978). An X-ray flux was detected by ROSAT/HRI observations (Flaccomio et al. 2000), favoring the star’s youth. Additionally, Fűrész et al. (2006) listed the star as a cluster member according to its radial velocity. The membership probability is given as 94% by Vasilevskis et al. (1965). King (1998) reported an effective temperature (Teff) of 6219 ± 140 K using the B − V and V − I photometry of Sung et al. (1997) and the calibrations of Bessel (1979), and a lithium abundance log n(Li) = 3.56 derived from low-resolution spectroscopy.
VAS 87 (RA2000 = 06:40:56.95, DE2000 = +09:48:40.7) has a V magnitude of 12.323 mag (Sung et al. 1997) and a photometrically determined spectral type F9 (Young 1978). The membership probability is given as 96% by Vasilevskis et al. (1965). VAS 87 is also an X-ray source detected by the CHANDRA satellite (Ramirez et al. 2004). Therefore the star is very likely to be young and a member of NGC 2264. In the study by King (1998) a Teff = 6135 ± 140 K and a log n(Li) = 3.65 are given.
3. CoRoT light curves
3.1. Observations and data reduction
The CoRoT satellite (Baglin 2006) was launched on 2006, Dec. 27, from Baikonur onboard a Soyuz rocket into a polar, inertial circular orbit at an altitude of 896 km. CoRoT carries a 27-cm telescope and can observe stars inside two cones of 10° radius, one at RA = 06:50 and the other at RA = 18:50. The field of view of the telescope is almost circular with a diameter of 3.8°. Each CCD is a square of 1.3°. The filter bandwidth ranges from 370 to 1000 nm.
CoRoT observed NGC 2264 including VAS 20 and VAS 87 for the first time for 23.4 days in March 2008 during the short run SRa01 within the framework of the Additional Programme (Weiss 2006). A second short run, SRa05, on the cluster NGC 2264 was conducted in December 2011/January 2012, during which only VAS 87 was re-observed with a time base of about 39 days.
For both observing runs, the complete cluster was placed in one exofield CCD and data were taken for all stars in the accessible magnitude range, i.e., from 10 to 16 mag in R. The 100 brightest stars in the field of NGC 2264 were the primary targets to search for stellar pulsations among PMS cluster members.
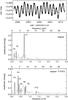 |
Fig. 1 CoRoT light curve (top panel) for VAS 20, original amplitude spectrum (grey) from 0 to 3 d-1 (bottom X axis), i.e., from 0 to 34.72 μHz (top X axis), with the first three intrinsic frequencies identified (black), residual amplitude spectra after prewhitening the three highest amplitude frequencies (where the remaining seven intrinsic frequencies are again marked in black). Note the different y-axes scales. |
The reduced N2 data for both stars and both runs were extracted from the CoRoT data archive. The CoRoT data reduction pipeline (Auvergne et al. 2009) flags the data points that were obtained during passages of the satellite over the South Atlantic Anomaly (SAA) and replaces them with linearly interpolated values. We did not use these SAA-flagged data points in our analysis. The light curves of VAS 20 and VAS 87 obtained in 2008 (see Fig. 1 and top left panel in Fig. 2) consist of 2704 and 2600 data points with a sampling time of 512 s. The 2011/12 data set of VAS 87 has been observed with a sampling time of 32 s and therefore comprises 90 073 data points. We checked for the presence of contaminating stars in the point-spread function and mask used for the observations for all three light curves and found no contaminating sources.
For VAS 20 chromatic light curves in red, green, and blue were obtained by CoRoT, while for VAS 87 data were taken only in white light. The chromatic light curves were used to check the variability of VAS 20. The variations are present in all three colors with the expected different photometric amplitudes. The top panels of Figs. 1 and 2 show the light curves in white light for the two stars where the fluxes obtained in the three colors for VAS 20 were summed to increase the signal-to-noise ratio (S/N).
VAS 20 was also observed by the MOST (Walker et al. 2003) satellite in 2006 (Zwintz et al. 2009) and VAS 87 was included in the MOST observations of NGC 2264 in 2011/12. Because the two stars are rather faint targets for MOST, the low-amplitude variability is completely hidden in the noise and the respective light curves cannot be used for any further investigation.
3.2. Comparison of the CoRoT data of SRa01 and SRa05
The light curves of VAS 87 (Fig. 2) observed in 2008 (i.e., SRa01) and 2011/12 (i.e., SRa05) show a dramatic difference in the amplitudes of the observed variability. A detailed comparative study of the characteristics of the NGC 2264 observations by CoRoT obtained in both years showed that several instrumental effects are present. These instrumental effects, as described below, make it very difficult for us to interpret amplitude changes between the two observing years. For that reason we do not consider amplitude variations in this paper.
Different instrumental settings were used for CoRoT in 2008 and 2011/12 that might affect the measured amplitudes: for the observations in 2008, the CCD E1 was used, but because it is not operative any more, the observations in 2011/12 were conducted using the second exoplanet CCD, E2. For the short run SRa01 the best possible observing season for NGC 2264 was chosen (i.e., March 2008), minimizing the influence of scattered light. Due to the coordinated simultaneous observations of CoRoT with the satellites Spitzer (Werner et al. 2004), Chandra (Weisskopf et al. 2002) and MOST (Walker et al. 2003) in 2011/12, not the best observing period was taken (i.e., December 2011 and January 2012). Therefore different orientations of the CoRoT satellite in the two runs had to be chosen and different photometric templates had to be used. The different orientation of the cluster on the CCD could have some impact on the properties of the observations, e.g., the CCD temperature in the 2011/12 observations was higher than in 2008. Additionally, the aging of the CCD resulted in an increased rate of hot pixels and a higher dark current level.
Many of these effects are corrected for by the CoRoT pipeline in a first approximation, and do not affect the time-domain properties. But the situation is more difficult for the amplitudes of individual modes. For instance, aperture photometry can be affected by the background levels of the stellar field and of the CCD. An uncertainty on the estimation of the background level of 10% leads to an uncertainty on the amplitude of the same order. The estimate of the background used by the standard correction in the CoRoT pipeline depends on many factors, such as the proximity of the background windows, the orientation of the CCD, and the shape of the photometric template. This means that it can vary from one target to another. A detailed study of these effects is currently in preparation (Baglin et al., in prep.).
Because these effects influence the ultra-precise CoRoT data significantly, the relative amplitudes for VAS 87 obtained from the SRa01 data are different to those derived from the SRa05 data. This is why we do not discuss amplitude variations in this paper.
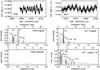 |
Fig. 2 CoRoT light curves (top panels) for VAS 87 from SRa01 (2008 data, left panel) and SRa05 (2011/12 data, right panel; light curve with 32 s sampling in grey and binned to 512 s in black) to the same X-axes scales, original amplitude spectra (grey) from 0 to 2 d-1 (bottom X axis) i.e., from 0 to 23.15 μHz (top X axis), with the six common intrinsic frequencies identified in black (middle panels), residual amplitude spectra after prewhitening the six frequencies (bottom panels) where the additional eight frequencies found in the 2011/12 data are marked in black (bottom right panel). Note the different Y-axes scales in the top and middle panels. |
3.3. Frequency analysis
For the frequency analyses, we used the software package Period04 (Lenz & Breger 2005), which combines Fourier and least-squares algorithms. Frequencies were then prewhitened and considered to be significant if their amplitudes exceeded four times the local noise level in the amplitude spectrum (Breger et al. 1993; Kuschnig et al. 1997). We verified the analysis using the SigSpec software (Reegen 2007). SigSpec computes significance levels for amplitude spectra of time series with arbitrary time sampling. The probability density function of a given amplitude level is solved analytically and the solution includes dependences on the frequency and phase of the signal.
In 2008, VAS 20 and VAS 87 were observed with a sampling time of 512 s, corresponding to a Nyquist frequency of 84 d-1; hence, the frequency analysis was conducted in the range from 0 to 84 d-1. The Rayleigh frequency resolution 1/T corresponds to 0.04 d-1, where T is the length of the observations (23.4 days). For the two frequencies present within 1/T, Kallinger et al. (2008) have shown with numerical simulations that the upper limit for the frequency error is 1/(4 × T) (see also their Fig. 3) if the SigSpec significance (sig) is higher than 16. In our case this corresponds to a resolution of 0.01 d-1. For sig < 16, the frequency error is  , i.e., the values given in parentheses in Tables 1 and 2. In our case only F10 in VAS 20 has sig < 16.
In 2011, VAS 87 was observed with a sampling time of 32 s, corresponding to a Nyquist frequency of 1218 d-1. The complete run lasted for about 39 days, but due to instrumental effects, the first few days had to be omitted from the analysis. The total length of the data set (shown in Fig. 2) used in this investigation comprises ~35 days, which corresponds to a Rayleigh frequency resolution of 0.028 d-1. Applying the Kallinger et al. (2008) criterion, we obtain an upper limit of the frequency error of 0.007 d-1, if the SigSpec significance is higher than 16. The frequency errors for sig < 16 are given in Table 2.
Using the CoRoT light curve from 2008, VAS 20 shows ten intrinsic frequencies in the range from 0 to 1.35 d-1 (Fig. 1 and Table 1). Linear combinations between the frequencies have been sought within three times the frequency uncertainty. Three frequencies, i.e., F4, F9, and F10, might be explained as linear combinations, the other seven are clearly independent from each other. We believe that the frequency corresponding to the rotational period of VAS 20 is F1 (see Sect. 5).
For VAS 87 the data sets from 2008 and 2011 were analysed independently and the results were then compared to each other. Because the data set obtained in 2011 is significantly longer, the noise level in the amplitude spectrum is lower and additional frequencies could be identified. Six frequencies are common to both data sets (see Table 2), eight additional frequencies were found in the 2011 data set. From these 14 frequencies in total, seven could be explained as linear combinations (again within three times the frequency uncertainties), which are identified in the last column of Table 2. Seven are clearly independent of each other. Due to the instrumental differences in the observations from 2008 and 2011 (see Sect. 3.2), the respective amplitudes of the common frequencies cannot be used for astrophysical interpretation. For VAS 87 we believe that F5 is the frequency that indicates the rotational period (see Sect. 5).
Applying the criteria by Kallinger et al. (2008), all frequencies for VAS 20 and VAS 87 are resolved and are therefore considered intrinsic to the stars.
Results of the frequency analysis of VAS 20.
Results of the frequency analysis of VAS 87 using data from 2008 and 2011.
4. Spectroscopic analysis
Fundamental parameters and abundances of both stars were determined from spectra obtained on 2010, December 15 and 16, with the Robert G. Tull Coudé Spectrograph (TS) on the 2.7-m telescope of Mc Donald Observatory. In the adopted configuration the cross-dispersed échelle spectrograph has a resolving power of 60 000 and delivered spectra of VAS 20 and VAS 87 with S/N per pixel, calculated at ~ 5000 Å, of 100 and 65. Each spectrum covered the wavelength range from 3633–10 849 Å with gaps between the échelle orders at wavelengths larger than 5880 Å.
Bias- and flat-field frames were obtained at the beginning of each night, while several Th-Ar comparison lamp spectra were obtained each night for wavelength calibration purposes. The reduction was performed using the Image Reduction and Analysis Facility1 (IRAF). The spectra were normalized by fitting a low-order polynomial to carefully selected continuum points.
To compute model atmospheres of the target stars we employed the LLmodels stellar model atmosphere code by Shulyak et al. (2004), while we calculated synthetic spectra with Synth3 (Kochukhov 2007). Our main source of atomic parameters for spectral lines is the Vald database (Kupka et al. 1999). The local thermodynamic equilibrium (LTE) abundance analysis was based on equivalent widths, analysed with a modified version (Tsymbal 1996) of the Width9 code (Kurucz 1993).
We determined the microturbulence velocity (υmic) imposing equilibrium between line abundance and equivalent width for Fe i lines, log g imposing ionisation equilibrium for Fe, and Teff imposing the excitation equilibrium for Fe i lines. For VAS 87 we obtained Teff = 6220 ± 150 K, log g = 3.8 ± 0.2 and υmic = 1.7 ± 0.5 km s-1, while for VAS 20 we obtained Teff = 6380 ± 150 K, log g = 4.0 ± 0.2 and υmic = 1.8 ± 0.5 km s-1. The excitation and ionisation equilibria obtained for VAS 20 and VAS 87 are shown in Figs. 3 and 4. For both stars, the measured equivalent widths span between about 20 and 250 mÅ. Because the uncertainty on Teff is only statistical and does not take into account the possible presence of various systematic effects, we increased the uncertainty to 200 K. By imposing the ionisation equilibrium, we took into account non-LTE (NLTE) effects for Fe, as given by Mashonkina et al. (2011).
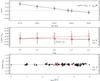 |
Fig. 3 Top panel: correlation between line abundance and excitation potential for Fe i as a function of Teff for VAS 20. Middle panel: Fe i (asterisks) and Fe ii (diamonds) abundance as a function of log g for VAS 20. A small horizontal shift was applied to the points for visualisation purposes. Bottom panel: excitation equilibrium for Fe i (asterisks) and Fe ii (diamonds) lines for VAS 20. The correlations are shown by a solid and a dashed line. |
It is extremely important to check the parameters obtained in this way with other indicators as this method might be strongly affected by systematics (see for example Ryabchikova et al. 2009 and Fossati et al. 2011). For this reason we used hydrogen lines and lines with extended wings to check Teff and log g. At this temperaure the hydrogen lines have the advantage of not being very sensitive to gravity variations.
In PMS stars various spectral lines, particularly the hydrogen lines, could show emission as young stars might still be surrounded by the remnants of their birth clouds. If the hydrogen lines would be partially or completely filled, determining the effective temperature (Teff) from these lines would be impossible. There is no sign of emission for VAS 20 and VAS 87, and if there were any it would affect just the line cores, which cannot be taken into account due to NLTE effects. We therefore used the Hγ line to estimate Teff. Hα was not covered and Hβ is affected by a defect in the imaging system of the spectrograph. We normalized the Hγ line continuum using the artificial flat-fielding technique described in Barklem et al. (2002), which has proven to be successful with TS data (e.g., Fossati et al. 2011). To reduce systematic uncertainties in the temperature determination caused by the hydrogen line normalization, we obtained low-resolution (R ~ 10 000) spectra, covering Hα (6470 − 6710 Å), with the 1.8-m telescope of the Dominion Astrophysical Observatory (Canada). Low-resolution spectra allow a better control of the normalization.
Within the uncertainties, the hydrogen lines confirmed the effective temperatures we derived for both stars with the excitation equilibrium. We confirmed the derived log g values with the analysis of the Mg i line profile at λ 5172 Å (for more details on the adopted procedure see Fossati et al. 2011), which, in this temperature regime, is particularly sensitive to gravity variations. Our fundamental parameters provide the best overall description of the available observables: hydrogen and metallic line profiles. Our analysis shows that the two stars are very similar, which is also demonstrated in Fig. 5, which shows a comparison between the spectra of the two stars.
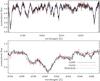 |
Fig. 5 Comparison between the observed spectra of VAS 20 (dashed line) and VAS 87 (solid line) in the region around the Mg ib triplet (top panel) and Hγ line (bottom panel). Both panels present a synthetic spectrum (dash-dotted line), for comparison, which was calculated with Teff = 6300 K and log g = 3.9. To better appreciate the similarities between the two stars, we convolved the spectrum of VAS 87 to the same υsini of VAS 20. |
By fitting synthetic spectra to several weakly blended lines, we measured a υsini of 42 ± 2 km s-1 for VAS 20, and 18 ± 1 km s-1 for VAS 87. Given the relatively large υsini, we also performed the analysis of VAS 20 using spectral synthesis (for more details see Fossati et al. 2007), obtaining results consistent with the equivalent width results. Given the Teff of the two stars, we expect the presence of some macroturbulence velocity (υmac). For VAS 20, υsini is so large that the line profiles do not require any υmac, while for VAS 87, to be able to fit simultaneously the core and the wings of strong lines, we need a υmac of about 12 km s-1. This value is slightly higher than what is expected for main sequence stars of this Teff (Valenti & Fisher 2005), which might be connected to the fact that this star is in its PMS phase. For VAS 20 we were not able to measure υmac because of the rather large υsini, which prevented us from seeing the effects of υmac broadening on the line wings. In this respect, the υsini we obtained for VAS 20 is likely to contain also the hidden information on υmac, which cannot be directly measured.
LTE atmospheric abundances in programme stars with the error estimates based on the internal scattering from the number of analysed lines, n.
For each star we determined the abundances of about 15 elements, which are given in Table 3. The spectrum of VAS 87 is highly affected by spikes, making the continuum normalisation and the equivalent width measurements rather uncertain, in particular in the blue spectral region. This is responsible for the slightly larger abundance uncertainties for VAS 87, compared to those of VAS 20. For both stars, we obtained abundance values comparable to the solar ones, except for Ba and Li, which are overabundant. This agrees reasonably well within the errors with the overall cluster metallicity of − 0.15 (Lynga 1987). For Li we derived an abundance of log n(Li) = 3.49 ± 0.16 for VAS 20 and log n(Li) = 3.44 ± 0.10 for VAS 87 (see Fig. 6). The difference in the uncertainties of the Li abundance for the two stars reflects the difference in the projected rotational velocity (υsini). We obtained the Li abundance from the lines at λ ~ 6707 Å adopting the hyperfine structure from Smith et al. (1998) and the meteoritic/terrestrial isotopic ratio Li6/Li7 = 0.08 (Rosman & Taylor 1998). The given errors on the Li abundance were calculated taking into account the uncertainties on the fundamental parameters (see Fossati et al. 2009).
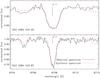 |
Fig. 6 Comparison between the observed spectra (black solid line) of VAS 20 (upper panel) and VAS 87 (lower panel) in the region of Li line at λ ~ 6707 Å and synthetic spectra (red dashed line) calculated with the best-fitting Li abundance. Note the different y-axes scales. |
4.1. Spectral energy distribution and Hertzsprung-Russell diagram
Figures 7 and 8 show the fits of the synthetic fluxes, calculated with the fundamental parameters derived for VAS 20 and VAS 87 to the observed Johnson (Sung et al. 1997), 2MASS (Zacharias et al. 2005), Spitzer (IRAC − Sung et al. 2009), and WISE (Cutri et al. 2012) photometry, converted to physical units. For this we used the calibrations provided by Bessel et al. (1998), van der Bliek et al. (1996), Sung et al. (2009), and Wright et al. (2010). Adopting the cluster distance and reddening given by Sung et al. (1997), we estimated the stellar radius of VAS 20 to be 3.5 ± 0.5 R/R⊙, while for VAS 87 we derived a radius of 2.2 ± 0.5 R/R⊙. This comparison also confirms the temperature we obtained for the two stars.
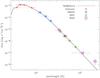 |
Fig. 7 Comparison between LLmodels theoretical fluxes (full line), calculated with the fundamental parameters derived for VAS 20, with Johnson (crosses), 2MASS (diamonds), Spitzer (triangles), and WISE (squares) photometry converted to physical units. |
Along the line of sight of VAS 87 there is a dense cloud of material that apparently lies behind the star, as it would otherwise be clearly visible in the spectral energy distribution, which we can fit with the same reddening applied for VAS 20. This is also supported by the presence of only small amounts of reddening across the cluster reported in the literature (e.g., Sung et al. 1997). Figure 8 shows also a steep increase in flux in the WISE photometry of the two red channels, but this feature is not present in the Spitzer photometry. It is therefore possible that the WISE photometry is contaminated by the background cloud, which would be rather bright at infrared wavelengths.
Using the spectroscopic temperatures, we inserted the two stars into the HR-diagram. We calculated the luminosity of each star photometrically, adopting the magnitudes in the V band, a cluster distance of 759 ± 83 pc, and a reddening of E(B − V) = 0.071 ± 0.033 (Sung et al. 1997). We used the bolometric correction by Balona (1994). For VAS 20 we obtained log L/L⊙ = 1.235 and for VAS 87 log L/L⊙ = 0.805. Given all the uncertainties and because we adopted a bolometric correction valid for main-sequence stars, we decided to apply a conservative uncertainty of 0.1 dex on the luminosity.
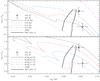 |
Fig. 9 Positions of VAS 20 (asterisk) and VAS 87 (diamond) in the HR-diagram in comparison with evolutionary tracks (bottom panel) and isochrones (top panel). In both panels the ZAMS is indicated by a dotted line. Evolutionary tracks for PMS stars with masses of 2.25 M/M⊙, 2.00 M/M⊙, 1.75 M/M⊙, and 1.50 M/M⊙ are shown by a solid, dashed, dash-dotted, and dash-triple dotted line. Isochrones with ages of 10 Myr, 8 Myr, 6 Myr, and 2 Myr are shown by a solid, dashed, dash-dotted, and dash-triple-dotted line. The borders of the γ Doradus instability strip (Dupret et al. 2004) are marked with thick solid lines. |
Figure 9 shows the position of the two stars in the HR-diagram, compared to PMS evolutionary tracks from Guenther (priv. comm.) using the YREC evolution code (Demarque et al. 2008) with physics as described in Guenther et al. (2009) and isochrones by Demarque et al. (2008). We adopted solar metallicity for the evolutionary tracks and isochrones. Also included in Fig. 9 is the instability strip for γ Doradus stars (Dupret et al. 2004).
The derived Teff values are relatively low compared to the theoretical computations of the instability strip for PMS γ Doradus stars (see Bouabid et al. 2011, their Fig. 8). The cool border of the predicted theoretical (PMS) γ Doradus instability strip lies at about 6700 K, but such a high Teff would not allow fitting the hydrogen and metallic lines for both stars. Therefore the two stars lie slightly outside the predicted, theoretical PMS γ Doradus instability strip (Bouabid et al. 2011). This is not too surprising because similar discrepancies are found in other groups of (post-)main sequence pulsators. In particular, several of the γ Doradus stars found with data from the Kepler satellite (Koch et al. 2010) are located at temperatures similar to that of VAS 20 and VAS 87 (Balona et al. 2012).
Additionally, the theoretical seismic properties of PMS γ Doradus were investigated without a confirmed member of this group of pulsators. A comparison of the observations to the PMS γ Doradus theory might yield new constraints on the location of the respective instability region. More theoretical and observational work will be performed in the future to investigate this in detail. Because the PMS γ Doradus instability strip coincides well with the instability strip of the (post-) main sequence γ Doradus stars, in Fig. 9 we show the location of VAS 20 and VAS 87 in the HR-diagram with respect to the “classical” γ Doradus instability strip by Dupret et al. (2004).
On the basis of the evolutionary tracks we derived masses and radii for the two stars. For VAS 20 we obtained a mass of 2.17 ± 0.15 M⊙, a radius of 3.5 ± 0.5 R⊙, and a surface gravity of 3.69 ± 0.11, while for VAS 87 we obtained a mass of 1.55 ± 0.15 M⊙, a radius of 2.1 ± 0.5 R⊙, and a surface gravity of 3.98 ± 0.11. The stellar radii, derived from the evolutionary tracks agree remarkably well with what we obtained from the fit of the spectral energy distribution. Within one-sigma, the spectroscopic log g values also agree with those derived from the evolutionary tracks.
VAS 20 and VAS 87 are two stars born from the same molecular cloud that are members of NGC 2264 and that have nearly the same Teff and log g values, but slightly different masses, radii, and luminosities (see Table 4 for an overview of the fundamental parameters), which place them at different locations in the HR-diagram. At present we can only speculate about the reason for this discrepancy.
One possible explanation might be connected to the presence of sequential star formation in NGC 2264 and that its star forming activity is still ongoing (e.g., Flaccomio et al. 1999). The ages of stars in the cluster lie between 0.8 and 8 million years where intermediate-mass stars and very low mass stars were formed first and massive stars down to about one solar mass were formed later (Sung et al. 1997). To assess if an age spread in NGC 2264 might be a possible reason for the slight differences in the fundamental parameters of the two stars, we included the isochrones in Fig. 9 and obtained an age of 4 ± 1 Myr for VAS 20 and 10 ± 2 Myr for VAS 87. In the present case, the higher mass star (VAS 20) would have to have formed later than the lower mass star (VAS 87). This would fit the theory of star formation in NGC 2264 (Sung et al. 1997) described above.
Another possible explanation for the differences in the two stars’ fundamental parameters could be that VAS 20 is part of a binary system. We have assessed that the CoRoT photometry is not affected by a contaminating source and did not find any evidence for binarity in our spectroscopic measurements or in the spectral energy distribution. The log g value of VAS 87 derived from our spectroscopic data agrees well with the corresponding value determined from the evolutionary tracks. But for VAS 20 there is a difference of about 0.3 dex between the two values. We therefore hypothesize that the luminosity of VAS 20 is overestimated when extracted from spectroscopy because VAS 20 might be part of an unresolved binary system.
Fundamental parameters for VAS 20 and VAS 87.
4.2. Comparison with photometric colors
Young stars are often still surrounded by the remnants of their birth clouds, which affects the observed photometric colours. Therefore the application of photometric calibrations (developed for main sequence stars) to PMS objects will often lead to erroneous values.
In the present case, we used the available Strömgren photometry (Strom et al. 1971; Neri et al. 1993) and the photometric calibration by Moon & Dworetsky (1985) to test this hypothesis. For VAS 20 we derive Teff = 5800 K, log g = 3.6 and a metallicity [Fe/H] = − 0.76 and Teff = 6400 K, log g = 4.6 and a metallicity [Fe/H] = −0.61 for VAS 87. Although these Teff values might be used as a first estimate, the log g values of 3.6 and 4.6 are too low and too high for these stars and the quite low [Fe/H] values do not match the overall cluster metallicity of − 0.15 (Lynga 1987). This illustrates that the results of photometric calibrations for the determination of the fundamental parameters of PMS stars cannot be trusted and that only spectroscopic measurements yield reliable values.
5. Rotation and pulsation
Because star spots and γ Doradus pulsation cause variability on the same time scales, i.e., in the low frequency domain, we here discuss the nature of the observed variations in VAS 20 and VAS 87, which we attribute to a combination of rotation and pulsation.
Surface inhomogeneities can cause complex variability features in the light curves and amplitude spectra due to multiple spots on the surface, differential rotation, or migrating star spots (Strassmeier 2009). Nevertheless, frequencies originating from rotational modulation are mostly accompanied by non-linear effects, which can be identified in the amplitude spectra as harmonics and linear combinations.
Potential PMS γ Doradus pulsators are located in the same region of the HR-diagram as the T Tauri stars, which are known to show regular, semi-regular, and irregular variabilities. For the classical T Tauri stars in NGC 2264, Alencar et al. (2010) reported a mean rotational period between 3 and 4 days using data obtained during the same CoRoT run in 2008.
Based on this information, we performed additional frequency analyses of cluster members with known variability caused by spots (i.e., the classical T Tauri stars) that have spectral types from K0 to M0. These comparison stars were observed with CoRoT in the same run in 2008, i.e., have the same data set lengths, but are much cooler than VAS 20 and VAS 87. The low temperatures of the comparison stars ensure that their variability is likely to be produced by rotational modulation, as no pulsation (other than solar-like oscillations, which are in a different frequency range, i.e., higher than the Nyquist frequency of 84 d-1) can be present, and that their level of activity is equal to, or higher than, that of VAS 20 and VAS 87. A typical example is given in Fig. 10: the light curve (top panel) and amplitude spectrum (bottom panel) of CoID0223980447 observed in 2008 is shown. CoID0223980447 has a spectral type of K6. The frequency analysis shows two independant frequencies (F1 and F2 in Fig. 10) and a third frequency, which is 1/2 F1, indicating the presence of non-linear effects. From the frequency analyses of the spotted stars, we can confirm the findings by Alencar et al. (2010) and infer that rotational modulation can be responsible for a maximum of three frequencies in the 23-days long CoRoT data sets from 2008.
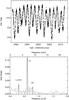 |
Fig. 10 Comparison T Tauri star CoID0223980447: CoRoT light curve (top panel) from SRa01 (2008) and original amplitude spectrum (bottom panel) from 0 to 2 d-1 (bottom X axis), i.e., from 0 to 23.15 μHz (top X axis), where the three significant frequencies are identified in black. |
Using data from the Kepler satellite, Balona et al. (2012) found three types of stars with multiple peaks in the frequency domain of γ Doradus pulsators: stars with one or two dominant peaks with asymmetric light curves (their ASYM group), stars with two close frequencies with symmetric light curves (their SYM group), and stars showing multiple low frequencies (their MULT group). While stars in the MULT group are very likely γ Doradus pulsators, there might be a mix of spotted stars and pulsators in their sample of the ASYM and SYM groups (Balona et al. 2012). From their analyses the authors also concluded that the pulsation periods of their stars are close to the rotational periods.
The light curves of our two stars appear to be symmetric, but once the peak with the highest amplitude (i.e., F1 for VAS 20 and F5 for VAS 87; see Figs. 1 and 2) is subtracted, multiple peaks at low amplitudes remain, which strongly indicates the presence of pulsation.
Using a υsini value of 42 km s-1 and a stellar radius of 3.5 R⊙ for VAS 20, the maximum rotation period corresponds to ~4.2 d. We identify F1 at 0.672 d-1, i.e., a period of about 1.5 days, to be likely caused by rotation because it is the highest and most dominant amplitude peak in our analysis with the other frequencies lying at significantly lower amplitudes (i.e., lower than 1 mmag). With these parameters, the projected inclination angle of the rotational axis is computed to be 23 degrees.
For VAS 87 a υsini value of 18 km s-1 with a stellar radius of 2.2 R⊙ would correspond to a maximum rotation period of ~6.1 d. In our frequency analysis, the by far most dominant and highest amplitude peak in the 2011/12 data set is F5 at 0.262 d-1, corresponding to a period of 3.816 d. In the 2008 data the highest amplitude peak is F1 at 0.519 d-1, which is about two times F5. As the surfaces of young stellar objects are likely not homogeneous, we assume that in 2008 the surface inhomogeneities were not as prominent as in 2011 and that pulsational and rotational activities occurred on similar levels in 2008. In this context, we still have to remember that the CoRoT photometry might be affected by instrumental effects to a presently unknown extent and that not all large amplitude differences between the data sets from 2008 and 2011/12 may have astrophysical reasons. We therefore conclude that F5 at 0.262 d-1 (value from the 2011 data set), corresponding to a period of 3.816 d, is likely to be caused by rotation. The corresponding projected inclination angle of the rotation axis is then 36 degrees for VAS 87.
We conclude that rotational modulation may explain only a few of the detected frequencies in VAS 20 and VAS 87, but the clear multi-periodicity of both stars shows that rotation cannot be the only cause of their variability and that g-modes have indeed been observed.
6. Conclusions
VAS 20 and VAS 87 were observed for about 23.4 days with the CoRoT satellite during the short run SRa01. VAS 87 was re-observed by CoRoT during the short run SRa05 in 2011/12 for about 39 days. The analyses of the high-precision photometric time series from space revealed ten and fourteen intrinsic frequencies between 0 and 1.5 d-1, which we attribute to be caused by a combination of rotation and γ Doradus-type pulsation. From high-resolution spectroscopy we determined the atmospheric parameters and chemical abundances for VAS 20 and VAS 87. Our Teff values of 6380 K and 6220 K agree, within the uncertainties, with those of King (1998).
Using our measured υsini values of 42 km s-1 and 18 km s-1 combined with the derived stellar radii of 3.5 R⊙ and 2.2 R⊙ for VAS 20 and VAS 87, we identify F1 at 0.672 d-1 for VAS 20 and F5 at 0262 d-1 for VAS 87 to be likely caused by rotation, while the other frequencies are interpreted as g-modes of γ Doradus pulsation.
In this context, we also compared VAS 20 and VAS 87 to several additional variable stars in NGC 2264 in the spectral range from K0 to M0. At such cool temperatures, variability can only be caused by spots on the stellar surface. From this analysis we find that rotational modulation can be responsible for three frequencies at maximum, but cannot explain the presence of ten and fourteen intrinsic frequencies identified in VAS 20 and VAS 87.
The probability that VAS 20 and VAS 87 are members of NGC 2264 is very high due to their reported X-ray fluxes, radial velocity measurements, and proper motions. The radial velocity (υr) of the cluster NGC 2264 was derived from measurements of 13 stars and is given as 17.68 ± 2.26 km s-1 by Kharchenko et al. (2005). From our spectra we derive υr values of 17.7 ± 1.0 and 19.3 ± 0.9 km s-1 for VAS 20 and VAS 87, which agree with the cluster average.
Our spectroscopic analyses add another crucial piece of information: the relatively high Li abundance we measured is in excellent agreement with the one obtained by Sestito & Randich (2005) for other stars of similar Teff in this cluster. The Li abundances reported by King (1998) are higher than the values that we derived but agree within the uncertainties of 0.2 dex. These systematic differences might occur because we used a higher Teff and took into account the full structure of the line. Additionally, our measurements of the equivalent widths are lower by 20 mÅ compared to King (1998).
Because the variability observed in VAS 20 and VAS 87 is very likely caused by a combination of rotational modulation and g-mode pulsation, and because both types of variations occur on the same time scales, it is currently hard to unambiguously distinguish between them. But the multiple frequencies discovered in VAS 20 and VAS 87 provide a first strong indication for an observational detection of γ Doradus pulsation in PMS stars, which was theoretically predicted (Bouabid et al. 2011). These first observational candidates for PMS γ Doradus stars will be an important input for theory and help to continue the development of asteroseismic models for PMS stars.
IRAF (http://iraf.noao.edu) is distributed by the National Optical Astronomy Observatory, which is operated by the Association of Universities for Research in Astronomy (AURA) under cooperative agreement with the National Science Foundation.
Acknowledgments
K.Z. receives a Pegasus Marie Curie Post-doctoral Fellowship of the Research Foundation – Flanders (FWO) and acknowledges support from an APART fellowship of the Austrian Academy of Sciences. We wish to thank the referee for useful comments that allowed us to clarify certain parts of this paper. We thank Oleg Khochukov and Denis Shulyak for their support. We are grateful to Ettore Flaccomio for his extensive knowledge about NGC 2264 and the respective literature. We thank Michel Breger for fruitful discussions in preparation of the paper. Spectroscopic data were obtained with the 2.7-m telescope at Mc Donald Observatory, Texas, US and at the Dominion Astrophysical Observatory, Herzberg Institute of Astrophysics, National Research Council of Canada.
References
- Alencar, S. H. P., Teixeira, P. S., Guimaraes, M. M., et al. 2010, A&A, 519, A88 [NASA ADS] [CrossRef] [EDP Sciences] [Google Scholar]
- Asplund, M., Grevesse, N., Sauval, A. J., & Scott, P. 2009, ARA&A, 47, 481 [NASA ADS] [CrossRef] [Google Scholar]
- Auvergne, M., Baudin, P., Boisnard, L., et al. 2009, A&A, 506, 411 [NASA ADS] [CrossRef] [EDP Sciences] [Google Scholar]
- Baglin, A. 2006, The CoRoT mission, pre-launch status, stellar seismology and planet finding, eds. M. Fridlund, A. Baglin, J. Lochard, & L. Conroy, ESA SP-1306 (The Netherlands: ESA Publication Division, Noordwijk) [Google Scholar]
- Balona, L. A. 1994, MNRAS, 268, 119 [NASA ADS] [CrossRef] [Google Scholar]
- Balona, L. A., Guzik, J. A., Uytterhoeven, K., et al. 2012, MNRAS, 415, 3531 [Google Scholar]
- Barklem, P. S., Stempels, H. C., Allen de Prieto, C., et al. 2002, A&A, 385, 951 [NASA ADS] [CrossRef] [EDP Sciences] [Google Scholar]
- Bessel, M. S. 1979, PASP, 91, 589 [NASA ADS] [CrossRef] [Google Scholar]
- Bessel, M. S., Castelli, F., & Plez, B. 1998, A&A, 333, 231 [NASA ADS] [Google Scholar]
- Breger, M. 1972, ApJ, 171, 539 [NASA ADS] [CrossRef] [Google Scholar]
- Breger, M. 1993, A&A, 271, 482 [NASA ADS] [Google Scholar]
- Bouabid, M.-P., Montalbán, J., Miglio, A., et al. 2001, A&A, 531, A145 [Google Scholar]
- Cutri, R. M., et al. 2012, WISE All-Sky Data Release, VizieR On-line Data Catalog: II/311 [Google Scholar]
- Demarque, P., Guenther, D. B., Li, L. H., Maxumdar, A., & Straka, W. S. 2008, Astrophys. Space Sci., 316, 31 [Google Scholar]
- Dupret, M.-A., Grigahcène, A., Garrido, R., Gabriel, M., & Scuflaire, R. 2004, A&A, 414, L17 [NASA ADS] [CrossRef] [EDP Sciences] [Google Scholar]
- Dupret, M., Grigahcéne, A., Garrido, R., Gabriel, M., & Scuflaire, R. 2005, A&A, 435, 927 [NASA ADS] [CrossRef] [EDP Sciences] [Google Scholar]
- Flaccomio, E., Micela, G., Sciortina, S., et al. 1999, A&A, 345, 521 [NASA ADS] [Google Scholar]
- Flaccomio, E., Micela, G., Sciortino, S., et al. 2000, A&A, 355, 651 [NASA ADS] [Google Scholar]
- Fossati, L., Bagnulo, S., Monier, R., et al. 2007, A&A, 476, 911 [NASA ADS] [CrossRef] [EDP Sciences] [Google Scholar]
- Fossati, L., Ryabchikova, T., Bagnulo, S., et al. 2009, A&A, 503, 945 [NASA ADS] [CrossRef] [EDP Sciences] [Google Scholar]
- Fossati, L., Ryabchikova, T., Shulyak, D. V., et al. 2011, MNRAS, 417, 495 [NASA ADS] [CrossRef] [Google Scholar]
- Fűrész, G., Hartmann, L. W., Szentgyorgyi, A. H., et al. 2006, ApJ, 648, 1090 [NASA ADS] [CrossRef] [Google Scholar]
- Guenther, D. B., Kallinger, T., Zwintz, K., et al. 2009, ApJ, 704, 1710 [NASA ADS] [CrossRef] [Google Scholar]
- Guzik, J. A., Kaye, A. B., Bradley, P. A., Cox, A. N., & Neuforge, C. 2000, ApJ, 542, L57 [NASA ADS] [CrossRef] [Google Scholar]
- Handler, G. 1999, MNRAS, 309, L19 [NASA ADS] [CrossRef] [Google Scholar]
- Kallinger, T., Reegen, P., & Weiss, W. W. 2008, A&A, 481, 571 [NASA ADS] [CrossRef] [EDP Sciences] [Google Scholar]
- Kaye, A. B., Handler, G., Krisciunas, K., Poretti, E., & Zerbi, F. M. 1999, PASP, 111, 840 [NASA ADS] [CrossRef] [Google Scholar]
- Kharchenko, N. N., Piskunov, A. E., Roeser, S., Schilback, E., & Scholz, R. D. 2005, A&A, 438, 1163 [NASA ADS] [CrossRef] [EDP Sciences] [MathSciNet] [Google Scholar]
- King, J. R. 1998, AJ, 116, 254 [NASA ADS] [CrossRef] [Google Scholar]
- Koch, D. G., Borucki, W. J., Basri, G., et al. 2010, ApJ, 713, 79 [Google Scholar]
- Kochukhov, O. 2007, in Spectrum synthesis for magnetic, chemically stratified stellar atmospheres, eds. I. I. Romanyuk, D. O. Kudryavtsev, O. M. Neizvestnaya, & V. M. Shapoval, Magnetic Stars 2006, 109, 118 [Google Scholar]
- Kupka, F., Piskunov, N., Ryabchikova, T. A., Stempels, H. C., & Weiss, W. W. 1999, A&AS, 138, 119 [NASA ADS] [CrossRef] [EDP Sciences] [MathSciNet] [PubMed] [Google Scholar]
- Kurucz, R. 1993, ATLAS9: Stellar Atmosphere Programs and 2 km s-1 grid. Kurucz CD-ROM No. 13 (Cambridge: Smithsonian Astrophysical Observatory) [Google Scholar]
- Kuschnig, R., Weiss, W. W., Gruber, R., Bely, P. Y., & Jenkner, H. 1997, A&A, 328, 544 [NASA ADS] [Google Scholar]
- Lenz, P., & Breger, M. 2005, Commun. Asteroseis., 146, 53 [Google Scholar]
- Lynga, G. 1987, Catalogue of Open Cluster Data, 5th Ed., Lund Observatory, Sweden [Google Scholar]
- Mashonkina, L., Gehren, T., Shi, J.-R., Korn, A. J., & Grupp, F. 2011, A&A, 528, A87 [NASA ADS] [CrossRef] [EDP Sciences] [Google Scholar]
- Moon, T. T., & Dworetsky, M. M. 1985, MNRAS, 217, 305 [NASA ADS] [CrossRef] [Google Scholar]
- Neri, L. J., Chavarria-K., C., & de Lara, E. 1993, A&AS, 102, 201 [NASA ADS] [Google Scholar]
- Park, B.-G., Sung, H., Bessel, M. S., & Kang, Y. H. 2000, AJ, 120, 894 [NASA ADS] [CrossRef] [Google Scholar]
- Ramírez, S. V., Rebull, L., Stauffer, J., et al. 2004, AJ, 127, 2659 [NASA ADS] [CrossRef] [Google Scholar]
- Reegen, P. 2007, A&A, 467, 135 [Google Scholar]
- Ryabchikova, T. A., Fossati, L., & Shulyak, D. 2009, A&A, 506, 203 [NASA ADS] [CrossRef] [EDP Sciences] [Google Scholar]
- Ripepi, V., Bernabei, S., Marconi, M., et al. 2006, A&A, 449, 335 [NASA ADS] [CrossRef] [EDP Sciences] [Google Scholar]
- Ripepi, V., Cusano, F., di Criscienzo, M., et al. 2011, MNRAS, 416, 1535 [NASA ADS] [CrossRef] [Google Scholar]
- Rodriguez, E., Lopez-Gonzalez, M. J., & Lopez de Coca, P. 2000, A&AS, 144, 469 [NASA ADS] [CrossRef] [EDP Sciences] [Google Scholar]
- Rosman, K. J. R., & Taylor, P. D. P. 1998, J. Phys. Chem. Ref. Data, 27, 1275 [NASA ADS] [CrossRef] [Google Scholar]
- Sagar, R., Piskunov, A. E., Miakutin, V. I., & Joshi, U. C. 1986, MNRAS, 220, 383 [NASA ADS] [CrossRef] [Google Scholar]
- Sestito, P., & Randich, S. 2005, A&A, 442, 615 [NASA ADS] [CrossRef] [EDP Sciences] [Google Scholar]
- Shulyak, D., Tsymbal, V., Ryabchikova, T., Stütz, Ch., & Weiss, W. W. 2004, A&A, 428, 993 [NASA ADS] [CrossRef] [EDP Sciences] [Google Scholar]
- Smith, V. V., Lambert, D. L., & Nissen, P. E. 1998, ApJ, 506, 405 [NASA ADS] [CrossRef] [Google Scholar]
- Strassmeier, K. G. 2009, A&ARv, 17, 251 [NASA ADS] [CrossRef] [Google Scholar]
- Strom, K. M., Strom, S. E., & Jost, J. 1971, ApJ, 165, 479 [NASA ADS] [CrossRef] [Google Scholar]
- Sung, H., Bessel, M. S., & Lee, S.-W. 1997, AJ, 114, 2644 [NASA ADS] [CrossRef] [Google Scholar]
- Sung, H., Bessel, M. S., & Chun, M. Y. 2004, AJ, 128, 1684 [NASA ADS] [CrossRef] [Google Scholar]
- Sung, H., Sauffer, J. R., & Bessel, M. S. 2009, AJ, 138, 1116 [NASA ADS] [CrossRef] [Google Scholar]
- Tsymbal, V. V. 1996, in Model Atmospheres and Spectral Synthesis, eds. S. J. Adelman, F. Kupka, & W. W. Weiss, ASP Conf. Ser., 108, 198 [Google Scholar]
- Uytterhoeven, K., Mathias, P., Baglin, A., et al. 2010, Astron. Nachr., 331, 993 [NASA ADS] [CrossRef] [Google Scholar]
- Valenti, J. A., & Fisher, D. A. 2005, ApJS, 159, 141 [NASA ADS] [CrossRef] [MathSciNet] [Google Scholar]
- van der Bliek, N. S., Manfroid, J., & Bouchet, P. 1996, A&AS, 119, 547 [NASA ADS] [CrossRef] [EDP Sciences] [Google Scholar]
- Vasilevskis, S., Sanders, W. L., & Balz, A. G. A. 1965, AJ, 70, 797 [NASA ADS] [CrossRef] [Google Scholar]
- Walker, M. F. 1956, ApJS, 2, 365 [NASA ADS] [CrossRef] [Google Scholar]
- Walker, G., Matthews, J. M., Kuschnig, R., et al. 2003, PASP, 115, 1023 [NASA ADS] [CrossRef] [Google Scholar]
- Weiss, W. 2006, in Proc. The CoRoT Mission Pre Launch Status, Stellar Seismology and Planet Finding, eds. M. Fridlund, A. Baglin, J. Lochard, & L. Conroy (ESASP 1306; Noordwijk, The Netherlands: ESA Publications Division), 93 [Google Scholar]
- Weisskopf, M. C., Brinkman, B., Canizares, S., et al. 2002, PASP, 114, 1 [NASA ADS] [CrossRef] [Google Scholar]
- Werner, M. W., Roellig, T. L., Low, F. J., et al. 2004, ApJS, 154, 1 [Google Scholar]
- Wright, E. L., Eisenhardt, P. R. M., Mainzer, A. K., et al. 2010, AJ, 140, 1868 [NASA ADS] [CrossRef] [Google Scholar]
- Young, A. 1978, PASP, 90, 144 [NASA ADS] [CrossRef] [Google Scholar]
- Zacharias, N., Monet, D. G., Levine, S. E., et al. 2005, BAAS, 36, 1418 [Google Scholar]
- Zwintz, K., Hareter, M., Kuschnig, R., et al. 2009, A&A, 502, 239 [NASA ADS] [CrossRef] [EDP Sciences] [Google Scholar]
All Tables
LTE atmospheric abundances in programme stars with the error estimates based on the internal scattering from the number of analysed lines, n.
All Figures
|
Fig. 1 CoRoT light curve (top panel) for VAS 20, original amplitude spectrum (grey) from 0 to 3 d-1 (bottom X axis), i.e., from 0 to 34.72 μHz (top X axis), with the first three intrinsic frequencies identified (black), residual amplitude spectra after prewhitening the three highest amplitude frequencies (where the remaining seven intrinsic frequencies are again marked in black). Note the different y-axes scales. |
| In the text | |
|
Fig. 2 CoRoT light curves (top panels) for VAS 87 from SRa01 (2008 data, left panel) and SRa05 (2011/12 data, right panel; light curve with 32 s sampling in grey and binned to 512 s in black) to the same X-axes scales, original amplitude spectra (grey) from 0 to 2 d-1 (bottom X axis) i.e., from 0 to 23.15 μHz (top X axis), with the six common intrinsic frequencies identified in black (middle panels), residual amplitude spectra after prewhitening the six frequencies (bottom panels) where the additional eight frequencies found in the 2011/12 data are marked in black (bottom right panel). Note the different Y-axes scales in the top and middle panels. |
| In the text | |
|
Fig. 3 Top panel: correlation between line abundance and excitation potential for Fe i as a function of Teff for VAS 20. Middle panel: Fe i (asterisks) and Fe ii (diamonds) abundance as a function of log g for VAS 20. A small horizontal shift was applied to the points for visualisation purposes. Bottom panel: excitation equilibrium for Fe i (asterisks) and Fe ii (diamonds) lines for VAS 20. The correlations are shown by a solid and a dashed line. |
| In the text | |
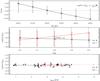 |
Fig. 4 Same as Fig. 3, but for VAS 87. |
| In the text | |
|
Fig. 5 Comparison between the observed spectra of VAS 20 (dashed line) and VAS 87 (solid line) in the region around the Mg ib triplet (top panel) and Hγ line (bottom panel). Both panels present a synthetic spectrum (dash-dotted line), for comparison, which was calculated with Teff = 6300 K and log g = 3.9. To better appreciate the similarities between the two stars, we convolved the spectrum of VAS 87 to the same υsini of VAS 20. |
| In the text | |
|
Fig. 6 Comparison between the observed spectra (black solid line) of VAS 20 (upper panel) and VAS 87 (lower panel) in the region of Li line at λ ~ 6707 Å and synthetic spectra (red dashed line) calculated with the best-fitting Li abundance. Note the different y-axes scales. |
| In the text | |
|
Fig. 7 Comparison between LLmodels theoretical fluxes (full line), calculated with the fundamental parameters derived for VAS 20, with Johnson (crosses), 2MASS (diamonds), Spitzer (triangles), and WISE (squares) photometry converted to physical units. |
| In the text | |
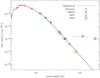 |
Fig. 8 Same as Fig. 7, but for VAS 87. |
| In the text | |
|
Fig. 9 Positions of VAS 20 (asterisk) and VAS 87 (diamond) in the HR-diagram in comparison with evolutionary tracks (bottom panel) and isochrones (top panel). In both panels the ZAMS is indicated by a dotted line. Evolutionary tracks for PMS stars with masses of 2.25 M/M⊙, 2.00 M/M⊙, 1.75 M/M⊙, and 1.50 M/M⊙ are shown by a solid, dashed, dash-dotted, and dash-triple dotted line. Isochrones with ages of 10 Myr, 8 Myr, 6 Myr, and 2 Myr are shown by a solid, dashed, dash-dotted, and dash-triple-dotted line. The borders of the γ Doradus instability strip (Dupret et al. 2004) are marked with thick solid lines. |
| In the text | |
|
Fig. 10 Comparison T Tauri star CoID0223980447: CoRoT light curve (top panel) from SRa01 (2008) and original amplitude spectrum (bottom panel) from 0 to 2 d-1 (bottom X axis), i.e., from 0 to 23.15 μHz (top X axis), where the three significant frequencies are identified in black. |
| In the text | |
Current usage metrics show cumulative count of Article Views (full-text article views including HTML views, PDF and ePub downloads, according to the available data) and Abstracts Views on Vision4Press platform.
Data correspond to usage on the plateform after 2015. The current usage metrics is available 48-96 hours after online publication and is updated daily on week days.
Initial download of the metrics may take a while.