Fig. 3
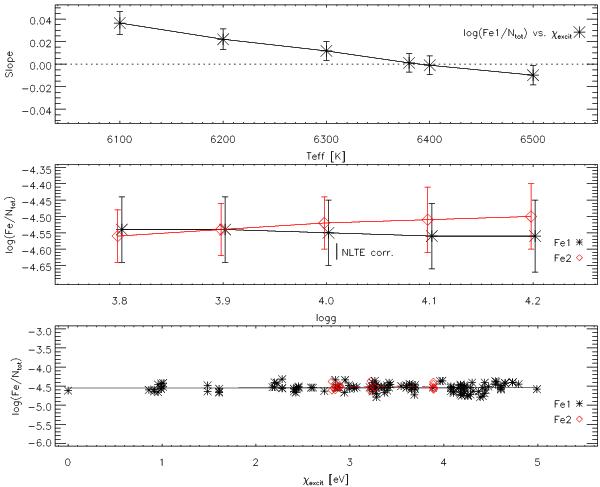
Top panel: correlation between line abundance and excitation potential for Fe i as a function of Teff for VAS 20. Middle panel: Fe i (asterisks) and Fe ii (diamonds) abundance as a function of log g for VAS 20. A small horizontal shift was applied to the points for visualisation purposes. Bottom panel: excitation equilibrium for Fe i (asterisks) and Fe ii (diamonds) lines for VAS 20. The correlations are shown by a solid and a dashed line.
Current usage metrics show cumulative count of Article Views (full-text article views including HTML views, PDF and ePub downloads, according to the available data) and Abstracts Views on Vision4Press platform.
Data correspond to usage on the plateform after 2015. The current usage metrics is available 48-96 hours after online publication and is updated daily on week days.
Initial download of the metrics may take a while.