Free Access
Fig. 10
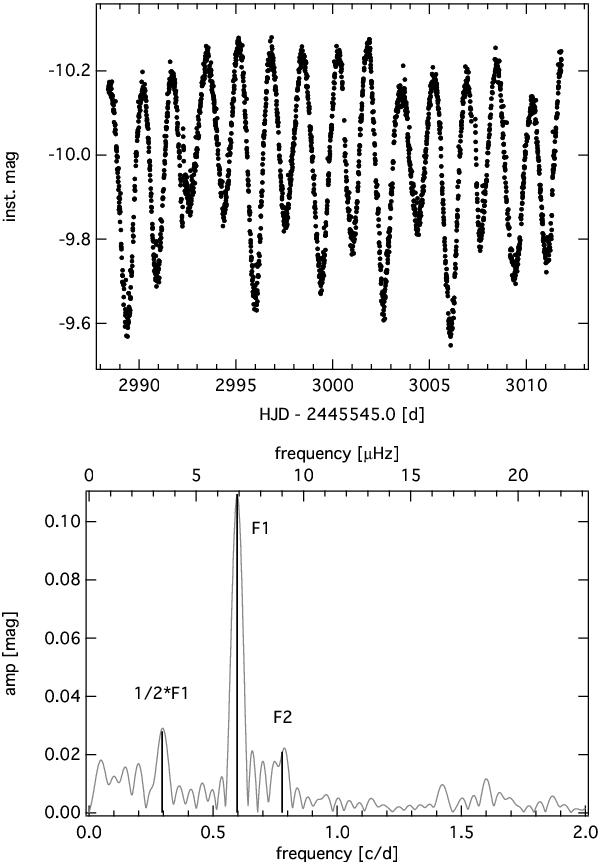
Comparison T Tauri star CoID0223980447: CoRoT light curve (top panel) from SRa01 (2008) and original amplitude spectrum (bottom panel) from 0 to 2 d-1 (bottom X axis), i.e., from 0 to 23.15 μHz (top X axis), where the three significant frequencies are identified in black.
Current usage metrics show cumulative count of Article Views (full-text article views including HTML views, PDF and ePub downloads, according to the available data) and Abstracts Views on Vision4Press platform.
Data correspond to usage on the plateform after 2015. The current usage metrics is available 48-96 hours after online publication and is updated daily on week days.
Initial download of the metrics may take a while.