Free Access
Fig. 6
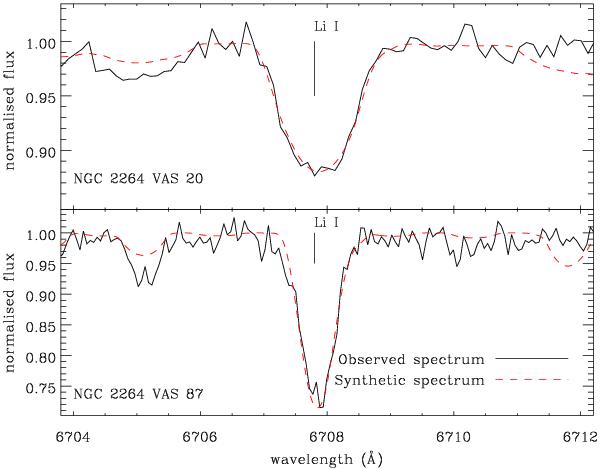
Comparison between the observed spectra (black solid line) of VAS 20 (upper panel) and VAS 87 (lower panel) in the region of Li line at λ ~ 6707 Å and synthetic spectra (red dashed line) calculated with the best-fitting Li abundance. Note the different y-axes scales.
Current usage metrics show cumulative count of Article Views (full-text article views including HTML views, PDF and ePub downloads, according to the available data) and Abstracts Views on Vision4Press platform.
Data correspond to usage on the plateform after 2015. The current usage metrics is available 48-96 hours after online publication and is updated daily on week days.
Initial download of the metrics may take a while.