Fig. 2
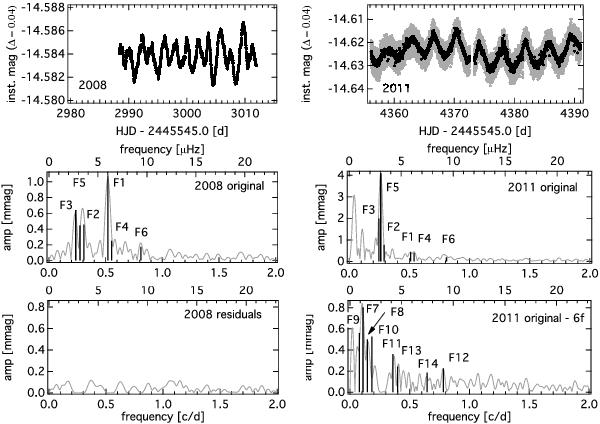
CoRoT light curves (top panels) for VAS 87 from SRa01 (2008 data, left panel) and SRa05 (2011/12 data, right panel; light curve with 32 s sampling in grey and binned to 512 s in black) to the same X-axes scales, original amplitude spectra (grey) from 0 to 2 d-1 (bottom X axis) i.e., from 0 to 23.15 μHz (top X axis), with the six common intrinsic frequencies identified in black (middle panels), residual amplitude spectra after prewhitening the six frequencies (bottom panels) where the additional eight frequencies found in the 2011/12 data are marked in black (bottom right panel). Note the different Y-axes scales in the top and middle panels.
Current usage metrics show cumulative count of Article Views (full-text article views including HTML views, PDF and ePub downloads, according to the available data) and Abstracts Views on Vision4Press platform.
Data correspond to usage on the plateform after 2015. The current usage metrics is available 48-96 hours after online publication and is updated daily on week days.
Initial download of the metrics may take a while.