Fig. 5
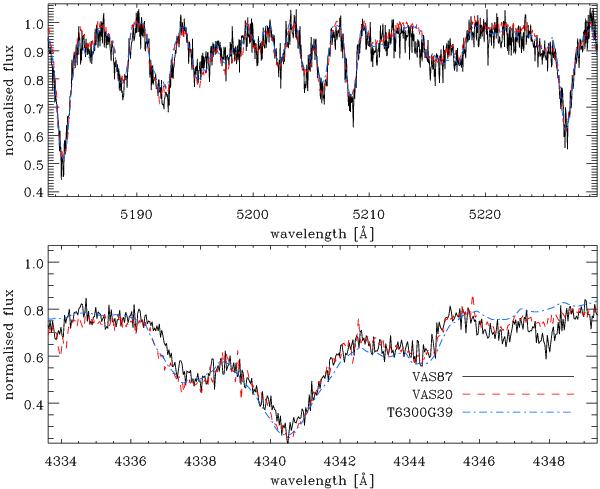
Comparison between the observed spectra of VAS 20 (dashed line) and VAS 87 (solid line) in the region around the Mg ib triplet (top panel) and Hγ line (bottom panel). Both panels present a synthetic spectrum (dash-dotted line), for comparison, which was calculated with Teff = 6300 K and log g = 3.9. To better appreciate the similarities between the two stars, we convolved the spectrum of VAS 87 to the same υsini of VAS 20.
Current usage metrics show cumulative count of Article Views (full-text article views including HTML views, PDF and ePub downloads, according to the available data) and Abstracts Views on Vision4Press platform.
Data correspond to usage on the plateform after 2015. The current usage metrics is available 48-96 hours after online publication and is updated daily on week days.
Initial download of the metrics may take a while.