| Issue |
A&A
Volume 546, October 2012
|
|
|---|---|---|
| Article Number | A108 | |
| Number of page(s) | 8 | |
| Section | Planets and planetary systems | |
| DOI | https://doi.org/10.1051/0004-6361/201220038 | |
| Published online | 16 October 2012 | |
A long-period massive planet around HD 106515A⋆,⋆⋆
1
INAF – Osservatorio Astronomico di Padova, Vicolo dell’ Osservatorio
5,
35122
Padova,
Italy
e-mail: This email address is being protected from spambots. You need JavaScript enabled to view it.
2
Dipartimento di Astronomia – Universitá di Padova,
Vicolo dell’Osservatorio 2,
Padova,
Italy
3 INAF – Centro Galileo Galilei, Calle Alvarez de Abreu 70,
38700 Santa Cruz de La Palma ( TF), Spain
4
McDonald Observatory, The University of Texas at
Austin, Austin,
TX
78712,
USA
5
INAF – Osservatorio Astrofisico di Catania, via S. Sofia
78, Catania,
Italy
6
INAF – Osservatorio Astrofisico di Torino, via Osservatorio
20, 10025
Pino Torinese,
Italy
7
Aix Marseille Université, CNRS, LAM (Laboratoire d’Astrophysique
de Marseille) UMR 7326, 13388
Marseille,
France
Received: 17 July 2012
Accepted: 13 August 2012
Abstract
We have performed radial velocity (RV) monitoring of the components of the binary system HD 106515 over almost 11 years using the high-resolution spectrograph SARG at Telescopio Nazionale Galileo (TNG). The primary shows long-period radial velocity variations that indicate the presence of a low-mass companion whose projected mass is in the planetary regime (msini = 9.33 MJ). The 9.8 year orbit is quite eccentric (e = 0.57), as is typical for massive giant planets. Our results confirm the previously made preliminary announcement of the planet by Mayor et al. (2011, A&A, submitted [arXiv:1109.2497]). The secondary instead does not show significant RV variations. The two components do not differ significantly in chemical composition, as was also found for other pairs of which one component hosts giant planets. Adaptive optics images obtained with TNG/AdOpt do not reveal additional stellar companions. From the analysis of the relative astrometry of the components of the wide pair we compute an upper limit on the mass of the newly detected companion of about 0.25 M⊙. State-of-the-art or near-future instrumentation can provide true mass determination, thanks to the availability of the wide companion HD106515B as reference. Therefore, HD 106515Ab will allow a deeper insight into the transition region between planets and brown dwarfs.
Key words: stars: individual: HD 106515A / planetary systems / binaries: visual / techniques: radial velocities / brown dwarfs / techniques: high angular resolution
Based on observations made with the Italian Telescopio Nazionale Galileo (TNG) operated on the island of La Palma by the Fundacion Galileo Galilei of the INAF (Istituto Nazionale di Astrofisica) at the Spanish Observatorio del Roque de los Muchachos of the Instituto de Astrofisica de Canarias.
Tables 3 and 4 are available in electronic form at http://www.aanda.org
© ESO, 2012
1. Introduction
The upper mass limit of planetary objects is currently widely debated in the scientific community. On one hand, an operational definition can be based on the minimum mass for deuterium burning (about 13 MJ) as a dividing line between planets and brown dwarfs (Burrows et al. 2001), as defined by the IAU (Boss et al. 2012), or to different fixed threshold values (e.g. 24−25 MJ: Butler et al. 2006; Schneider et al. 2011). On the other hand, a definition based on formation mechanisms is more difficult to obtain. Indeed, observational data are incomplete and the detection techniques in most cases can provide only an indirect indication on the formation of a detected substellar objects. Furthermore, only minimum masses are known for most of the objects detected by radial velocity (RV) surveys or, for objects detected through direct imaging, true masses are uncertain because of the high sensitivity of luminosity on age and intrinsic uncertainties of theoretical models, especially at young ages (Baraffe et al. 2003).
Despite these difficulties, there is growing evidence for a significant overlap in mass between objects formed like stars do and objects formed in protoplanetary disks. Several objects of planetary mass have been detected as free-floating objects in star clusters, star-forming regions, or in the field using imaging (e.g. Zapatero Osorio et al. 2000; Leggett et al. 2012; Scholz et al. 2012) and microlensing (Sumi et al. 2011) or as very wide companions of stars (e.g. Chauvin et al. 2005). Some of these objects might have been formed in planetary systems and then pushed at very wide separation or ejected from the system because of dynamical interactions with other planets (jumping-Jupiters scenario, Marzari & Weidenschilling 2002). However, it seems unlikely that this is the only mechanism that produces free-floating objects below deuterium-burning mass (Bowler et al. 2011). Instead, the minimum mass for core collapse was found to be of a few MJ and it is therefore likely that objects of planetary mass formed star-like outside planetary disks (Whitworth et al. 2007). The statistics of low-mass brown dwarfs appear to be compatible with Jeans-mass fragmentation of an interstellar molecular cloud (Zuckerman & Song 2009).
On the other hand, there are objects with masses from 13 to about 25 MJ that are found in systems with other lower mass planets, such as HD 168443 and HAT-P13. In the latter case the planetary nature of the lower mass companion is confirmed by the occurrence of transits (Bakos et al. 2009). In other cases such as HD 38519 and HD 202206 a debris disk is present in the system in addition to a massive planet and a lower mass planet (Moro-Martín et al. 2010). These facts support the formation of these objects in a protoplanetary disks. Planet formation models also predict the presence of very massive planets, up to about 38 MJ, in exceptional cases of long-lived, massive and metal-rich disks (Mordasini et al. 2009). The rising mass function below about 20−30 MJ (Grether & Lineweaver 2006) is another indication that a different formation mechanism starts to be present above deuterium-burning mass.
This picture is addionally complicated by evidence that the statistical properties of planetary mass companions with (projected) masses between 4 to 15 MJ are different from those of lower mass planets (Ribas & Miralda-Escudé 2007). It is then possible that either a different formation mechanism is in action or that the evolution of massive planets in a protoplanetary disk is different depending on planetary mass.
The statistic of substellar objects in the mass range between 10 to 30 MJ is still limited, given the intrinsic rarity of these objects (Sozzetti & Desidera 2010; Díaz et al. 2012). The discovery of additional candidates is therefore welcome, especially when the true mass of the companion can be determined or significantly constrained through astrometry (Sahlmann et al. 2011; Reffert & Quirrenbach 2011). We present here the confirmation of a high-mass planet candidate orbiting the star HD 106515A and clues on its mass from astrometry. The planet was first included in the compilation by Mayor et al. (2011) but only orbital period, RV semiamplitude, eccentricity, and corresponding minimum masses and semimajor axis are listed, postponing a more detailed analysis to a forthcoming paper (Marmier et al. 2012, Udry, priv. comm.). HD 106515A is part of a wide binary system, with the companion HD 106515B at a projected separation of about 250 AU. Both components were observed as part of the RV survey looking for planets around the components of moderately wide binaries performed using SARG at the Italian Telescopio Nazionale Galileo (TNG).
2. Observations and data reduction
Observations were performed at TNG using the high-resolution spectrograph SARG (Gratton et al. 2001). All but one spectra, used as template in the RV determination process, were acquired with the iodine cell inserted in the optical path. The observing procedure and the instrument set-up are the standard ones for SARG planet search survey. We refer to Desidera et al. (2011) for further details. For HD 106515, the chance of contamination of the spectra is negligible even in the worst observing conditions, thanks to the 6.8 arcsec separation on the sky between the components.
The acquisition of data on HD 106515 was stopped after May 2009 because of lack of time allocation and was recently restarted after the publication of Mayor et al. (2011), who listed a planet around the primary component of this system. The 900 s integration yields typical signal-to-noise ratios of 100. for HD 106515A and 90 for HD 106515B.
Differential radial velocities were obtained using the AUSTRAL code (Endl et al. 2000), achieving internal errors of about 3 m/s. Data taken in 2011−2012 have a somewhat larger uncertainty because of significant asymmetries of the spectrograph instrument profile. Standard RV analysis performed using a central Gaussian with two or four Gaussian satellites show an RV higher by few tens of m/s with respect to previous data. However, when analyzing the data by exploiting the maximum entropy algorithm, this discrepancy vanishes. In any case, while the internal errors are similar to the older data, we cannot exclude the occurrence of systematics at 10−15 m/s level for these recent data. The RV time series of HD 106515A and B are reported in Tables 3 and 4.
HD 106515 was also observed on 21 June 2007 using TNG/AdOpt (Cecconi et al. 2006). At that time only a long-term trend was appearing from the RV data and our observations were aimed at the direct detection of the companion responsible for the trend. The acquisition and data reduction procedures are the same as those for HD 132563 in Desidera et al. (2011), with the differences that all images of HD 106515 were taken with the broad band K′ filter and at the same rotation angle. We acquired and used 194 images in our analysis. The projected separation between HD 106515 A and B is 6.897 ± 0.015 arcsec and the position angle 267.07 ± 0.12 deg. Detection limits in K-band magnitude difference were transformed into mass limits using the mass-luminosity relation as in Delfosse et al. (2000) at MK < 9.5 and the 5-Gyr theoretical isochrone derived by Chabrier et al. (2000) at fainter magnitudes.
3. Stellar properties
HD 106515 (HIP 59743, GJ 9398, ADS 8477) is a pair formed by two similar stars that are slightly less massive than the Sun. The main properties of the components of HD 106515 are summarized in Table 1.
Stellar properties of the components of HD 106515.
The metallicity of the components was studied by us using both SARG and FEROS spectra (Desidera et al. 2004, 2006a). The metallicity is close to solar. The line-by-line abundance differential analysis revealed no significant abundance difference between the components.
The slow projected rotational velocity, low level of chromospheric activity (Desidera et al. 2006a; Gray et al. 2003; Arriagada 2011), and lack of detection in the ROSAT All Sky Survey (Voges et al. 2000) are all consistent with a quite old age, at least as old as the Sun. Isochrone fitting does not allow one to put firm constraints on stellar age, because of the long timescales of the evolution of stars less massive than the Sun. The thin-disk kinematic places an upper limit of about 8 Gyr on the age of the star. The system age is accordingly in the range of 4 to 8 Gyr.
4. A massive planet around HD 106515
The RV time-series of HD 106515A shows a long-period modulation clearly detectable by eye (Fig. 1). The Lomb-Scargle periodogram confirms the long periodicity and the lack of shorter periodicities in the data. The low level of chromospheric activity guarantees the Keplerian origin of the RV variations observed for HD 106515A. An expected activity jitter of 3.5 m/s was derived using Wright’s (2005) calibration. We then performed Keplerian fitting using a Levenberg-Marquardt least-squares fit algorithm as in Desidera et al. (2011). The parameters are similar to those derived by Mayor et al. (2011). Both orbital parameters are listed in Table 2. The residuals from the best-fit Keplerian orbit have an rms of about 6 m/s, and the periodogram shows no indication of additional significant periodicities (Fig. 2). We conclude that HD 106515A is orbited by a companion whose minimum mass is in the planetary regime. This is identified as HD 106515Ab. In the following section we exploit the available astrometric data to addionally constrain the mass of the companion.
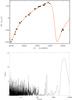 |
Fig. 1 Upper panel: radial velocities of HD 106515A overplotted the Keplerian best fit. Lower panel: Lomb-Scargle periodogram of the radial velocities. |
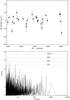 |
Fig. 2 Upper panel: residuals from best-fit orbit vs time. Lower panel: Lomb-Scargle periodogram of residuals from the Keplerian best fit of the radial velocities of HD106515A, with false-alarm probability levels from bootstrap simulation overplotted. |
Orbital parameters derived from RVs of HD 106515A.
The RV curve of the wide companion HD 106515B shows instead a scatter only slightly larger than internal errors (rms 8.7 m/s), without significant periodicities or long term trends (Fig. 3).
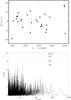 |
Fig. 3 Upper panel: RV time series of HD106515B. Lower panel: Lomb-Scargle periodogram of RVs and false-alarm-probability levels from bootstrap simulation. |
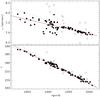 |
Fig. 4 Upper panel: projected separation vs time for HD 106515. Bottom panel: position angle vs time. In both panels filled circles are the measurements kept in the fit and the empty circles are those removed as being outliers in either projected separation or position angle. In both panels, the red continuous line is the linear fit imposing a passage through Hipparcos measurement, the blue dotted line is the quadratic fit, the purple dashed line is the slope as measured from Hipparcos (baseline 3.25 yr; epoch 1991.25) extrapolated to the whole baseline of available data. |
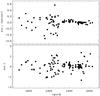 |
Fig. 5 Residuals from the quadratic fit in Fig. 4. Upper panel: projected separation. Lower panel: position angle. |
5. Search for astrometric signature
Considering the parameters from the RV orbit and the distance to the system, the amplitude of the astrometric signature for the RV minimum mass is about 1.2 mas. While we do not expect to be able to detect this astrometric motion in current data, it is possible to have a significant detection if the orbit is seen close to pole-on and the actual mass is significantly larger than the projected mass.
We considered all relative astrometry measurements available in the Washington Double Star catalog (kindly provided by Mason), which span about 180 yr. Long-period trends are clearly seen in both position angle and projected separation, as expected from the orbital motion of the wide pair (Fig. 4). The observed slopes are used in Sect. 6 to constrain the binary orbit. Short-term slopes as measured with Hipparcos are consistent with those based on the full dataset, supporting the lack of additional high-amplitude astrometric perturbations on timescales comparable to the mission lifetime.
Residuals from the long-term quadratic slope show a much wider scatter before 1930 (Fig. 5). We therefore considered only data taken after 1930 for the search of astrometric signatures caused by the RV companion. Lomb Scargle periodograms of residuals in X and Y coordinates have very low power at the period close to that of RV orbit. A possible periodicity is revealed at about 70 yr, especially in the Y coordinate (the modulation can also be seen by eye in the projected separation vs time plot). Given the dense sampling of the astrometric measurements, this periodicity is probably not be related to the RV companion.
If we limit our analysis to data from United States Naval Observatory (USNO) (Franz 1963; Kallarakal et al. 1969; Josties et al. 1978) and Heintz (1987) (Fig. 7), to have a more homogeneous dataset and reduce the impact of absolute calibration errors that might be present when using different instrumentation, the residuals have a dispersion of 13 mas in X and 20 mas in Y, and 14 and 15 mas in X and Y, respectively, when taking the 70 yr periodicity mentioned above into account. These data cover 22 years. We then estimate an upper limit on the astrometric amplitude with a 10 yr period of about 30 mas, comparing the expected astrometric motion of the companion for different masses with the USNO and Heintz (1987) dataset. This corresponds to a limit in mass of about 0.25 M⊙.
The tentative 70 yr periodicity with its possible amplitude of about 50 mas would correspond to a very low mass star of about 0.1 M⊙. The corresponding semimajor axis would be about 17 AU, i.e. 0.5 arcsec on the sky. Our images taken with TNG/AdOpt do not reveal stellar companions with masses larger than 0.15−0.2 M⊙ at this projected separation either around HD 106515A or around HD 106551B (Fig. 8), therefore, the non-detection is not conclusive. The RV semiamplitude of a 0.1 M⊙ companion in a 70-yr orbit in edge-on circular orbit is about 700 m/s, with RV difference that might reach 600 m/s over ten years. The real slope might be significantly smaller than this value, depending on the actual phase of the orbit at the time of the observations, on the inclination and the eccentricity. The data of HD 106515B do not reveal significant long-term trends (Fig. 3), which renders it very unlikely that such an additional companion is orbiting around this star. The RV data for HD 106515A are less adequate for the study of additional long term trends because the temporal baseline slightly exceeds one orbital period of HD 106515Ab and the sampling after 2009 is poor. Nevertheless, we do have specific indications of the presence of an additional long-term trend in the data.
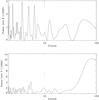 |
Fig. 6 Lomb-Scargle periodogram of the residuals from full-data quadratic fit in X and Y coordinates. Only data after 1930 were considered because of their higher precision. The short vertical lines at 10 yr mark the RV period. |
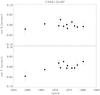 |
Fig. 7 Residuals from the full-data quadratic fit in X and Y coordinates. Only data from USNO (yearly averages) and Heintz (1987) are shown. |
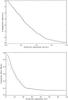 |
Fig. 8 Detection limits for stellar companions around the components of HD 106515 from TNG/AdOpt images. Upper panel: ΔK vs. projected separation in arcsec; lower panel: companion mass vs. projected separation in AU. In both plots continuous line represent the detection limits for HD 106515A and dotted lines those for HD 106515B. |
We also note that no measurable differences are found in the stellar proper motion between the new reduction of the short-term Hipparcos astrometric data for HD 106515 (van Leeuwen 2007) and the long-term Tycho-2 data (Høg et al. 2000). The proper motion values in the two catalogs agree well with each other within the quoted uncertainties, thus no useful constraint can be obtained on the orbit and mass ratio based on the Δμ technique (e.g. Makarov & Kaplan 2005).
6. Binary orbit
To constrain the orbit of the HD106515 system, we considered the long-term relative astrometry (Sect. 5) and the RV difference between the components. To derive this latter quantity, we measured the radial velocities of both components using the stellar template of HD 106515A. Taking the orbital motion of the massive planet around the primary into account, this difference is ΔRVA − B = 739 m/s. Internal errors derived from the error of the mean of the RV of the individual components and number of spectra and including uncertainty in the planet orbit are within 10 m/s. Systematic effects due to spectral mismatch were estimated by Nidever et al. (2002) to be about 100 m/s when using the solar spectrum as a template to derive the absolute RVs of FGK stars. This effect would be significantly smaller in our case thanks to the small temperature difference between the components and the very similar metallicities and projected rotational velocities. The difference in the convective blueshift and gravitational redshift of the components amounts to just 24 m/s following Eq. (3) of Nidever et al. (2002). Overall, the true error of our determination is likely within 50 m/s.
After obtaining the relative position and velocities on the plane of the sky and the relative velocity along the line of sight, we derived the family of possible bound solutions as a function of the separation between the components along the line of sight (z) using the approach by Hauser & Marcy (1999) as in Desidera et al. (2011). The results are displayed in Fig. 9.
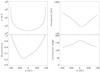 |
Fig. 9 Possible orbital parameters of the HD 106515 system for various separations along the line of sight at present epoch. Top-left: semimajox axis; top-right: periastron of the orbit; bottom-left: eccentricity; bottom-right: inclination. |
Critical semimajor axes for dynamical stability of planets around each component, calculated following Holman & Wiegert (1999), are shown in Fig. 10 for the family of possible orbits shown in Fig. 9. This quantity is larger than 40 AU for all orbits1. Therefore, the planet candidate is well within the stability boundaries for all possible orbits of the wide binary. The potential astrometric candidate discussed in Sect. 5 is also well within the stability zone. However, if real, its presence will alter the RV difference, the astrometric trends and the mass of one component, with some effects on the family of possible binary orbits.
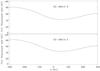 |
Fig. 10 Critical semimajor axes for dynamical stability for planets around the components of HD 106515, for various separations along the line of sight at present epoch and corresponding binary orbit parameters. |
7. Discussion
The planet candidate around HD 106515A, with its minimum mass of about 9.5 MJ, is one of the few with projected masses close to the deuterium-burning limit. From available data, we did not detect any additional planets in the system. The high eccentricity of its orbit and the solar-like metallicity of its parent star agree with the differences in the statistical properties of planets below and above 4 MJ found by Ribas & Miralda-Escudé (2007).
The planet host has a stellar companion of similar mass, therefore HD 106515Ab adds to the growing census of exoplanets in multiple systems (Desidera & Barbieri 2007; Roell et al. 2012). The binary separation is quite wide and plausible orbits leave dynamically stable zones up to 40−80 AU around the stars. This suggests a limited impact of the companion on the planet properties, but the moderate eccentricity might also be linked to Kozai interactions, which are effective even for widely separated companions considering the old age of the system (Takeda & Rasio 2005). We also found a tentative indication of an additional object with a period of 70 yr from the analysis of the relative astrometry. From our data, we cannot confirm the reality of this object, which might be a very low mass star, and infer the component around which it should be orbiting.
The presence of a well-separated companion with similar properties allowed us to perform a sensitive differential abundance analysis (Desidera et al. 2004, 2006a). The lack of significant metallicity differences between the components extends the previous finding that strong alterations of chemical abundances linked to the presence of planets are not a common event (Desidera et al. 2006a, 2011). There are eight binary systems with giant planets suitable for comparison of chemical abundances (HD 106515 and the 7 listed in Table 8 of Desidera et al. 2011). All of them have Δ [Fe/H] < 0.05 dex, which is significantly less than the typical difference in metallicity between giant planet hosts and nearby field stars (Δ [Fe/H] ~ 0.25 dex, see e.g. Fischer & Valenti 2005; Nordström et al. 2004). This supports the primordial origin for the metallicity enhancement of stars with giant planets (Fischer & Valenti 2005).
The binarity of HD 106515 also represents a suitable opportunity for the true mass determination of HD 106515Ab, thanks to the reference provided by HD 106515B. The expected astrometric amplitude is about 1.2 mas for the minimum mass and about 10 mas at the stellar/substellar boundary.
From available relative astrometry, the orbital motion of the wide pair is clearly detected. From the analysis of residuals from the long-term trend at epochs 1959−1980 for which several high-quality data are available, we derived an upper limit to the mass of the companion of about 0.25 M⊙. Much better astrometric precision can be obtained by more recent instrumentation. HD 106515 is an ideal target for differential astrometry using AO systems (Hełminiak et al. 2009; Roell et al. 2010) and new interferometric instruments such as PRIMA (Quirrenbach et al. 2011). In the near-future, the combination of ground-based radial velocities and Gaia high-precision space-borne astrometric data might prove decisive (e.g., Sozzetti 2011, and references therein).
Therefore, there are very promising perspectives for a true mass determination of the companion of HD 106515A in the coming years, which will remove the ambiguity due to projection effects. The availability of true masses is relevant for a better understanding of the high-mass tail of the planetary mass function and the transition between planets and brown dwarfs. The direct detection of the companion is instead more challenging even for next-generation planet finders such as SPHERE or GPI (Beuzit et al. 2010), because of the small projected separations (<0.2 arcsec) and faint luminosities implied by the old age of the system, unless the orbit is seen nearly pole-on and its mass is significantly larger than the minimum mass.
Online material
Differential radial velocities of HD 106515 A.
Differential radial velocities of HD 106515 B.
The Holman & Wiegert (1999) equations are no longer valid at values of |z| higher than 300 because of the high eccentricity of the binary orbit.
Acknowledgments
This research has made use of the SIMBAD database, operated at CDS, Strasbourg, France. This research has made use of the Washington Double Star Catalog maintained at the US Naval Observatory. We thank the TNG staff for contributing to the observations and the TNG TAC for generous allocation of observing time. We thank B. Mason for providing the astrometric data collected in the Washington Double Star Catalog. This work was partially funded by PRIN-INAF 2008 and PRIN-INAF 2010.
References
- Arriagada, P. 2011, ApJ, 734, 70 [NASA ADS] [CrossRef] [Google Scholar]
- Bakos, G. Á., Howard, A. W., Noyes, R. W., et al. 2009, ApJ, 707, 446 [NASA ADS] [CrossRef] [Google Scholar]
- Baraffe, I., Chabrier, G., Barman, T. S., Allard, F., & Hauschildt, P. H. 2003, A&A, 402, 701 [NASA ADS] [CrossRef] [EDP Sciences] [Google Scholar]
- Beuzit, J.-L., Boccaletti, A., Feldt, M., et al. 2010, in Pathways Towards Habitable Planets, eds. V. Coudé Du Foresto, D. M. Gelino, & I. Ribas, ASP Conf. Ser., 430, 231 [Google Scholar]
- Boss, A., Lecavelier des Etangs, A., Mayor, M., et al. 2012, Trans. IAU Ser. B, 28, 138 [Google Scholar]
- Bowler, B. P., Liu, M. C., Kraus, A. L., Mann, A. W., & Ireland, M. J. 2011, ApJ, 743, 148 [NASA ADS] [CrossRef] [Google Scholar]
- Burrows, A., Hubbard, W. B., Lunine, J. I., & Liebert, J. 2001, Rev. Mod. Phys., 73, 719 [Google Scholar]
- Butler, R. P., Wright, J. T., Marcy, G. W., et al. 2006, ApJ, 646, 505 [NASA ADS] [CrossRef] [Google Scholar]
- Cecconi, M., Ghedina, A., Bagnara, P., et al. 2006, in SPIE Conf. Ser., 6272 [Google Scholar]
- Chabrier, G., Baraffe, I., Allard, F., & Hauschildt, P. 2000, ApJ, 542, 464 [NASA ADS] [CrossRef] [Google Scholar]
- Chauvin, G., Lagrange, A.-M., Zuckerman, B., et al. 2005, A&A, 438, L29 [NASA ADS] [CrossRef] [EDP Sciences] [Google Scholar]
- da Silva, L., Girardi, L., Pasquini, L., et al. 2006, A&A, 458, 609 [NASA ADS] [CrossRef] [EDP Sciences] [Google Scholar]
- Delfosse, X., Forveille, T., Ségransan, D., et al. 2000, A&A, 364, 217 [NASA ADS] [Google Scholar]
- Desidera, S., & Barbieri, M. 2007, A&A, 462, 345 [NASA ADS] [CrossRef] [EDP Sciences] [Google Scholar]
- Desidera, S., Gratton, R. G., Scuderi, S., et al. 2004, A&A, 420, 683 [NASA ADS] [CrossRef] [EDP Sciences] [Google Scholar]
- Desidera, S., Gratton, R. G., Lucatello, S., & Claudi, R. U. 2006a, A&A, 454, 581 [NASA ADS] [CrossRef] [EDP Sciences] [Google Scholar]
- Desidera, S., Gratton, R. G., Lucatello, S., Claudi, R. U., & Dall, T. H. 2006b, A&A, 454, 553 [NASA ADS] [CrossRef] [EDP Sciences] [Google Scholar]
- Desidera, S., Carolo, E., Gratton, R., et al. 2011, A&A, 533, A90 [NASA ADS] [CrossRef] [EDP Sciences] [Google Scholar]
- Díaz, R. F., Santerne, A., Sahlmann, J., et al. 2012, A&A, 538, A113 [NASA ADS] [CrossRef] [EDP Sciences] [Google Scholar]
- Endl, M., Kürster, M., & Els, S. 2000, A&A, 362, 585 [Google Scholar]
- Fischer, D. A., & Valenti, J. 2005, ApJ, 622, 1102 [NASA ADS] [CrossRef] [Google Scholar]
- Franz, O. G. E. A. 1963, Publications of the US Naval Observatory Second Series, 18, 1 [Google Scholar]
- Gratton, R. G., Bonanno, G., Bruno, P., et al. 2001, Exp. Astron., 12, 107 [NASA ADS] [CrossRef] [Google Scholar]
- Gray, R. O., Corbally, C. J., Garrison, R. F., McFadden, M. T., & Robinson, P. E. 2003, AJ, 126, 2048 [NASA ADS] [CrossRef] [Google Scholar]
- Grether, D., & Lineweaver, C. H. 2006, ApJ, 640, 1051 [NASA ADS] [CrossRef] [Google Scholar]
- Hauser, H. M., & Marcy, G. W. 1999, PASP, 111, 321 [NASA ADS] [CrossRef] [Google Scholar]
- Heintz, W. D. 1987, ApJS, 65, 161 [NASA ADS] [CrossRef] [Google Scholar]
- Hełminiak, K. G., Konacki, M., Kulkarni, S. R., & Eisner, J. 2009, MNRAS, 400, 406 [NASA ADS] [CrossRef] [Google Scholar]
- Høg, E., Fabricius, C., Makarov, V. V., et al. 2000, A&A, 355, L27 [NASA ADS] [Google Scholar]
- Holman, M. J., & Wiegert, P. A. 1999, AJ, 117, 621 [NASA ADS] [CrossRef] [Google Scholar]
- Josties, F. J., Kallarakal, V. V., Douglass, G. G., & Christy, J. W. 1978, Publications of the US Naval Observatory Second Series, 24, 7 [NASA ADS] [Google Scholar]
- Kallarakal, V. V., Lindenblad, I. W., Josties, F. J., et al. 1969, Publications of the US Naval Observatory Second Series, 18 [Google Scholar]
- Leggett, S. K., Saumon, D., Marley, M. S., et al. 2012, ApJ, 748, 74 [NASA ADS] [CrossRef] [Google Scholar]
- Makarov, V. V., & Kaplan, G. H. 2005, AJ, 129, 2420 [NASA ADS] [CrossRef] [Google Scholar]
- Marmier, M., Segransan, D., Udry, S., et al. 2012, A&A, submitted [Google Scholar]
- Martin, D. C., Fanson, J., Schiminovich, D., et al. 2005, ApJ, 619, L1 [Google Scholar]
- Marzari, F., & Weidenschilling, S. J. 2002, Icarus, 156, 570 [NASA ADS] [CrossRef] [Google Scholar]
- Mayor, M., Marmier, M., Lovis, C., et al. 2011, A&A, submitted [arXiv:1109.2497] [Google Scholar]
- Mordasini, C., Alibert, Y., & Benz, W. 2009, A&A, 501, 1139 [NASA ADS] [CrossRef] [EDP Sciences] [Google Scholar]
- Moro-Martín, A., Malhotra, R., Bryden, G., et al. 2010, ApJ, 717, 1123 [NASA ADS] [CrossRef] [Google Scholar]
- Nidever, D. L., Marcy, G. W., Butler, R. P., Fischer, D. A., & Vogt, S. S. 2002, ApJS, 141, 503 [NASA ADS] [CrossRef] [Google Scholar]
- Nordström, B., Mayor, M., Andersen, J., et al. 2004, A&A, 418, 989 [NASA ADS] [CrossRef] [EDP Sciences] [Google Scholar]
- Perryman, M. A. C., & ESA, eds. 1997, The HIPPARCOS and TYCHO catalogues, Astrometric and photometric star catalogues derived from the ESA Hipparcos Space Astrometry Mission, ESA SP, 1200 [Google Scholar]
- Quirrenbach, A., Geisler, R., Henning, T., et al. 2011, Research, Science and Technology of Brown Dwarfs and Exoplanets: Proc. Int. Conf. held in Shangai on Occasion of a Total Eclipse of the Sun, Shangai, China, eds. E. L. Martin, J. Ge, & W. Lin, EPJ Web Conf., 16, 7005 [Google Scholar]
- Reffert, S., & Quirrenbach, A. 2011, A&A, 527, A140 [NASA ADS] [CrossRef] [EDP Sciences] [Google Scholar]
- Ribas, I., & Miralda-Escudé, J. 2007, A&A, 464, 779 [NASA ADS] [CrossRef] [EDP Sciences] [Google Scholar]
- Roell, T., Neuhäuser, R., & Seifahrt, A. 2010, in EAS Publ. Ser. 42, eds. K. Gożdziewski, A. Niedzielski, & J. Schneider, 179 [Google Scholar]
- Roell, T., Neuhäuser, R., Seifahrt, A., & Mugrauer, M. 2012, A&A, 542, A92 [NASA ADS] [CrossRef] [EDP Sciences] [Google Scholar]
- Sahlmann, J., Ségransan, D., Queloz, D., et al. 2011, A&A, 525, A95 [NASA ADS] [CrossRef] [EDP Sciences] [Google Scholar]
- Schneider, J., Dedieu, C., Le Sidaner, P., Savalle, R., & Zolotukhin, I. 2011, A&A, 532, A79 [NASA ADS] [CrossRef] [EDP Sciences] [Google Scholar]
- Scholz, A., Jayawardhana, R., Muzic, K., et al. 2012, ApJ, 756, 24 [NASA ADS] [CrossRef] [Google Scholar]
- Skrutskie, M. F., Cutri, R. M., Stiening, R., et al. 2006, AJ, 131, 1163 [NASA ADS] [CrossRef] [Google Scholar]
- Sozzetti, A. 2011, in EAS Publ. Ser. 45, 273 [Google Scholar]
- Sozzetti, A., & Desidera, S. 2010, A&A, 509, A103 [NASA ADS] [CrossRef] [EDP Sciences] [Google Scholar]
- Sumi, T., Kamiya, K., Bennett, D. P., et al. 2011, Nature, 473, 349 [NASA ADS] [CrossRef] [PubMed] [Google Scholar]
- Takeda, G., & Rasio, F. A. 2005, ApJ, 627, 1001 [NASA ADS] [CrossRef] [Google Scholar]
- van Leeuwen, F. 2007, A&A, 474, 653 [NASA ADS] [CrossRef] [EDP Sciences] [Google Scholar]
- Voges, W., Aschenbach, B., Boller, T., et al. 2000, IAU Circ., 7432, 1 [NASA ADS] [Google Scholar]
- Whitworth, A., Bate, M. R., Nordlund, Å., Reipurth, B., & Zinnecker, H. 2007, Protostars and Planets V, 459 [Google Scholar]
- Wright, J. T. 2005, PASP, 117, 657 [NASA ADS] [CrossRef] [Google Scholar]
- Zapatero Osorio, M. R., Béjar, V. J. S., Martín, E. L., et al. 2000, Science, 290, 103 [NASA ADS] [CrossRef] [PubMed] [Google Scholar]
- Zuckerman, B., & Song, I. 2009, A&A, 493, 1149 [NASA ADS] [CrossRef] [EDP Sciences] [Google Scholar]
All Tables
All Figures
|
Fig. 1 Upper panel: radial velocities of HD 106515A overplotted the Keplerian best fit. Lower panel: Lomb-Scargle periodogram of the radial velocities. |
| In the text | |
|
Fig. 2 Upper panel: residuals from best-fit orbit vs time. Lower panel: Lomb-Scargle periodogram of residuals from the Keplerian best fit of the radial velocities of HD106515A, with false-alarm probability levels from bootstrap simulation overplotted. |
| In the text | |
|
Fig. 3 Upper panel: RV time series of HD106515B. Lower panel: Lomb-Scargle periodogram of RVs and false-alarm-probability levels from bootstrap simulation. |
| In the text | |
|
Fig. 4 Upper panel: projected separation vs time for HD 106515. Bottom panel: position angle vs time. In both panels filled circles are the measurements kept in the fit and the empty circles are those removed as being outliers in either projected separation or position angle. In both panels, the red continuous line is the linear fit imposing a passage through Hipparcos measurement, the blue dotted line is the quadratic fit, the purple dashed line is the slope as measured from Hipparcos (baseline 3.25 yr; epoch 1991.25) extrapolated to the whole baseline of available data. |
| In the text | |
|
Fig. 5 Residuals from the quadratic fit in Fig. 4. Upper panel: projected separation. Lower panel: position angle. |
| In the text | |
|
Fig. 6 Lomb-Scargle periodogram of the residuals from full-data quadratic fit in X and Y coordinates. Only data after 1930 were considered because of their higher precision. The short vertical lines at 10 yr mark the RV period. |
| In the text | |
|
Fig. 7 Residuals from the full-data quadratic fit in X and Y coordinates. Only data from USNO (yearly averages) and Heintz (1987) are shown. |
| In the text | |
|
Fig. 8 Detection limits for stellar companions around the components of HD 106515 from TNG/AdOpt images. Upper panel: ΔK vs. projected separation in arcsec; lower panel: companion mass vs. projected separation in AU. In both plots continuous line represent the detection limits for HD 106515A and dotted lines those for HD 106515B. |
| In the text | |
|
Fig. 9 Possible orbital parameters of the HD 106515 system for various separations along the line of sight at present epoch. Top-left: semimajox axis; top-right: periastron of the orbit; bottom-left: eccentricity; bottom-right: inclination. |
| In the text | |
|
Fig. 10 Critical semimajor axes for dynamical stability for planets around the components of HD 106515, for various separations along the line of sight at present epoch and corresponding binary orbit parameters. |
| In the text | |
Current usage metrics show cumulative count of Article Views (full-text article views including HTML views, PDF and ePub downloads, according to the available data) and Abstracts Views on Vision4Press platform.
Data correspond to usage on the plateform after 2015. The current usage metrics is available 48-96 hours after online publication and is updated daily on week days.
Initial download of the metrics may take a while.