Fig. 4
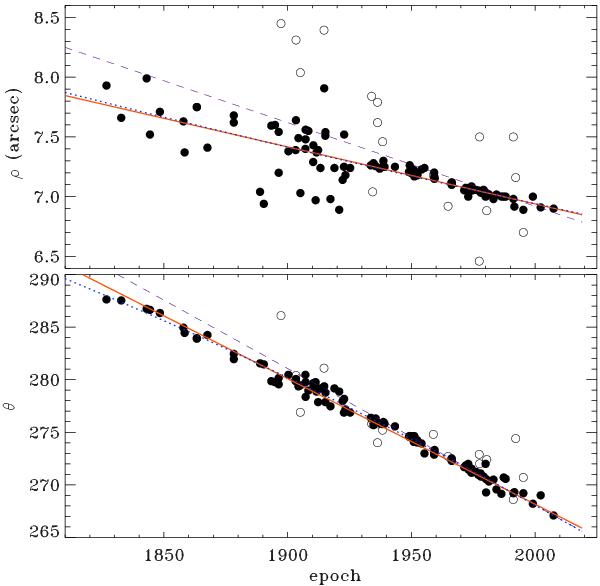
Upper panel: projected separation vs time for HD 106515. Bottom panel: position angle vs time. In both panels filled circles are the measurements kept in the fit and the empty circles are those removed as being outliers in either projected separation or position angle. In both panels, the red continuous line is the linear fit imposing a passage through Hipparcos measurement, the blue dotted line is the quadratic fit, the purple dashed line is the slope as measured from Hipparcos (baseline 3.25 yr; epoch 1991.25) extrapolated to the whole baseline of available data.
Current usage metrics show cumulative count of Article Views (full-text article views including HTML views, PDF and ePub downloads, according to the available data) and Abstracts Views on Vision4Press platform.
Data correspond to usage on the plateform after 2015. The current usage metrics is available 48-96 hours after online publication and is updated daily on week days.
Initial download of the metrics may take a while.