Free Access
Fig. 6
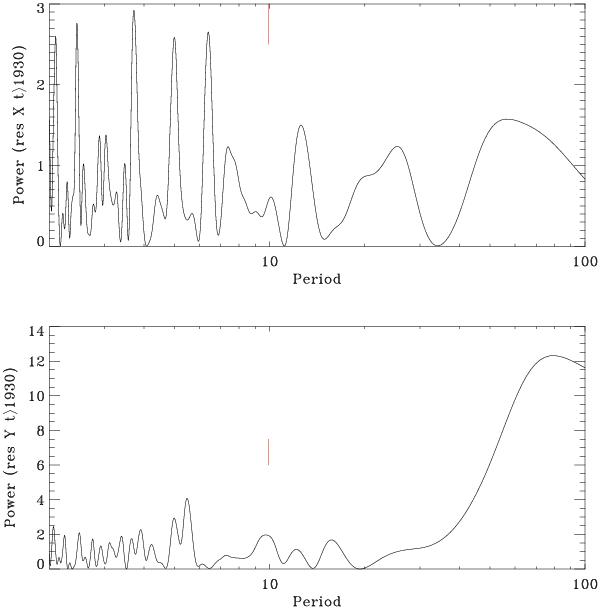
Lomb-Scargle periodogram of the residuals from full-data quadratic fit in X and Y coordinates. Only data after 1930 were considered because of their higher precision. The short vertical lines at 10 yr mark the RV period.
Current usage metrics show cumulative count of Article Views (full-text article views including HTML views, PDF and ePub downloads, according to the available data) and Abstracts Views on Vision4Press platform.
Data correspond to usage on the plateform after 2015. The current usage metrics is available 48-96 hours after online publication and is updated daily on week days.
Initial download of the metrics may take a while.