| Issue |
A&A
Volume 546, October 2012
|
|
|---|---|---|
| Article Number | A123 | |
| Number of page(s) | 15 | |
| Section | Stellar structure and evolution | |
| DOI | https://doi.org/10.1051/0004-6361/201118567 | |
| Published online | 17 October 2012 | |
Large distance of ε Aurigae inferred from interstellar absorption and reddening⋆,⋆⋆
1
Dept. of Astronomy & Astrophysics, Villanova
University,
800 E. Lancester Ave.,
Villanova,
PA,
19085
USA
e-mail: This email address is being protected from spambots. You need JavaScript enabled to view it.
2 Astronomical Institute of the Charles University, Faculty of
Mathematics and Physics, V Holešovičkách 2, 18000 Praha 8, Czech Republic
3
Hvar Observatory, Faculty of Geodesy, University of
Zagreb, 10000
Zagreb,
Croatia
4
Astronomical Institute, Academy of Sciences of the Czech
Republic, 25165
Ondřejov, Czech
Republic
Received: 2 December 2011
Accepted: 16 July 2012
Abstract
The long-period (P = 27.1 years) peculiar eclipsing binary ε Aur, which has recently completed its two year-long primary eclipse, has perplexed astronomers for over a century. The eclipse arises from the transit of a huge, cool and opaque, disk across the face of the F0 Iab star. One of the principal problems with understanding this binary is that the very small parallax of p = (1.53 ± 1.29) mas, implying a distance range of d ~ (0.4−4.0) kpc, returned by a revised reduction of the Hipparcos satellite observations, is so uncertain that it precludes a trustworthy estimate of the luminosities and masses of the binary components. A reliable distance determination would help solve the nature of this binary and distinguish between competing models.
A new approach is discussed here: we estimate the distance to ε Aur from the calibration of reddening and interstellar-medium gas absorption in the direction of the system. The distance to ε Aur is estimated from its measured E(B − V) and the strength of the diffuse interstellar band 6613.56 Å. Spectroscopy and UBV photometry of several B- and A-type stars (<1° of ε Aur) were carried out. The distances of the reference stars were estimated from either measured or spectroscopic parallaxes. The range in distances of the reference stars is from 0.2 to 3.0 kpc. We find reasonably tight relations among E(B − V), EW, and Ic (6613 Å feature) with distance. From these calibrations, a distance of d = (1.5 ± 0.5) kpc is indicated for ε Aur. If ε Aur is indeed at (or near) this distance, its inferred absolute visual magnitude of MV ≃ (− 9.1 ± 1.1) mag for the F-supergiant indicates that it is a very young, luminous and massive star. Noteworthy, the high luminosity inferred here is well above the maximum value of MV ≃ −6 2 expected for (less-massive) post asymptotic giant branch supergiant stars. Thus, based on the circumstantial evidence, the higher-mass model appears to best explain the properties of this mysterious binary system.
As a by-product of this study, our spectroscopy led to the finding that two of the stars used in the distance calibrations, HD 31617 and HD 31894, are newly discovered spectroscopic binaries, and HD 32328 is a new radial-velocity variable.
Key words: binaries: eclipsing / stars: AGB and post-AGB / stars: distances / stars: massive / stars: individual: eps Aurigae
Based on new spectral and photometric observations from the Hvar, Ondřejov and Tautenburg Observatories, the Four College Automatic Photoelectric Telescope and from the ESA Hipparcos satellite.
Appendices are available in electronic form at http://www.aanda.org
© ESO, 2012
Various determinations of the parallax of ε Aur.
1. Introduction
ε Aur (7 Aur, HR 1605, HD 31964) is a bright (V ≃ 30) single-line eclipsing binary with so far the longest known orbital period of 27.1 years (9890 3) (Ludendorff 1903; Stefanik et al. 2010; Chadima et al. 2010). The duration of the eclipse is almost 2 years and its last eclipse terminated by the end of August 2011. For the first time, interferometric observations carried out during the recent eclipse (see Kloppenborg et al. 2010) “imaged” the dark, flattened disk component transiting the F-supergiant star.
Two principal models of the system have been considered, often referred to as the high- and low-mass models (Guinan & DeWarf 2002, and references therein). Although they differ quite substantially from each other, the distances that follow from the rather uncertain Hipparcos parallax quoted in Table 1 do not allow to distinguish between the models from mainly luminosity considerations. In Table 1 we also summarize several other attempts to derive the parallax of ε Aur. The true nature of this unusual eclipsing binary remains a puzzle in spite of many attempts to explain its properties. As noted previously, one of the principal problems is that the very small parallax returned by the Hipparcos satellite is so uncertain that it precludes a trustworthy estimate of the luminosities and thus masses of the binary components. A reliable distance determination would help solve the nature of this binary and distinguish between the competing models that explain this extraordinary binary system.
According to the high-mass model, first considered by Kuiper et al. (1937) and later developed by Carroll et al. (1991), the F-supergiant component is a normal high mass/high luminosity Pop. I supergiant and its mysterious cool disk (+ star) companion is either a very young, high mass object that has accreted gas from the F-supergiant or a pre-Main Sequence star with circumstellar material.
In the low mass model, first suggested by Eggleton & Pringle (1985) and by Lambert & Sawyer (1986) and recently advocated by Hoard et al. (2010), the F-supergiant is a post-asymptotic giant branch (AGB) star, of low to moderate mass (initial mass ≈1−7 M⊙; final (current) mass <1.0 M⊙). In this model, the large, cool disk binary component resulted from the recent capture of gas from a prior large mass-loss/transfer phase from the F-supergiant.
Equatorial coordinates and spectral types of ε Aur and the calibration stars in its neighbourhood.
2. A methodology of the distance calibration
We initially selected three stars close in the sky to ε Aur, HD 31617, HD 31894, and HD 277197, because they all have similarly small space motions and reddening values as ε Aur itself. We thought that these stars, together with ε Aur, could be the brighter members of a young stellar association. Even though this could be the case, the errors in their proper motions and spectroscopic distance estimates preclude drawing definite connection. But if this were the case, this would imply a distance to ε Aur of about 1.1 kpc (see Table 10).
We decided to try an alternative approach to the problem. On the premise that the interstellar medium in the direction of ε Aur has similar properties as in the surrounding directions (within a few degrees around ε Aur) as projected onto the sky, we selected several stars closer than 1° to ε Aur in the sky (and accessible to the telescopes available to us) and obtained their spectra and UBV photometry. The list of these stars is in Table 2.
Infrared data from DIRBE/COBE (Schlegel et al. 1998) confirm that our assumption is valid – the calibration stars are located at positions, where the dust thermal emission (summed along the line of sight) is indeed comparable (see Fig. 1).
Using the data from the 2MASS catalogue, it is possible to calculate the ratio for all calibration stars (see Table 3). Comparison of these data with the values derived by Koornneef (1983) also clearly shows that the extinction of these stars is normal (cf. Table 4 of Johnson 1965).
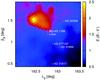 |
Fig. 1 Reddening E(B − V) computed from IR emission for extragalactic sources as a function of galactic coordinates. The data were taken from Schlegel et al. (1998). Our calibration stars and ε Aur are denoted by crosses. The values of E(B − V) range from 0.65 to 1.22 for the positions of the calibration stars (note that these are not E(B − V) for the stars themselves). The cloud visible in the north-east direction is the nebular region TGU H1105 (Dobashi et al. 2005). |
Comparison of the and reddening for our calibration stars in the neighbourhood of ε Aur.
Using the measured parallaxes or spectroscopically estimated distances to these stars, we attempted to derive two independent calibration relations: (1) the distance d as a function of the strength of the diffuse interstellar band (DIB) at 6613.56 Å, and (2) the distance d as a function of the E(B − V) reddening. The idea is to use these calibrations for a new estimate of the distance to ε Aur. It is worth noting that a smooth dependence of the reddening on the distance in the region near ε Aur has already been found by McCuskey (1949), based on photographic spectra and magnitudes. There are several studies of the strength and shape of the DIB at 6613 Å in the recent literature (cf., e.g. Jenniskens & Desert 1994; Galazutdinov et al. 2008; Hobbs et al. 2009; McCall et al. 2010) but we were unable to find any published calibration of this feature vs. distance. Munari et al. (2008) found a tight relation between the EW of another DIB at 8620.4 Å and E(B − V) and another, though a less perfect such relation was also published for the DIB at 5780.5 Å by McCall et al. (2010). The latter authors also found a very good correlation between the EWs of 6613.6 and 6196.0 DIBs. Unfortunately, none of these additional DIBs are covered by our spectra. The limited spectral resolution of our spectra may imply that our EWs only represent a lower limit to the true EW of the 6613 DIB but in the light of the above-mentioned studies we do believe that with a homogeneous series of the spectra taken with the same instrument a calibration of the 6613 DIB vs. distance within a limited area in the sky should be feasible.
Details of all spectral observations, their reduction and radial-velocity (RV hereafter) measurements can be found in Appendix A, while the photoelectric UBV observations and their reductions are described in Appendix B.
For each of the calibration stars we proceed as follows: (i) using the observed spectra, we derive Teff, log g by matching the synthetic spectra; (ii) using a modern stellar-evolution code, we determine the corresponding mass m ⋆ and luminosity L which enables us to compute the distance. We now describe the procedure in more details.
One of us, JN, has developed a program, which derives the optimal values of the effective temperature Teff, logarithm of the gravitational acceleration log g, projected rotational velocity vsini and RV via interpolation in a grid of synthetic spectra and minimalization of the sum of squares of O−C between the observed and interpolated synthetic spectrum. For multiple systems of N components, it also derives the relative luminosities of the components, preserving the constraint that  1. For practical applications, we used the grid of recent elaborated synthetic spectra published by Lanz & Hubeny (2007) (Bstar grid hereafter). We assumed a (fixed) value of metallicity Z = 0.04 corresponding to massive and consequently young stars.
Realistic uncertainties of the best-fit effective temperatures are of the order ΔTeff ≃ 1000 K for hot stars (with Teff ≳ 20 000 K) and down to 100 K for cooler stars (Teff ≲ 10 000 K). For log g we typically have an uncertainty of about Δlog g ≃ 0.5.
We also adopted Lanz & Hubeny (2007) bolometric corrections BC, interpolating for the optimal values of Teff and log g. Their BCs have a zero point defined by adopting the BC⊙ = −007. Following Torres (2010), we therefore adopted the observed Johnson V magnitude of the Sun, V⊙ = −2676 ± 003 and the distance modulus  . For a comparison with evolutionary models, it is therefore necessary to adopt
  .
.
To obtain reasonable estimates of the masses and bolometric magnitudes of the calibration stars, we used the stellar-evolution module MESAstar by Paxton et al. (2011)2. We took the optimal values of Teff and log g (with their uncertainties) from the modelling of synthetic spectra and we searched for the corresponding initial mass m ⋆ (range of masses) of the star for which evolutionary tracks are compatible with the parameters (log Teff,log g) inferred above. We assumed initial helium abundance Y = 0.320, metallicity Z = 0.040, and the mixing-length parameter α = 2.0.
As we shall see later, we usually obtain the values of log g = 4.0to4.5 which correspond to stars located at the main sequence. Note that main-sequence stars are neither very sensitive to the value of α nor to the selected wind scheme. The major source of uncertainty in m ⋆ is thus the uncertainty of the effective temperature Teff.
Given the values of m ⋆ and evolutionary tracks in the HR diagram (Teff,log L) for all calibration stars, we can easily take the luminosities log L or bolometric magnitudes Mbol = Mbol ⊙ − 2.5log L and determine the (spectroscopic) distances and their uncertainties.
In case the calibration star is a binary (as HD 31894) we can use the secondary as an independent check, with the mass ratio inferred from the RV curve being a strong additional constraint.
For the B9 Iab supegiant BD+43°1168, we adopted the unreddened ()0 index from the Johnson (1958) study. To obtain the dereddened V0 magnitudes of all considered stars, we adopted the formula from Chap. 15 of Cox (2000) (1)This way, our distance scale can contain a small systematic error but it should be internally consistent for all considered stars.
In the following sections, we first discuss the new observations and our detailed analyses of the individual calibration stars, then we establish the d(EW), d(Ic) and d(E(B − V)) calibrations, we derive appropriate 6613 Å line strengths and a range of E(B − V) values for ε Aur and finally apply them to ε Aur.
3. The B type binary HD 31894
HD 31894 (BD+43°1164, HIP 23375) was classified B2IV-V by Walborn (1971). Danziger et al. (1967) included HD 31894 in their study of stars in the neighbourhood of the hydrogen-poor star HD 30353 in an effort to derive the distance to it. They studied the RVs and equivalent widths of the interstellar Na I and also interstellar polarization as a function of the distance. For HD 31894, they obtained E() = 027 and adopted the distance modulus m − M = 10.8, but from their mean curve through the dependence of interstellar polarization on the distance modulus, the modulus of HD 31894 should be less than 9, while from their mean curve distance vs. equivalent width of the sodium D1 and D2 lines, the modulus should be about 9.3.
The absolute visual magnitude of HD 31894 was estimated from the measured equivalent width of the Hγ line in two studies: Petrie & Lee (1966) obtained MV = −17 while Walborn (1971) found MV = −29. Carnochan (1986) studied the interstellar 2200 Å feature for a number of stars including HD 31894, adopting the following UBV values from Deutschman et al. (1976):  To derive the fundamental properties of HD 31894 more precisely, we began observing the star spectroscopically with the Ondřejov 2-m telescope and photometrically with the 0.65-m reflector at Hvar and later also with the 0.75-m Four-College Automatic Photoelectric Telescope (APT). One echelle spectrogram was kindly obtained and preliminarily reduced for us by Dr. Holger Lehmann with the Tautenburg Observatory 2-m reflector on JD 2 455 670.3.
To our surprise, already the first spectrum showed that the object is a double-lined spectroscopic binary and the second spectrum revealed a RV separation of 300 km s-1 between the B2 primary and a secondary of some later B spectral subclass.
3.1. The orbital period and orbital solution
After accumulating some 12 spectra, we were able to find out that the correct orbital period must be slightly longer than 11 days. It also turned out that the orbit has a high eccentricity. We then used the program PHOEBE (Prša & Zwitter 2005, 2006) to derive the orbital solution which is presented in Table 4.
Dr. Alan H. Batten kindly found and communicated to us the mid-exposure times of the old DAO spectrograms, for which the RVs were derived by Petrie & Pearce (1961). We calculated the corresponding heliocentric Julian dates and reproduce these RVs also in Table A.2.
Orbital solution for HD 31894 derived in PHOEBE.
Orbital solution for the old DAO spectra of HD 31894 derived in PHOEBE.
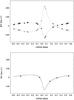 |
Fig. 2 Orbital radial-velocity curves of HD 31894 for the orbital period of 11 |
Keeping the orbital elements fixed from the solution for our new RVs, we derived a separate solution for the old RVs, deriving only the epoch of periastron and the systemic velocity. The result is in Table 5 and the corresponding RV curve is shown in the lower panel of Fig. 2. Assuming that 2159, 2160 or 2161 orbital cycles elapsed between the old and new periastron epoch, we obtain the following possible values of the orbital period: 110508, 110456, and 110405, respectively3. It is seen that after another season of observations, the accuracy of the orbital period derived from the new data would be sufficient to discriminate safely between the above three possible values of the orbital period. It is not clear, however, how significant the difference in the systemic velocity between the old and new RVs is. It is conceivable that some of the old RVs are actually slightly affected by the blending of the spectral lines of the primary and secondary. For the purpose of this study, we have not combined the old and new RVs to obtain a joint orbital solution. All subsequent discussion will be based on the orbital elements derived from the new spectra only – cf. Table 4 – and on the following ephemeris  (2)
(2)
3.2. Properties of the binary system and its components
Our photometric observations safely excluded the possibility of binary eclipses. This means that we are not able to obtain a unique solution and that some assumptions must be made. Nevertheless, the observational data we accumulated allow us to obtain reasonable estimates.
In spite of a limited number of available spectra, we tentatively disentangled them, using the KOREL program (Hadrava 1995, 1997, 2004b, 2005). It converged to a solution closely similar to that of Table 4 and provided the disentangled spectra of both binary components. For the final disentangling, we kept the orbital elements of Table 4 fixed and obtained the disentangled spectra in the following three spectral regions: 6327−6422 Å, 6422−6645 Å, and 6630−6750 Å. For the second region containing Hα, we also allowed KOREL to disentagle and remove the telluric lines.
Comparing the disentagled spectra of the primary and secondary normalized to the joint continuum of both stars with synthetic spectra from the Bstar grid using the program by JN, discussed above, we obtained the formally best fit for the following values:
Teff = 23 490 K, log g = 4.30, v sin i = 74.4 km s-1, L1 = 0.809,
and
Teff = 17 810 K, log g = 4.52, v sin i = 26.9 km s-1, L2 = 0.191
for the primary and secondary, respectively. A comparison of the disentangled spectra with the interpolated synthetic ones is shown in Fig. 3 for the primary and in Fig. 4 for the secondary. The value of log g of 4.5 [cgs] is too high even for the zero-age main sequences stars. We verified that fixing log g = 4.25 for both stars increases the χ2 of the fit by only 2 per cent, leading to lower Teff of 22 800 and 17 000 K for the binary components. This confirms our estimate of typical uncertainties mentioned earlier.
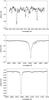 |
Fig. 3 A comparison of the disentangled line spectrum of the HD 31894 primary with a synthetic spectrum interpolated from the Bstar grid for Teff = 23 490 K, log g = 4.30 [cgs] and v sin i = 74.4 km s-1 in three spectral segments containing stronger stellar lines. In all cases, dots denote the observed spectrum, while the synthetic spectra, shifted for the systemic velocity of −2 km s-1, are shown as thin lines. A relative luminosity of the primary of L1 = 0.809 was adopted for the comparison. |
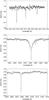 |
Fig. 4 A comparison of the disentangled line spectrum of the HD 31894 secondary with a synthetic spectrum interpolated from the Bstar grid for Teff = 17 810 K, log g = 4.52 [cgs] and v sin i = 26.9 km s-1 in three spectral segments containing stronger stellar lines. In all cases, dots denote the observed spectrum, while the synthetic spectra, shifted for the systemic velocity of −2 km s-1, are shown as thin lines. A relative luminosity of the secondary of L2 = 0.191 was adopted for the comparison. |
In the next step we used the stellar-evolution module MESAstar by Paxton et al. (2011) to reproduce the observed Teff and log g of the HD 31894 primary. Using the mass ratio from our orbital solution, we then estimated the range of masses for the secondary and calculated also its evolution to see how consistent the model and observed properties of the secondary will be for the same evolutionary age as for the primary. The evolutionary tracks are shown in Fig. 5.
We again used PHOEBE and, keeping the orbital elements fixed at the values of Table 4 but setting  , we included our UBV photometry and tuned the radii within reasonable limits to obtain the relative luminosity of the primary L1 = 0.81 in the V band. The fit with PHOEBE led to the following UBV magnitudes at maximum light
  Using these values and the relative luminosities in all three passbands derived with PHOEBE (0.81, 0.82, and 0.84 in V, B, and U, respectively), we obtained the UBV magnitudes of both stars, and their standard dereddening led to the values presented in Table 6. For illustration, the V-band light curve is shown in Fig. 6.
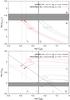 |
Fig. 5 Computed evolutionary tracks of both binary components of HD 31894 in a log g vs. Teff diagram and in the HR diagram. See the text for details. |
Dereddened magnitudes of both binary components based on the PHOEBE fit.
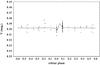 |
Fig. 6 Orbital V-band light curve of HD 31894 for the orbital period of 11 |
For the adopted range of effective temperatures of the primary from 23 000 to 24 000 K and of the secondary: 17 000−18 000 K, and estimating the range of bolometric magnitudes from the evolutionary calculations, one gets the ranges of the absolute visual magnitudes from −223 to −255 for the primary, and from −070 to −132 for the secondary. Combined with the dereddened V0 magnitudes from Table 6 this gives the range of distances 1037−1202 pc for the primary, and 1066−1420 pc for the secondary. Weighting more the values for the primary, we adopt d = 1150 ± 150 pc for the distance of the HD 31894 binary.
The radii we used in PHOEBE to fit the relative luminosities in the V band are 
4. The B star HD 31617
A relatively little studied B star HD 31617 (BD+43°1147, HIP 23186) is another object close to ε Aur in the sky. It was classified as B2IV by Hiltner (1956), who also obtained the following UBV values  while Bouigue (1959) obtained
  as a mean of 3 individual observations. Plaskett & Pearce (1931) obtained 4 RVs at the Dominion Astrophysical Observatory (DAO) in 1924−1929 with a mean value of +3.5 km s-1 and a range over 10 km s-1. The new reduction of the Hipparcos data by van Leeuwen (2007a,b) resulted in a negative value of the parallax. Therefore, no reliable trigonometrically measured distance to HD 31617 is available. However, Danziger et al. (1967) studied several stars near the hydrogen-poor star HD 30353 in an effort to derive its distance modulus via polarization mesurements by Hiltner and via the strength of the Na I interstellar line. For HD 31617, they obtained a modulus of 9.6 mag from polarimetry, and 10.0 mag from the strength of the interstellar lines, which implies distances of 832 and 1000 pc, respectively. Savage et al. (1985) investigated excess ultraviolet extinction for a number of B stars and did not find any for HD 31617.
We obtained 13 individual standard UBV observations at Hvar. The star was also used as a check star for observations of HD 31894 at Villanova and 34 UBV observations were secured. There are also 97 Hp observations secured by the Hipparcos satellite (Perryman & ESA 1997). None of these datasets show any significant light variability of this star. The mean standard Hvar values are in Table 9.
We succeded to secure 10 red Ondřejov spectra. The RV measurements of four good and sharp lines in SPEFO soon showed that the object is another single-line spectroscopic binary, for which we tentatively estimate an orbital period of about 60 d and a highly eccentric orbit. We use the inverse square of the rms errors of the mean RV of the four measured lines (Hα, He I 6678 Å and the C II doublet at 6578 & 6582 Å) for each measured spectrum to derive the weights of individual mean RVs. Our RV measurements, together with the low rms errors (mostly below 0.5 km s-1) are reproduced in detail in Table A.3. We also tabulate there the old DAO RVs, for which we derived the heliocentric Julian dates. Regrettably, their phase distribution does not allow to improve the value of the orbital period. A preliminary orbital solution derived with the program FOTEL (Hadrava 1990, 2004a) are presented in Table 7.
Orbital solution for HD 31617 derived in FOTEL.
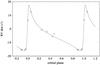 |
Fig. 7 Orbital radial-velocity curves of HD 31617 for the orbital period of 59 |
We disentangled the spectrum of the primary with KOREL and the comparison with the Bstar grid returned the following values: ![Mathematical equation: \begin{eqnarray*} T_{\rm eff} = 24\,519\,{\rm K},\ {\rm log}~g = 3.863\,[{\rm cgs}],\ {\rm and}\ v\,\sin\,i = 32.3\,{\rm km\,s}^{-1}. \end{eqnarray*}](/articles/aa/full_html/2012/10/aa18567-11/aa18567-11-eq126.png) A comparison of the disentangled spectrum with the synthetic one is in Fig. C.1 in Appendix C. Evolutionary tracks bracketing the above values are shown in Fig. C.4 in Appendix C. They imply the mass of the HD 31617 primary in the range of 9.5 to 15 M⊙, the bolometric magnitude between −436 and −736 and the absolute visual magnitude between −206 and −488. Together with V0 = 661 (see Table 9) this implies a distance in the range from 540 to 1990 pc.
A comparison of the disentangled spectrum with the synthetic one is in Fig. C.1 in Appendix C. Evolutionary tracks bracketing the above values are shown in Fig. C.4 in Appendix C. They imply the mass of the HD 31617 primary in the range of 9.5 to 15 M⊙, the bolometric magnitude between −436 and −736 and the absolute visual magnitude between −206 and −488. Together with V0 = 661 (see Table 9) this implies a distance in the range from 540 to 1990 pc.
5. The B star HD 32328
Also rather neglected, HD 32328 (BD+43°1177, HIP 23603) is another object close to ε Aur in the sky. It was classified as B8V in an objective prism survey by Duflot et al. (1957) and its only measured RV = +21 km s-1 also comes from such a survey (Fehrenbach et al. 1996). It has a rather accurate parallax of 0 00612 ± 000159 from the Hipparcos mission (van Leeuwen 2007a,b). Deutschman et al. (1976) obtained the following standard UBV values
  derived
  and estimated a distance of 336 pc. For comparison, the measured Hipparcos parallax implies a range of distances from 130 to 207 pc.
We obtained 10 red Ondřejov spectra and 10 individual UBV observations at Hvar. The Hvar photometry agrees well with that by Deutschman et al. (1976, see Table 9) and our value of the reddening is  . The dereddened colours indicate a normal main-sequence object between B7 and B8.
Radiative parameters and projected rotational velocity of HD 32328 resulting from the fit of the three Ondřejov spectra with the highest S/N by interpolated synthetic spectra.
UBV photometry of calibration stars and their dereddened values.
Radial-velocity measurements of the sharp Hα absorption core in our spectra (see Table A.4) show small variations with a full range of 8 km s-1 and a possible timescale of 6.8 days. This means that also this object could be a single-line spectroscopic binary seen nearly pole-on (unless the component masses are strongly peculiar), but it is also conceivable that it is a rotating star with uneven brightness distribution or even an unusual pulsating star. The time distribution of our spectral, as well as photometric, observations is unsufficient to test such hypotheses, however. We can only state that no trace of a secondary spectrum is visible, therefore a comparison of the observed and synthetic spectra seems justified.
Since HD 32328 is cooler than the lower Teff limit of the B star grid of synthetic spectra by Lanz & Hubeny (2007), we had to interpolate in the grid of synthetic spectra from the POLLUX database (Palacios et al. 2010), based on Kurucz’s models. For the comparison we selected three spectra with the highest signal-to-noise ratios (S/N). The results are summarized in Table 8 and characterize the uncertainty of the fit. The comparison of model fits with these three spectra is shown in Fig. C.2 in Appendix C. Note that without being able to apply KOREL in this case, we could not remove the telluric lines from the observed spectra.
The corresponding evolutionary tracks are shown in Fig. C.5 in Appendix C. They imply a mass between 3.4 and 4.5 M⊙,  to −198,
  , which with
  (Table 9) implies a distance between 270 and 540 pc. In contrast to it, the range of the distance following directly from the Hipparcos parallax is (175 ± 45) pc. The question is whether HD 32328 is not indeed a binary composed from two similarly bright stars observed pole-on. In any case, we use the lower limit of the Hipparcos measurements and the upper limit of the spectroscopic distance as the range of possible distances to HD 32328.
6. The B star HD 277197
HD 277197 (BD+43°1161;  ) is a little studied B star. It is classified as B1 IV by Bouigue (1959) and B5 by McCuskey (1959) but no MKK classification was published. The only photometry was published by Bouigue (1959), who obtained
  We secured three red spectra of it with the Onřejov 2-m reflector and 31 individual UBV observations during 2011 and 2012 at Hvar.
Since the clouds interrupted the exposure of the first spectrum, it has a S/N = 42 only. However, the remaining two are well exposed and permit a comparison with the synthetic spectra. The mean RV of the Hα and He i 6678 Å lines from all three spectra is −3.4 ± 0.7 km s-1, rather similar to both ε Aur and the HD 31894 binary. When comparing the second and third spectra to the synthetic spectra from the B star grid of Lanz & Hubeny (2007, see Fig. C.3 in Appendix C), we found that the best fit is obtained for ![Mathematical equation: \begin{eqnarray*} T_{\rm eff} = 17\,750\,{\rm K}, \ \log\,g = 4.459\,[{\rm cgs}], \ {\rm and} \ v\,\sin\,s = 44.7\,{\rm km\,s}^{-1}\!. \end{eqnarray*}](/articles/aa/full_html/2012/10/aa18567-11/aa18567-11-eq139.png) The differential Hvar UBV photometry did not reveal any variability during two seasons. We therefore derived robust mean values from all 31 individual observations to obtain
The differential Hvar UBV photometry did not reveal any variability during two seasons. We therefore derived robust mean values from all 31 individual observations to obtain  , = 0063 ± 0.002, and = −0547 ± 0.003.
A standard dereddening gives  Both the derredened magnitudes and the Teff deduced from the observed spectra agree with a spectral type near B3.
Evolutionary tracks modelling the results of the comparison of the observed and synthetic spectra are shown in Fig. C.6 in Appendix C and imply a mass of 5.5 to 6.7 M⊙, Mbol between −249 and −350, MV between −092 and −181 and for  the spectroscopic distance from 820 to 1230 pc.
7. The field star BD+43°1168
The B9 Iab supergiant BD+43°1168 (ADS 3605E) is the closest to ε Aur in the sky from the stars considered here. The spectral classification was derived by Morgan et al. (1955), while its RV = −22 km s-1 was measured by Münch (1957). The UBV photometry was derived by Hiltner (1956) as  while Fernie (1983) obtained
  as a mean of 3 individual observations.
The mean of 9 UBV observations secured at Hvar is ![Mathematical equation: \begin{eqnarray*} && V = 9\fm395 \pm 0\fm006,\\[1.5mm] && B\!-\!V = 0\fm918 \pm 0\fm007,\\[1.5mm] && U\!-\!B = 0\fm276\pm0\fm004. \end{eqnarray*}](/articles/aa/full_html/2012/10/aa18567-11/aa18567-11-eq149.png) The above three determinations of UBV magnitudes differ a bit more than what one would expect. In Fig. 8 we reproduce a part of the better exposed spectrum of the star. From a comparison with a spectrum of another B9Iab star σ Cyg taken with the same instrumentation, one can suspect the presence of a weak emission in the Hα line of BD+43°1168. From analogy with other emission-line stars, a slight secular variability of BD+43°1168 cannot therefore be excluded.
The above three determinations of UBV magnitudes differ a bit more than what one would expect. In Fig. 8 we reproduce a part of the better exposed spectrum of the star. From a comparison with a spectrum of another B9Iab star σ Cyg taken with the same instrumentation, one can suspect the presence of a weak emission in the Hα line of BD+43°1168. From analogy with other emission-line stars, a slight secular variability of BD+43°1168 cannot therefore be excluded.
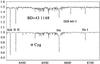 |
Fig. 8 A comparison of the Ondřejov red spectrum of BD+43°1168 taken on HJD 2 456 008.3159 with a spectrum of another B9Iab star σ Cyg, taken with the same instrumentation and kindly put at our disposal by Dr. M. Kraus. Note the strong 6613.56 Å interstellar line in the spectrum of BD+43°1168 and its faint Hα profile, obviously partly filled by emission. |
According to Johnson (1958), the intrinsic colours of a B9Iab supergiant are = +002 and = −052. This implies E(B − V) = 090 for Hiltner’s and our Hvar values, and E(B − V) = 093 for the values published by Fernie. From this, one then obtains the derredened V0 magnitude from formula (1) to be 639 and 637, repectively. The absolute visual magnitude of a B9Iab supergiant is expected to be −62 (Cox 2000) to −64 (Straizys & Kuriliene 1981), which with the above estimated V0 range implies a distance to BD+43°1168 between 3.27 and 3.61 kpc.
Our measured value of EW(6613) = 0.230 ± 0.020 Å is in good agreement with a published value of 0.20 Å (Bromage & Nandy 1973).
8. Inferred calibration relations
We plot the distance calibrations based on the data for calibration stars in the neighbourhood of ε Aur in the sky (see Table 10) in Fig. 9. One can see that all three calibrations d(EW), d(Ic), d(E(B − V)) are well-defined and they are consistent with each other: ![Mathematical equation: \begin{eqnarray} && d({\rm EW}) = (1.474\pm0.028) \times 10^4\, {\rm EW}, \\[1.5mm] && d\left(I_{\rm c}\right) = (-2.027\pm0.171) \times 10^4\, \left(1-I_{\rm c}\right), \\[1.5mm] && d(E(B-V)) = (3.888\pm0.089) \times 10^3\, E(B-V). \end{eqnarray}](/articles/aa/full_html/2012/10/aa18567-11/aa18567-11-eq154.png) \arraycolsep1.75ptAlso note that these calibrations are not dependent on any outliers. For example, if we drop the most distant star (BD+43 1168) and extrapolate linearly from the remaining data we would obtain equivalent results for the distances in the 1000 to 2000 pc range.
\arraycolsep1.75ptAlso note that these calibrations are not dependent on any outliers. For example, if we drop the most distant star (BD+43 1168) and extrapolate linearly from the remaining data we would obtain equivalent results for the distances in the 1000 to 2000 pc range.
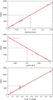 |
Fig. 9 Calibrations of the distance and a function of the strength of the diffuse interstellar 6613.56 Å line and of the reddening. The solid gray lines show the mean EW, Ic, and values of ε Aur and the corresponding distance, the dotted lines indicate the range of uncertainties. |
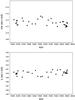 |
Fig. 10 Time plots of the equivalent width (EW) and central intensity (Ic) of the 6613.56 Å diffuse interstellar line measured on a representative sample of the Ondřejov CCD spectra over the time interval from 2006 to 2012. No significant change during the 2009−2011 primary eclipse (RJD 55 050 to 55 800) is observed, which corroborates the conclusion that the line is of a truly interstellar (not partly cirmcumstellar) origin. |
9. Measured and deduced properties of ε Aur
It is not quite straightforward to derive a reliable reddening of ε Aur since its brightness and colours undergo cyclic physical variations on a time scale of some 50 to 120 days (cf., e.g. Chadima et al. 2011). An inspection of the existing 107 individual Hvar standard UBV observations secured prior and after the recent eclipse of ε Aur shows that the observed is in the range between 051 and 057. Since the true nature of the physical variations is not known, we consider the mean value of = 054 as well as both extremes. There is also some uncertainty regarding the effective temperature of the ε Aur F primary. From a rather detailed line-profile modelling, Bennett et al. (2005) derived 7000 K, while Sadakane et al. (2010) and Chadima et al. (2011) arrived at 8000 K. Modelling the energy distribution, Hoard et al. (2010) used 7750 K for the F primary. Using again the calibration between the effective temperature and intrinsic colour, one arrives at ()0 between +016 and +030 for the calibration by Flower (1996), while Johnson (1958) gives ()0 = +0.23 for F0I stars. So the total range of E(B − V) to be considered as appropriate for ε Aur is 025 to 044. It should be noted that a small contribution to the observed reddening could arise from circumbinary dust. However, the large grain size indicated by the models (cf., e.g. Budaj 2011) and lack of variations in the diffuse interstellar band indicate that this contribution is probably insignificant.
Estimated distances, strength of the 6613.56 Å interstellar line and the reddening for all calibration stars.
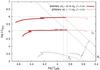 |
Fig. 11 Evolutionary tracks computed for ε Aur in the HR diagram. We show the evolution from the zero-age main sequence. The thin lines correspond to the observed effective temperatures, radii and luminosities of ε Aur. The range of masses are indicated in the legend. We also plot the evolutionary track for a lower-mass star (mini = 7 M⊙) for comparison as a dotted line. It never reaches the observed luminosity, even in the post-AGB phase. The post-AGB evolution track (not shown in the plot) is nearly horizontal (at nearly a constant log L/L⊙ ~ 4.4) as the star moves to the hotter (left) in the diagram. |
We measured the equivalent width (EW) and central intensity (Ic) of the 6613.56 Å diffuse interstellar line in a representative selection of the Ondřejov spectra secured from 2006 to 2012, including the spectra taken during the 2009−2011 eclipse. Both these measured quantities are plotted vs. time in Fig. 10. One can see that there is no noticeable difference in the strength of the line between the eclipse and out-of-eclipse data. This indicates in our opinion that the line is of truly interstellar, not partly circumstellar origin and can be used as a distance indicator.
In Fig. 9 we can see that all three distance calibrations are consistent and put ε Aur very clearly at a distance larger than about 900 pc. Considering the calibration results, we estimate the most probable distance to ε Aur to be about (1500 ± 500) pc. Its uncertainty is mostly caused by the dispersion of Ic and E(B − V) observed for ε Aur.
Stencel et al. (2008) derived the angular diameter of the F primary of ε Aur out of eclipse to be between 2.16 and 2.38 mas. For the distance of (1500 ± 500) pc this implies the F star radius of 232 to 512 R⊙. The corresponding range of absolute visual magnitudes of ε Aur is then  . This seems to speak in favour of the high-mass model for ε Aur and identifies its primary as a relatively young object.
Indeed, the evolutionary tracks computed by the MESAstar module show that the allowed range of masses is 20 to 50 M⊙ (see Fig. 11). We assumed initial helium abundance Y = 0.320 and metallicity Z = 0.040, the mixing-length parameter α = 2.0, scheme for the wind by Reimers (1975) in the red giant branch (RGB) and by Blöcker (1995) in the AGB phase, respectively, with the efficiencies η = 1.0. We used Z = 0.04 for consistency with all investigated calibration (supposedly young) stars since the true evolutionary stage of ε Aur is still not clear. We have verified, however, that the inferred mass range is not sensitive to the selected value of metallicity. Even with solar-like values Z = 0.016−0.020 and Y = 0.28, the evolutionary tracks are not significantly different, only the timescale is prolonged by approximately 6%. In this model, the star has evolved away from the main sequence and is in the evolutionary stage when the central hydrogen abundance dropped to zero and the star consequently moves to lower effective temperatures. For the 20 M⊙ star, the star has already ignited the helium in the core so that the change in Teff is much slower than for the 50 M⊙ model. For this reason, we consider the lower mass of 20 M⊙ as more probable than the higher one. Note that the total mass loss is not important yet (less than 1% of the initial mass) and the selected wind parametrisation thus does not affect results significantly.
This is to be compared to the previous results of van Winckel (2003) who estimated the maximum luminosity for post-AGB supergiants, i.e. stars with initial masses lower than ~7 M⊙, to be log L/L⊙ ≈ 4.4 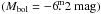 which is well below the value estimated in this work. We thus conclude that the lower-mass model of ε Aur does not fulfill observational constraints.
Formally, it is also possible to reproduce the observed properties of ε Aur assuming that it is a pre-main sequence star with mass from 30 to 70 M⊙ but this interpretation seems improbable since the evolution is so fast that the changes should be seen in the recorded history of the star, which is not the case (cf., e.g. Johnston et al. 2012).
If the high-mass model is confirmed, the future works should clarify whether the dark disk around the secondary could be formed by a strong wind from the F-supergiant primary. Since the current wind of the F supergiant appears too weak to sustain such a disk, one viable possibility is that prior to becoming an F supergiant, the star could have undergone a luminous blue variable (LBV) phase, in which a carbon rich super-wind was accreted by the secondary star. Note that the revision of the ε Aur distance can have far reaching consequences also on some other results. For instance, the energy distributions derived by Hoard et al. (2010) and Hoard et al. (2012) need to be reconsidered (as also pointed to us by Bennett 2012, priv. comm.).
10. Prospects for future work
Note also that ε Aur is catalogued as a little studied multiple star system (ADS 3605 ABCDE). The components ADS 3605B, C, and D are relatively faint and are located at 23, 45, and 47 arcsec from ADS 3605A = ε Aur and have the V magnitudes of +140, +1126, and +120, respectively (Aitken & Doolittle 1932). Because ε Aur lies very close to the galactic plane (b = +1.18°), it is possible that at least one or all of these putative faint components are field stars. For example ADS 3605C = BD+43°1166C has a published = +183 (Lutz & Lutz 1977), which indicates that it may be a dM foreground star4. It would be important to secure spectroscopy and UBV photometry of these companions to determine if any of them is a physical companion to ε Aur. This would provide a more definite distance check. No doubt the observations of these close companions to ε Aur will be challenging due to the brightness of ε Aur itself (V ≃ +30). (In the field of the 2-m telescope, these stars have always been outshone by ε Aur itself and obtaining their spectra there is out of the question.) But their observations could readily be accomplished with current equipment using adaptive optics, coronagraph-equipped telescopes or interferometric nulling methods used for exoplanets. It would be worth the effort to learn more about the distance to ε Aur and, consequently about its true nature.
In conclusion, the present study offers strong (but circumstantial) evidence that ε Aur is at a distance of 1.0−2.0 kpc. This favours a high luminosity and radius for the F-supergiant and therefore supports ε Aur as being a massive binary system, younger than about 7 × 10⁶ yr. Note that additional arguments supporting this interpretation were recently provided by Johnston et al. (2012). But nothing seems to come easy in the study of ε Aur. And as the concluding remarks of many previous papers on ε Aur typically state: More work is needed to finally unravel numerous mysteries and puzzles of this fascinating and intriguing eclipsing binary.
Online material
Appendix A: Details of spectroscopic observations and their analyses
With one exception, all spectra used in this study were secured in the coudé focus of the Ondřejov 2.0-m reflector and a 702-mm focal length camera with a SITe-005 800 × 2000 CCD detector covering the wavelength region 6260−6760 Å. The spectra have a linear dispersion 17.2 Å mm-1 and a 2-pixel resolution R ~ 12 600 (~11−12 km s-1 per pixel). With one exception, their S/N is at least 100 or better. The journal of observations of all stars is in Table A.1.
Journal of spectral observations of ε Aur and the calibration stars in its neighbourhood.
Individual RVs of HD 31894 for the primary from the old photographic spectra and the RVs of the primary and secondary from the new electronic spectra measured via Gaussian fits.
Individual DAO and Ondřejov RVs of HD 31617.
Individual Ondřejov RVs of HD 32328 measured in SPEFO on the sharp core of Hα.
For HD 31894, one echelle spectrogram (4700−7085 Å, 2-pixel resolution of 63 000) was kindly obtained for us by Dr. Holger Lehmann with the Tautenburg Observatory 2-m reflector on JD 2 455 670.3. Dr. Lehmann also kindly carried out the initial reductions of that spectrogram (bias subtraction, flat-fielding, order merging and wavelength calibration) in IRAF. Similar initial reductions of all Ondřejov spectrograms were carried out by MŠ, also in IRAF. The final reductions and RV measurements were carried out by PH in the program SPEFO, written by the late Dr. J. Horn and further developed by Dr. P. Škoda and Mr. J. Krpata (Horn et al. 1996; Škoda 1996). In SPEFO, one derives the RVs via sliding the direct and flipped image of a line profile until a perfect match is obtained. We also measured a selection of good telluric lines to use them to a fine correction of the RV zero point for each spectrogram. After these corrections, the final RVs for HD 31894 were derived via a Gaussian fit of the He i 6678 Å line profile by PM. All individual RVs of HD 31894 are in Table A.2.
Appendix B: Photometry
The calibrated Hvar UBV observations of ε Aur and all calibration stars were obtained differentially relative to the comparison star λ Aur, used as the primary comparison by most observers of ε Aur. HR 1644 served as the check star. All observations were carefully reduced to the standard Johnson system via non-linear transformation formulae (Harmanec et al. 1994) using the latest rel.17 of the program HEC225. The more recent versions of HEC22 allow monitoring and modelling the variations of the atmospheric extinction during observing nights. The following mean Hvar all-sky values for λ Aur were added to the respective magnitude differences var-comp and check-comp:  The Villanova APT differential UBV observations of HD 31894 were secured relative to HR 1644 and reduced via a standard APT pipeline. The standard Hvar all-sky values for HR 1644
  were added to the magnitude differences var-comp. The journal of photometric observations is in Table B.1.
Journal of UBV observations of ε Aur and the calibration stars in its neighbourhood.
Appendix C: Model fits
Here, we present a comparison of the disentangled spectrum of HD 31617 and the observed spectra of HD 32328 and HD 277197 with the best-fit interpolated synthetic spectra in Figs. C.1−C.3, respectively. For the same stars, we also show the evolutionary tracks calculated in such a way to fit the Teff and log g deduced from the observed spectra – see Figs. C.4−C.6, respectively.
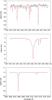 |
Fig. C.1 A comparison of the disentangled red spectrum of HD 31617 (black lines) with the model spectrum (red lines). |
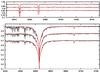 |
Fig. C.2 A comparison of three individual Ondřejov spectra of HD 32328 (black lines) having the highest S/N with the model spectra (red lines). From top to bottom, the spectra were taken on RJD 56 011.4508, 56 013.4003, and 56 015.2794, respectively. Note that we could not remove the telluric lines from the observed spectra in this case. |
 |
Fig. C.3 A comparison of two individual Ondřejov spectra of HD 277197 (black lines) with the model spectra (red lines). From top to bottom, the spectra were taken on RJD 55 833.4303 (top two plots) and RJD 55 837.4985 (bottom two plots). Note that the telluric and interstellar lines were not removed from the observed spectra in this case. |
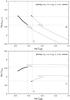 |
Fig. C.4 Computed evolutionary tracks of the primary of HD 31617 in a log g vs. Teff diagram and in the HR diagram. See the text for details. |
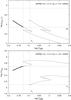 |
Fig. C.5 Computed evolutionary tracks of HD 32328 in a log g vs. Teff diagram and in the HR diagram. See the text for details. |
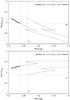 |
Fig. C.6 Computed evolutionary tracks of HD 277197 in a log g vs. Teff diagram and in the HR diagram. See the text for details. |
By the relative luminosity we understand as usually the ratio  (j = 1...N) of the luminosities of individual components measured in physical units (outside the eclipses for the eclipsing systems).
The latest release 3918 from April 2012.
Note that propagating the errors of both epochs does alter the quoted period values only on the fourth decimal digit.
The differential UBV observations of this star secured at Hvar (12 individual observations in 5 nights) give  , = 0714 ± 0021, and = 0319 ± 0012. However, these observations were challenging and strongly require independent verification.
The whole package containing the program HEC22 and other programs for complete photometric reductions, sorting and archiving the data, together with a very detailed User manual, is freely available at http://astro.troja.mff.cuni.cz/ftp/hec/PHOT.
Acknowledgments
We are grateful to Dr. H. Lehmann, who kindly obtained and reduced one echelle spectrum of HD 31894 for us, to Dr. A. H. Batten, who communicated to us the exact mid-exposure times of the four older DAO photographic spectra of HD 31894, and to Dr. Michaela Kraus for her permission to show here a plot of 1 Ondřejov spectrogram of σ Cyg, which she obtained. We acknowledge the use of the public version of the programs FOTEL and KOREL written by Dr. P. Hadrava and the grid of synthetic spectra of B stars made publicly available by Hubeny and Lanz. We thank an anonymous referee for the tough but justified, fair and constructive criticism of the first version of this study and additonal useful suggestions to the second version, which led us to re-do the whole paper and hopefully strengthen the arguments in favour of a larger distance to ε Aur. Useful discussions on the subject with Dr. S. S. Shore are also gratefully acknowledged. We profitted from the use of the bibliography maintained by the NASA/ADS system and the CDS in Strasbourg. The Czech authors were supported by the grant P209/10/0715 of the Czech Science Foundation and also from the research programs AV0Z10030501 and MSM0021620860. The US authors are very grateful for support of this work from NASA Grants NNX09AAH28G + GO-12302.01 and NSF/RUI Grants AST-0507542 + AST-1009903.
References
- Adams, W. S., & Joy, A. H. 1917, ApJ, 46, 313 [NASA ADS] [CrossRef] [Google Scholar]
- Aitken, R. G., & Doolittle, E. 1932, New general catalogue of double stars within 120 of the North pole, Carnegie institution of Washington, Washington, D.C. [Google Scholar]
- Bennett, P. D., Ake, T. B., & Harper, G. M. 2005, BAAS, 37, 495 [NASA ADS] [Google Scholar]
- Blöcker, T. 1995, A&A, 297, 727 [NASA ADS] [Google Scholar]
- Bouigue, R. 1959, Annales de l’Observatoire Astron. et Meteo. de Toulouse, 27, 47 [NASA ADS] [Google Scholar]
- Bromage, G. E., & Nandy, K. 1973, A&A, 26, 17 [NASA ADS] [Google Scholar]
- Budaj, J. 2011, A&A, 532, L12 [NASA ADS] [CrossRef] [EDP Sciences] [Google Scholar]
- Carnochan, D. J. 1986, MNRAS, 219, 903 [NASA ADS] [Google Scholar]
- Carroll, S. M., Guinan, E. F., McCook, G. P., & Donahue, R. A. 1991, ApJ, 367, 278 [NASA ADS] [CrossRef] [Google Scholar]
- Chadima, P., Harmanec, P., Yang, S., et al. 2010, IBVS, 5937, 1 [NASA ADS] [Google Scholar]
- Chadima, P., Harmanec, P., Bennett, P. D., et al. 2011, A&A, 530, A146 [NASA ADS] [CrossRef] [EDP Sciences] [Google Scholar]
- Cox, A. N. 2000, Allen’s Astrophysical Quantities, 4th edition, ed. by A. N. Cox (New York: AIP Press and Springer) [Google Scholar]
- Danziger, I. J., Wallerstein, G., & Böhm-Vitense, E. 1967, ApJ, 150, 239 [NASA ADS] [CrossRef] [Google Scholar]
- Deutschman, W. A., Davis, R. J., & Schild, R. E. 1976, ApJS, 30, 97 [NASA ADS] [CrossRef] [Google Scholar]
- Dobashi, K., Uehara, H., Kandori, R., et al. 2005, PASJ, 57, 1 [Google Scholar]
- Duflot, M., Fehrenbach, C., Guillaume, J., & Ray, G. 1957, Publications of the Observatoire Haute-Provence, 4, 11 [NASA ADS] [Google Scholar]
- Eggleton, P. P., & Pringle, J. E. 1985, ApJ, 288, 275 [NASA ADS] [CrossRef] [Google Scholar]
- Fehrenbach, C., Duflot, M., Genty, V., & Amieux, G. 1996, Bulletin d’Information du Centre de Données Stellaires, 48, 11 [Google Scholar]
- Fernie, J. D. 1983, ApJS, 52, 7 [NASA ADS] [CrossRef] [Google Scholar]
- Flower, P. J. 1996, ApJ, 469, 355 [NASA ADS] [CrossRef] [Google Scholar]
- Galazutdinov, G. A., LoCurto, G., & Krełowski, J. 2008, ApJ, 682, 1076 [NASA ADS] [CrossRef] [Google Scholar]
- Guinan, E. F., & DeWarf, L. E. 2002, in Exotic Stars as Challenges to Evolution, eds. C. A. Tout, & W. van Hamme, ASP Conf. Ser., 279, 121 [Google Scholar]
- Hadrava, P. 1990, Contributions of the Astronomical Observatory Skalnaté Pleso, 20, 23 [Google Scholar]
- Hadrava, P. 1995, A&AS, 114, 393 [NASA ADS] [Google Scholar]
- Hadrava, P. 1997, A&AS, 122, 581 [NASA ADS] [CrossRef] [EDP Sciences] [Google Scholar]
- Hadrava, P. 2004a, Publ. Astron. Inst. Acad. Sci. Czech Rep., 92, 1 [Google Scholar]
- Hadrava, P. 2004b, Publ. Astron. Inst. Acad. Sci. Czech Rep., 92, 15 [Google Scholar]
- Hadrava, P. 2005, Ap&SS, 296, 239 [NASA ADS] [CrossRef] [Google Scholar]
- Harmanec, P., Horn, J., & Juza, K. 1994, A&AS, 104, 121 [NASA ADS] [Google Scholar]
- Heintz, W. D., & Cantor, B. A. 1994, PASP, 106, 363 [NASA ADS] [CrossRef] [Google Scholar]
- Hiltner, W. A. 1956, ApJS, 2, 389 [NASA ADS] [CrossRef] [Google Scholar]
- Hoard, D. W., Howell, S. B., & Stencel, R. E. 2010, ApJ, 714, 549 [Google Scholar]
- Hoard, D. W., Ladjal, D., Stencel, R. E., & Howell, S. B. 2012, ApJ, 748, L28 [NASA ADS] [CrossRef] [Google Scholar]
- Hobbs, L. M., York, D. G., Thorburn, J. A., et al. 2009, ApJ, 705, 32 [NASA ADS] [CrossRef] [Google Scholar]
- Horn, J., Kubát, J., Harmanec, P., et al. 1996, A&A, 309, 521 [NASA ADS] [Google Scholar]
- Jenniskens, P., & Desert, F.-X. 1994, A&AS, 106, 39 [NASA ADS] [Google Scholar]
- Johnson, H. L. 1958, Lowell Observatory Bulletin, 4, 37 [NASA ADS] [Google Scholar]
- Johnson, H. L. 1965, ApJ, 141, 923 [NASA ADS] [CrossRef] [Google Scholar]
- Johnston, C., Guinan, E. F., Harmanec, P., & Mayer, P. 2012, in AAS Meeting Abstracts, 219, 153.34 [Google Scholar]
- Koornneef, J. 1983, A&A, 128, 84 [NASA ADS] [Google Scholar]
- Kuiper, G. P., Struve, O., & Strömgren, B. 1937, ApJ, 86, 570 [NASA ADS] [CrossRef] [Google Scholar]
- Lambert, D. L., & Sawyer, S. R. 1986, PASP, 98, 389 [NASA ADS] [CrossRef] [Google Scholar]
- Lanz, T., & Hubeny, I. 2007, ApJS, 169, 83 [CrossRef] [Google Scholar]
- Ludendorff, H. 1903, AN, 164, 81 [NASA ADS] [CrossRef] [Google Scholar]
- Lutz, T. E., & Lutz, J. H. 1977, AJ, 82, 431 [NASA ADS] [CrossRef] [Google Scholar]
- McCall, B. J., Drosback, M. M., Thorburn, J. A., et al. 2010, ApJ, 708, 1628 [NASA ADS] [CrossRef] [Google Scholar]
- McCuskey, S. W. 1949, ApJ, 109, 414 [NASA ADS] [CrossRef] [Google Scholar]
- McCuskey, S. W. 1959, ApJS, 4, 1 [NASA ADS] [CrossRef] [Google Scholar]
- Morgan, W. W., Code, A. D., & Whitford, A. E. 1955, ApJS, 2, 41 [NASA ADS] [CrossRef] [Google Scholar]
- Munari, U., Tomasella, L., Fiorucci, M., et al. 2008, A&A, 488, 969 [NASA ADS] [CrossRef] [EDP Sciences] [Google Scholar]
- Münch, G. 1957, ApJ, 125, 42 [NASA ADS] [CrossRef] [Google Scholar]
- Palacios, A., Gebran, M., Josselin, E., et al. 2010, A&A, 516, A13 [NASA ADS] [CrossRef] [EDP Sciences] [Google Scholar]
- Paxton, B., Bildsten, L., Dotter, A., et al. 2011, ApJS, 192, 3 [Google Scholar]
- Perryman, M. A. C., & ESA. 1997, The Hipparcos and TYCHO catalogues (Noordwijk, Netherlands: ESA Publications Division), ESA SP Ser., 1200 [Google Scholar]
- Petrie, R. M., & Lee, E. K. 1966, Publ. Dom. Astrophys. Obs. Victoria, 12, 435 [NASA ADS] [Google Scholar]
- Petrie, R. M., & Pearce, J. A. 1961, Publ. Dom. Astrophys. Obs. Victoria, 12, 1 [Google Scholar]
- Plaskett, J. S., & Pearce, J. A. 1931, Publ. Dom. Astrophys. Obs. Victoria, 5, 1 [Google Scholar]
- Prša, A., & Zwitter, T. 2005, ApJ, 628, 426 [NASA ADS] [CrossRef] [Google Scholar]
- Prša, A., & Zwitter, T. 2006, Ap&SS, 304, 347 [NASA ADS] [CrossRef] [Google Scholar]
- Reimers, D. 1975, Mem. Soc. Roy. Sci. Liege, 8, 369 [Google Scholar]
- Sadakane, K., Kambe, E., Sato, B., Honda, S., & Hashimoto, O. 2010, PASJ, 62, 1381 [NASA ADS] [Google Scholar]
- Savage, B. D., Massa, D., Meade, M., & Wesselius, P. R. 1985, ApJS, 59, 397 [NASA ADS] [CrossRef] [Google Scholar]
- Schlegel, D. J., Finkbeiner, D. P., & Davis, M. 1998, ApJ, 500, 525 [NASA ADS] [CrossRef] [Google Scholar]
- Škoda, P. 1996, in Astronomical Data Analysis Software and Systems V, ASP Conf. Ser. 101, 187 [Google Scholar]
- Stefanik, R. P., Torres, G., Lovegrove, J., et al. 2010, AJ, 139, 1254 [NASA ADS] [CrossRef] [Google Scholar]
- Stencel, R. E., Creech-Eakman, M., Hart, A., et al. 2008, ApJ, 689, L137 [NASA ADS] [CrossRef] [Google Scholar]
- Straizys, V., & Kuriliene, G. 1981, Ap&SS, 80, 353 [NASA ADS] [CrossRef] [Google Scholar]
- Strand, K. A. 1959, AJ, 64, 346 [CrossRef] [Google Scholar]
- Torres, G. 2010, AJ, 140, 1158 [NASA ADS] [CrossRef] [Google Scholar]
- van de Kamp, P. 1978, AJ, 83, 975 [NASA ADS] [CrossRef] [Google Scholar]
- van de Kamp, P., & Lippincott, S. L. 1968, AJ, 73, 781 [NASA ADS] [CrossRef] [Google Scholar]
- van Leeuwen, F. 2007a, in Astrophysics and Space Science Library (Springer), 350 [Google Scholar]
- van Leeuwen, F. 2007b, A&A, 474, 653 [NASA ADS] [CrossRef] [EDP Sciences] [Google Scholar]
- van Winckel, H. 2003, ARA&A, 41, 391 [NASA ADS] [CrossRef] [Google Scholar]
- Walborn, N. R. 1971, ApJS, 23, 257 [NASA ADS] [CrossRef] [Google Scholar]
All Tables
Equatorial coordinates and spectral types of ε Aur and the calibration stars in its neighbourhood.
Comparison of the and reddening for our calibration stars in the neighbourhood of ε Aur.
Radiative parameters and projected rotational velocity of HD 32328 resulting from the fit of the three Ondřejov spectra with the highest S/N by interpolated synthetic spectra.
Estimated distances, strength of the 6613.56 Å interstellar line and the reddening for all calibration stars.
Journal of spectral observations of ε Aur and the calibration stars in its neighbourhood.
Individual RVs of HD 31894 for the primary from the old photographic spectra and the RVs of the primary and secondary from the new electronic spectra measured via Gaussian fits.
Journal of UBV observations of ε Aur and the calibration stars in its neighbourhood.
All Figures
|
Fig. 1 Reddening E(B − V) computed from IR emission for extragalactic sources as a function of galactic coordinates. The data were taken from Schlegel et al. (1998). Our calibration stars and ε Aur are denoted by crosses. The values of E(B − V) range from 0.65 to 1.22 for the positions of the calibration stars (note that these are not E(B − V) for the stars themselves). The cloud visible in the north-east direction is the nebular region TGU H1105 (Dobashi et al. 2005). |
| In the text | |
|
Fig. 2 Orbital radial-velocity curves of HD 31894 for the orbital period of 11 |
| In the text | |
|
Fig. 3 A comparison of the disentangled line spectrum of the HD 31894 primary with a synthetic spectrum interpolated from the Bstar grid for Teff = 23 490 K, log g = 4.30 [cgs] and v sin i = 74.4 km s-1 in three spectral segments containing stronger stellar lines. In all cases, dots denote the observed spectrum, while the synthetic spectra, shifted for the systemic velocity of −2 km s-1, are shown as thin lines. A relative luminosity of the primary of L1 = 0.809 was adopted for the comparison. |
| In the text | |
|
Fig. 4 A comparison of the disentangled line spectrum of the HD 31894 secondary with a synthetic spectrum interpolated from the Bstar grid for Teff = 17 810 K, log g = 4.52 [cgs] and v sin i = 26.9 km s-1 in three spectral segments containing stronger stellar lines. In all cases, dots denote the observed spectrum, while the synthetic spectra, shifted for the systemic velocity of −2 km s-1, are shown as thin lines. A relative luminosity of the secondary of L2 = 0.191 was adopted for the comparison. |
| In the text | |
|
Fig. 5 Computed evolutionary tracks of both binary components of HD 31894 in a log g vs. Teff diagram and in the HR diagram. See the text for details. |
| In the text | |
|
Fig. 6 Orbital V-band light curve of HD 31894 for the orbital period of 11 |
| In the text | |
|
Fig. 7 Orbital radial-velocity curves of HD 31617 for the orbital period of 59 |
| In the text | |
|
Fig. 8 A comparison of the Ondřejov red spectrum of BD+43°1168 taken on HJD 2 456 008.3159 with a spectrum of another B9Iab star σ Cyg, taken with the same instrumentation and kindly put at our disposal by Dr. M. Kraus. Note the strong 6613.56 Å interstellar line in the spectrum of BD+43°1168 and its faint Hα profile, obviously partly filled by emission. |
| In the text | |
|
Fig. 9 Calibrations of the distance and a function of the strength of the diffuse interstellar 6613.56 Å line and of the reddening. The solid gray lines show the mean EW, Ic, and values of ε Aur and the corresponding distance, the dotted lines indicate the range of uncertainties. |
| In the text | |
|
Fig. 10 Time plots of the equivalent width (EW) and central intensity (Ic) of the 6613.56 Å diffuse interstellar line measured on a representative sample of the Ondřejov CCD spectra over the time interval from 2006 to 2012. No significant change during the 2009−2011 primary eclipse (RJD 55 050 to 55 800) is observed, which corroborates the conclusion that the line is of a truly interstellar (not partly cirmcumstellar) origin. |
| In the text | |
|
Fig. 11 Evolutionary tracks computed for ε Aur in the HR diagram. We show the evolution from the zero-age main sequence. The thin lines correspond to the observed effective temperatures, radii and luminosities of ε Aur. The range of masses are indicated in the legend. We also plot the evolutionary track for a lower-mass star (mini = 7 M⊙) for comparison as a dotted line. It never reaches the observed luminosity, even in the post-AGB phase. The post-AGB evolution track (not shown in the plot) is nearly horizontal (at nearly a constant log L/L⊙ ~ 4.4) as the star moves to the hotter (left) in the diagram. |
| In the text | |
|
Fig. C.1 A comparison of the disentangled red spectrum of HD 31617 (black lines) with the model spectrum (red lines). |
| In the text | |
|
Fig. C.2 A comparison of three individual Ondřejov spectra of HD 32328 (black lines) having the highest S/N with the model spectra (red lines). From top to bottom, the spectra were taken on RJD 56 011.4508, 56 013.4003, and 56 015.2794, respectively. Note that we could not remove the telluric lines from the observed spectra in this case. |
| In the text | |
|
Fig. C.3 A comparison of two individual Ondřejov spectra of HD 277197 (black lines) with the model spectra (red lines). From top to bottom, the spectra were taken on RJD 55 833.4303 (top two plots) and RJD 55 837.4985 (bottom two plots). Note that the telluric and interstellar lines were not removed from the observed spectra in this case. |
| In the text | |
|
Fig. C.4 Computed evolutionary tracks of the primary of HD 31617 in a log g vs. Teff diagram and in the HR diagram. See the text for details. |
| In the text | |
|
Fig. C.5 Computed evolutionary tracks of HD 32328 in a log g vs. Teff diagram and in the HR diagram. See the text for details. |
| In the text | |
|
Fig. C.6 Computed evolutionary tracks of HD 277197 in a log g vs. Teff diagram and in the HR diagram. See the text for details. |
| In the text | |
Current usage metrics show cumulative count of Article Views (full-text article views including HTML views, PDF and ePub downloads, according to the available data) and Abstracts Views on Vision4Press platform.
Data correspond to usage on the plateform after 2015. The current usage metrics is available 48-96 hours after online publication and is updated daily on week days.
Initial download of the metrics may take a while.