Fig. 3
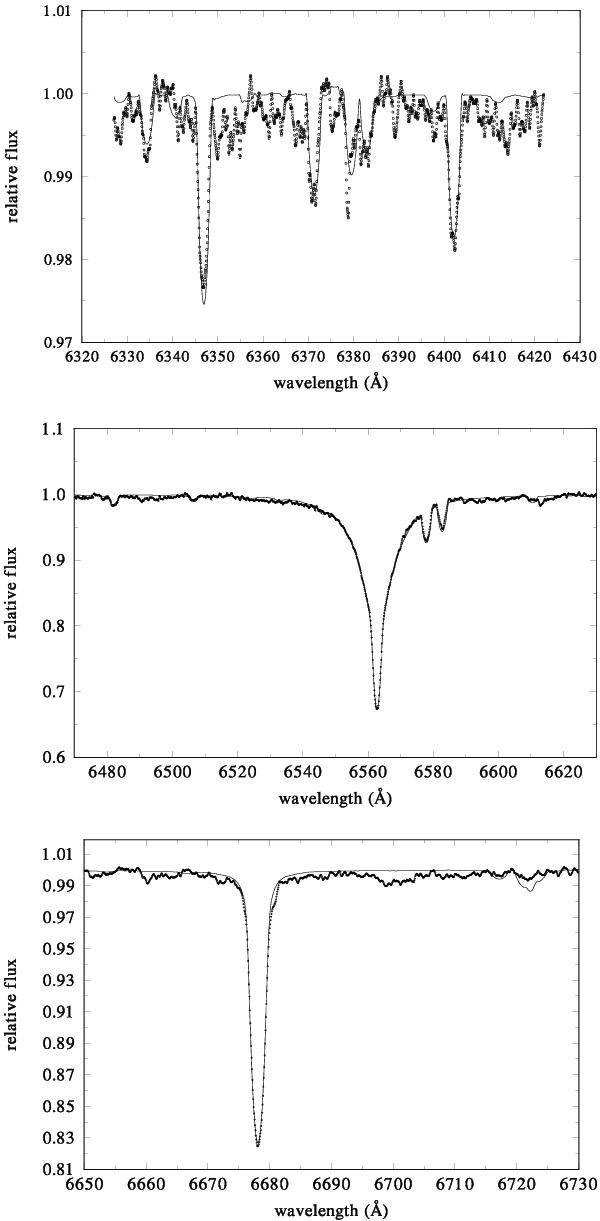
A comparison of the disentangled line spectrum of the HD 31894 primary with a synthetic spectrum interpolated from the Bstar grid for Teff = 23 490 K, log g = 4.30 [cgs] and v sin i = 74.4 km s-1 in three spectral segments containing stronger stellar lines. In all cases, dots denote the observed spectrum, while the synthetic spectra, shifted for the systemic velocity of −2 km s-1, are shown as thin lines. A relative luminosity of the primary of L1 = 0.809 was adopted for the comparison.
Current usage metrics show cumulative count of Article Views (full-text article views including HTML views, PDF and ePub downloads, according to the available data) and Abstracts Views on Vision4Press platform.
Data correspond to usage on the plateform after 2015. The current usage metrics is available 48-96 hours after online publication and is updated daily on week days.
Initial download of the metrics may take a while.