| Issue |
A&A
Volume 546, October 2012
|
|
|---|---|---|
| Article Number | A123 | |
| Number of page(s) | 15 | |
| Section | Stellar structure and evolution | |
| DOI | https://doi.org/10.1051/0004-6361/201118567 | |
| Published online | 17 October 2012 | |
Online material
Appendix A: Details of spectroscopic observations and their analyses
With one exception, all spectra used in this study were secured in the coudé focus of the Ondřejov 2.0-m reflector and a 702-mm focal length camera with a SITe-005 800 × 2000 CCD detector covering the wavelength region 6260−6760 Å. The spectra have a linear dispersion 17.2 Å mm-1 and a 2-pixel resolution R ~ 12 600 (~11−12 km s-1 per pixel). With one exception, their S/N is at least 100 or better. The journal of observations of all stars is in Table A.1.
Journal of spectral observations of ε Aur and the calibration stars in its neighbourhood.
Individual RVs of HD 31894 for the primary from the old photographic spectra and the RVs of the primary and secondary from the new electronic spectra measured via Gaussian fits.
Individual DAO and Ondřejov RVs of HD 31617.
Individual Ondřejov RVs of HD 32328 measured in SPEFO on the sharp core of Hα.
For HD 31894, one echelle spectrogram (4700−7085 Å, 2-pixel resolution of 63 000) was kindly obtained for us by Dr. Holger Lehmann with the Tautenburg Observatory 2-m reflector on JD 2 455 670.3. Dr. Lehmann also kindly carried out the initial reductions of that spectrogram (bias subtraction, flat-fielding, order merging and wavelength calibration) in IRAF. Similar initial reductions of all Ondřejov spectrograms were carried out by MŠ, also in IRAF. The final reductions and RV measurements were carried out by PH in the program SPEFO, written by the late Dr. J. Horn and further developed by Dr. P. Škoda and Mr. J. Krpata (Horn et al. 1996; Škoda 1996). In SPEFO, one derives the RVs via sliding the direct and flipped image of a line profile until a perfect match is obtained. We also measured a selection of good telluric lines to use them to a fine correction of the RV zero point for each spectrogram. After these corrections, the final RVs for HD 31894 were derived via a Gaussian fit of the He i 6678 Å line profile by PM. All individual RVs of HD 31894 are in Table A.2.
Appendix B: Photometry
The calibrated Hvar UBV observations of ε Aur and all calibration stars were obtained differentially relative to the comparison star λ Aur, used as the primary comparison by most observers of ε Aur. HR 1644 served as the check star. All observations were carefully reduced to the standard Johnson system via non-linear transformation formulae (Harmanec et al. 1994) using the latest rel.17 of the program HEC225. The more recent versions of HEC22 allow monitoring and modelling the variations of the atmospheric extinction during observing nights. The following mean Hvar all-sky values for λ Aur were added to the respective magnitude differences var-comp and check-comp:  The Villanova APT differential UBV observations of HD 31894 were secured relative to HR 1644 and reduced via a standard APT pipeline. The standard Hvar all-sky values for HR 1644
  were added to the magnitude differences var-comp. The journal of photometric observations is in Table B.1.
Journal of UBV observations of ε Aur and the calibration stars in its neighbourhood.
Appendix C: Model fits
Here, we present a comparison of the disentangled spectrum of HD 31617 and the observed spectra of HD 32328 and HD 277197 with the best-fit interpolated synthetic spectra in Figs. C.1−C.3, respectively. For the same stars, we also show the evolutionary tracks calculated in such a way to fit the Teff and log g deduced from the observed spectra – see Figs. C.4−C.6, respectively.
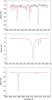 |
Fig. C.1
A comparison of the disentangled red spectrum of HD 31617 (black lines) with the model spectrum (red lines). |
| Open with DEXTER | |
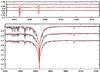 |
Fig. C.2
A comparison of three individual Ondřejov spectra of HD 32328 (black lines) having the highest S/N with the model spectra (red lines). From top to bottom, the spectra were taken on RJD 56 011.4508, 56 013.4003, and 56 015.2794, respectively. Note that we could not remove the telluric lines from the observed spectra in this case. |
| Open with DEXTER | |
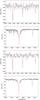 |
Fig. C.3
A comparison of two individual Ondřejov spectra of HD 277197 (black lines) with the model spectra (red lines). From top to bottom, the spectra were taken on RJD 55 833.4303 (top two plots) and RJD 55 837.4985 (bottom two plots). Note that the telluric and interstellar lines were not removed from the observed spectra in this case. |
| Open with DEXTER | |
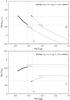 |
Fig. C.4
Computed evolutionary tracks of the primary of HD 31617 in a log g vs. Teff diagram and in the HR diagram. See the text for details. |
| Open with DEXTER | |
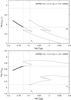 |
Fig. C.5
Computed evolutionary tracks of HD 32328 in a log g vs. Teff diagram and in the HR diagram. See the text for details. |
| Open with DEXTER | |
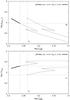 |
Fig. C.6
Computed evolutionary tracks of HD 277197 in a log g vs. Teff diagram and in the HR diagram. See the text for details. |
| Open with DEXTER | |
© ESO, 2012
Current usage metrics show cumulative count of Article Views (full-text article views including HTML views, PDF and ePub downloads, according to the available data) and Abstracts Views on Vision4Press platform.
Data correspond to usage on the plateform after 2015. The current usage metrics is available 48-96 hours after online publication and is updated daily on week days.
Initial download of the metrics may take a while.