| Issue |
A&A
Volume 544, August 2012
|
|
|---|---|---|
| Article Number | A48 | |
| Number of page(s) | 15 | |
| Section | Extragalactic astronomy | |
| DOI | https://doi.org/10.1051/0004-6361/201118301 | |
| Published online | 25 July 2012 | |
The X-ray luminous galaxies optically classified as star forming are mostly narrow line Seyfert 1 s
1 Instituto de Física de Cantabria (CSIC-Universidad de Cantabria), 39005 Santander, Spain
e-mail: This email address is being protected from spambots. You need JavaScript enabled to view it.
2 Department of Physics, University of Durham, South Road, Durham, DH1 3LE, UK
Received: 20 October 2011
Accepted: 19 April 2012
Abstract
Context. The optical and ultraviolet emission lines of galaxies are widely used to distinguish star-forming (SF) galaxies from active galactic nuclei (AGNs). However, this type of diagnostic has some associated uncertainties, because AGNs can be of low luminosity and/or heavily obscured, and the optical emission lines may be dominated by a stellar component. On the other hand, and despite its limitations, X-ray emission can be used as a reliable tracer of luminous AGNs. Several well-studied examples exist where the optical diagnostics are indicative of SF galaxy, but the X-ray properties reveal the presence of an AGN.
Aims. We aim to characterize the nature of galaxies whose optical emission line diagnostics are consistent with star formation, but whose X-ray properties strongly point towards the presence of an AGN. Understanding these sources is of particular importance in assessing the completeness of AGN samples derived from large galaxy surveys, selected solely on the basis of their optical spectral properties.
Methods. We construct a large sample of 211 narrow emission line galaxies (NELGs, which have full widths at half maximum (FWHMs) Hβ emission line <1200 km s-1) from the SDSS-DR7 galaxy spectroscopic catalogue, for which we are able to construct a classical diagnostic diagram, [OIII]/Hβ versus [NII]/Hα (hence z < 0.4), and that are also detected in the 2−10 keV X-ray band and present in the 2XMM X-ray source catalogue. This sample offers a large database by which to investigate potential mismatches between optical diagnostics and X-ray emission.
Results. Among these 211 objects, which based on our selection criteria all are all at z < 0.4, we find that 145 galaxies are diagnosed as AGNs, having 2−10 keV X-ray luminosities that span a wide range, from 1040 erg/s to above 1044 erg/s. Out of the remaining 66 galaxies, which are instead diagnosed as “star-forming”, we find a bimodal distribution in which 28 have X-ray luminosities in excess of 1042 erg/s, large thickness parameters (T = F2−10 keV/F [OIII] > 1) and large X-ray to optical flux ratios (X/O > 0.1), while the rest are consistent with being simply starforming galaxies. Those 28 galaxies exhibit the broadest Hβ line widths (FWHMs from ~300 to 1200 km s-1), and their X-ray spectrum is steeper than average and often displays a soft excess.
Conclusions. We therefore conclude that the population of X-ray luminous NELGs with optical lines consistent with those of a starforming galaxy (which represent 19% of our whole sample) is largely dominated by narrow line Seyfert 1s (NLS1s). The occurrence of such sources in the overall optically selected sample is small (<2%), hence the contamination of optically selected galaxies by NLS1s is very small.
Key words: galaxies: active / galaxies: nuclei / galaxies: Seyfert / galaxies: star formation / X-rays: galaxies
© ESO, 2012
1. Introduction
Emission lines in galaxies convey information about their emitter such as the power and nature of the underlying exciting source, as well as the geometry, physical condition and chemical composition of the gas, among other properties. Emission line data is available for many galaxies, which allow them to be classified depending on their physical nature, as either star forming (SF) or hosts of active galactic nuclei (AGNs). On the other hand, determining the fraction of galaxies hosting AGNs at their centres is an essential step for studies of galaxy evolution. The way in which AGNs are usually identified among the large samples of galaxies in massive optical spectroscopic surveys is almost invariably in terms of their emission lines. Baldwin et al. (1981) were amongst the first to introduce robust emission-line diagnostic ratios able to distinguish between star-forming processes and active nuclear emission. These and other diagrams were later used by Veilleux & Osterbrock (1987) to derive a semi-empirical classification scheme to distinguish between AGNs and SF galaxies. Kewley et al. (2001) used these same diagrams to derive a purely theoretical classification scheme which was later extended by both Kauffmann et al. (2003) and Stasińska et al. (2006). The underlying idea is that the emission lines in normal SF galaxies are powered by massive stars, so there is an upper limit to the intensity ratio of the collisionally excited lines with respect to the recombination lines (such as Hα or Hβ). In contrast, the photons from an AGN extend to yet higher energies and therefore induce more heating, implying that optical collisionally excited lines should be brighter with respect to recombination lines than in the case of ionization only by massive stars.
However, as noted by a number of authors (e.g., Severgnini et al. 2003; Page et al. 2006; Caccianiga et al. 2007; Trump et al. 2009), emission lines can be hidden, diluted, or masked by the stellar light from the galaxy. This is a particular problem in a low luminosity AGN (LLAGN), where the observed star formation and AGN components may be of comparable brightnesses. In these cases, the evidence of AGN activity in optical spectra can be weakened in a significant number of objects. In other cases, the regions producing the narrow and broad line emission characteristic of an AGN, may be obscured by dust in the host galaxy and/or in the nuclear regions (see Iwasawa et al. 1993; Comastri et al. 2002; Rigby et al. 2006; Civano et al. 2007). Such objects would be optically classified as either SF galaxies or HII regions, on the basis of emission-line diagnostic diagrams. Therefore, emission line diagnostics are not always a reliable means of detecting AGNs within galaxy samples.
As an alternative tracer, X-ray emission is a virtually universal feature of the AGN phenomenon. Accretion onto the super massive black hole (SMBH) produces X-ray emission by means of inverse Compton scattering by a hot electron corona of ultraviolet (UV) photons emitted from the accretion disc. Hard X-rays are not strongly attenuated along their path from the central engine, except by extremely high gas columns of ≳ 2 × 1024 cm-2, which occur in the so-called Compton thick sources. The latter are believed to make a significant contribution to the infrared (IR) and submillimeter backgrounds, because of the absorption of a large fraction of their continuum at shorter wavelengths, and its reradiation at longer wavelengths. This gas column density is equivalent to several tens of magnitudes of optical extinction, for Galactic gas to dust ratios. Contemporary X-ray observatories such as NASA’s Chandra and ESA’s XMM-Newton are sensitive to photon energies of up to ~10 keV, thus detection by these facilities is a very robust indicator of AGN activity. However, in spite of this advantage of X-ray selection there is no single method capable of selecting a complete sample of AGNs. On the one hand, dust is the main problem for optical selection, particularly for edge-on disc galaxies. On the other hand, X-ray selection is biased against sources in which the X-ray emission is heavily absorbed and/or Compton-scattered by dense gas clouds close to the central engine. Thus, no single method is able to identify all the AGNs found by other methods.
When both X-ray data and optical spectra are available for the same galaxy, galaxies optically classified as SF, may be found to have high X-ray luminosities, in excess of the most luminous SF galaxies known in the local Universe, by over an order of magnitude (>1042 erg s-1). The origin of this classification discrepancy is not fully understood. Trouille & Barger (2010) compared the optical classifications with the X-ray properties of a complete sample selected from three Chandra fields. They found that the optical diagnostic diagram misidentified 20 − 50% of their X-ray selected AGNs, in the sense that many X-ray AGNs were misclassified as SF galaxies. Yan et al. (2011) reported another case of misclassification. Their analysis of the relationship between the X-ray properties and optical emission lines suggests that a large fraction of the X-ray emitting AGNs would not have been identified using emission line diagnostic diagrams. They also found that there are indications of large classification discrepancies between X-ray and optically selected AGN samples at z ~ 1.
Understanding the physical cause of why a fraction of galaxies exhibit emission line diagnostics compatible with star formation, yet have X-ray properties that are indicative of an AGN, is of considerable importance. It must relate to the demographics of AGNs, black hole growth, and galaxy evolution. To address these issues, we present a study of a large sample of narrow emission line galaxies (NELGs) from the Sloan Digital Sky Survey (SDSS), whose X-ray emission properties are all available from the 2XMM X-ray source catalogue. We devote special attention to those objects optically classified as SF galaxies, but with 2 − 10 keV luminosities in excess of 1042 erg/s. We conduct a detailed analysis of this population, using other optical spectral features, e.g. the full width at half maximum (FWHM) of the Hβ emission line, as well as the X-ray spectral properties. We discover that this optically misclassified population, which represents over 10% of our full sample of narrow emission line galaxies with detected X-ray emission, consists of narrow line Seyfert 1 galaxies (NLS1s). If, however, all narrow emission-line galaxies for which there is XMM-Newton X-ray coverage (regardless of whether they have an X-ray detection or only an upper limit) were considered, the fraction of misidentifications would be only 1.5−5%.
The structure of the paper is as follows. In Sect. 2, we select the sample and describe both classification methods, highlighting the disagreements between them. Our modelling of the X-ray data is presented in Sect. 3, which focusses on the general spectral features found for the whole sample. Finally, in Sect. 4 we discuss our results and their implications. We assume a concurrence cosmology with H0 = 70 km s-1 Mpc-1, ΩΛ = 0.73, and ΩM = 0.27.
2. Optical and X-ray properties
To build a sample of galaxies having both X-ray data and optical spectra and showing prominent narrow emission lines and a lack of broad components, we performed a cross-correlation between the 2XMMi catalogue and the spectroscopic SDSS DR7 catalogue1. The SDSS DR7 is the seventh major data release of the Sloan Sky Survey. The SDSS spectroscopic data has sky coverage of ~8200 deg2, a spectral coverage from 3800 Å to 9200 Å, and a spectral resolution ranging from 1850 to 2200.
We filtered the resulting large sample as described below. Our final sample is composed of 211 NELGs, with Hβ line widths ranging from 140 km s-1 up to 1200 km s-1. The X-ray selection criteria resulted in all spectra having a minimum of 30 counts above 2 keV in at least one detector, i.e. PN, MOS1, or MOS2.
2.1. Sample selection
Our sample selection process consisted of five stages:
-
1.
Identification of NELGs. The first step was to obtain a largesample of NELGs from the SDSS DR7 catalogue. We adopted anoperational line width cut-off FWHM(Hβ) ≤ 1200 km s-1, to reject galaxies with broad emission lines. This value was chosen by taking into account the strongly bimodal distribution of measured Hβ FWHM values for an emission-line galaxy sample (see Hao et al. 2005, Fig. 6). This indicates that there is a natural separation between broad and narrow line AGNs. Our selection results in a sample composed of objects of different types including: type 2 AGNs with a broad range of luminosity, obscured AGNs, galaxies whose emission is not dominated by nuclear activity and are classified as normal star-forming galaxies, and type 1.9 Seyferts, which exhibit only a weak broad component of Hα (Osterbrock 1981).
-
2.
BPT diagram as indicator of SF/AGN activity. The standard method used to classify galaxies as either SF or AGNs, is based on their emission-line ratios. Among all available combinations of emission lines, in this work we used [OIII]λ5007/Hβ versus [NII]λ6584/Hα (Baldwin et al. 1981, often referred to as the BPT diagram), because it is the one that most clearly distinguishes between these two classes (Stasińska et al. 2006). In the BPT diagram (see Fig. 1), the AGNs occupy the region above and to the right of the borderline, whilst SF galaxies are found to the bottom left of the parameter space (Kewley et al. 2001; Kauffmann et al. 2003). The reason for using these emission-line ratios is twofold: first, the lines used to compute each ratio are very close together in wavelength, and consequently the line ratios are largely insensitive to dust; second, the [OIII]λ5007 emission line luminosity is often used as an isotropic indicator of AGN activity. This assumes that the [OIII] emission is an unbiased and orientation-independent measure of the ionizing flux from the AGNs whereas X-ray photons from the compact nucleus may be strongly attenuated in the plane of the dusty torus. Therefore we only selected objects in which the four emission lines of Hβ, Hα, [OIII]λ5007 , and [NII]λ6584 were detected. On the basis of this selection criteria all of them are at redshift z < 0.4. Given the typical signal-to-noise (S/N) ratio and the instrumental resolution of the SDSS spectra, we omitted objects that had an observed FWHM for any of the four emission lines smaller than 70 km s-1, as they are likely to be spurious detections or poorly detected lines. Applying these criteria, we selected about 150 000 nearby NELGs.
-
3.
Cross-correlation between 2XMMi DR3 and SDSS DR7. To identify possible X-ray counterparts, we analysed XMM-Newton observations covering the sky positions of these NELGs. A total of 1729 have some X-ray exposure time, although in the majority of cases only upper limits to their X-ray emissivity were found. We crosscorrelated this parent sample with the Incremental Second XMM-Newton Serendipitous Source Catalogue 2XMMi-DR3 (Watson et al. 2009) released in April 20102 applying a matching radius of 3 arcsec. This radius is chosen as a compromise between allowing for some positional error, and minimizing the probability of spurious matches (Watson et al. 2009). We considered only X-ray sources with a 0.2 − 12 keV European Photon Imaging Cameras EPIC detection likelihood above 3σ in at least one camera.
-
4.
LX as an indicator of AGN activity. Our primary goal is to characterize the populations of NELGs by comparing their optical classification with their X-ray properties. The standard technique employed to identify AGNs in emission line galaxies is via an empirical X-ray luminosity threshold at LX > 1042 erg s-1. This is a very conservative limit, based on the fact that very few local starforming have higher X-ray luminosities -with a few possible exceptions e.g. NGC 3256 (Lira et al. 2002). While very luminous AGNs can be unambiguously identified in almost any energy band, AGNs become progressively more challenging to identify at lower luminosities when their emission may be equal to, or even less than that from the host galaxy. The hard X-ray (2 − 10 keV) luminosity (LX) is a good indicator of AGN activity, because the X-ray spectra of SF galaxies are typically softer than those of AGNs. However, lower luminosity X-ray sources with hard spectra, can be either AGNs or arise from high mass X-ray binaries. Hence there is a problem in using X-rays alone to distinguish between low luminosity or obscured AGNs, and a population of high mass X-ray binaries in starforming galaxies. One way to distinguish between these possibilities is to apply the empirical limit in X-ray luminosity of starburst galaxies at around LX ~ 1041 erg s-1. Therefore, a factor of ten above this value, it is assumed that the X-rays probably arise from accretion onto a SMBH. We have adopted this value as the representative dividing line for starforming activity: all objects with an X-ray luminosity higher than 1042 erg s-1 are assumed to host an active nucleus. Galaxies with lower X-ray luminosities are consistent with SF galaxies. But it is possible that low luminosity X-ray sources may still be weak AGNs, e.g. low-ionization nuclear emission-line regions (LINERs), or be are heavily obscured. Other information, such as X-ray spatial extent or variability, is needed to confirm the origin of the emission. To select galaxies that might potentially host an AGN, we required our sources to have a well-defined count rate in the 2 − 12 keV energy range, i.e. we considered only X-ray sources with a 2 − 12 keV European Photon Imaging Cameras (EPIC) detection likelihood above 3σ in at least one camera. This requirement resulted in X-ray spectra with a minimum of 30 counts in at least one detector.
-
5.
Final sample. Finally, we performed a visual inspection of the optical data in each of these SDSS/2XMMi pairs to confirm that all the matches were indeed genuine. Special care was taken to examine sources that showed some signs of Hα and/or Hβ broad emission lines, as well as spurious sources. After inspection of the SDSS spectra, we excluded 29 objects. These sources showed either strong reddening or low S/N in the blueward part of the Hβ line or only weak broad Hα lines (e.g. were Seyfert 1.9’s). In some cases, we could detect weak broad Hα and Hβ lines (e.g. a Seyfert 1.8). After removing these sources, our final sample contained 211 galaxies, that had only narrow emission lines and reliable X-ray flux detections in the 2 − 12 keV band.
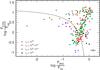 |
Fig. 1 Emission line diagnostic diagram (BPT diagram) for the whole sample of NELGs. The curve separating the AGNs from the non-AGNs (bottom left) zone is taken from Kauffmann et al. (2003). Symbols change in both form and colour according to the hard X-ray luminosity, LX. To avoid confusion, only the mean errors are reported (bottom right). The estimated errors increase with decreasing log[NII]/Hα. |
Classification definitions of NELG objects.
2.2. Optical classification versus X-ray emission
The BPT diagrams have been used to infer whether the gas in a given galaxy is excited by star formation or radiation from an accretion disc around a central SMBH and has become one of the major tools for the classification and analysis of emission line galaxies in the SDSS (York et al. 2000). To be conservative in our analysis, we adopted the dividing line between SF and AGN galaxies presented by Kauffmann et al. (2003, hereafter Kauf03). In that work, a refined optical classification was obtained, based on a combination of stellar population synthesis models plus detailed self-consistent photoionization models, in order to create a theoretical starburst line projected onto the BPT diagram. This is given by  (1)Kewley et al. (2001) used a different separation criterion between SF and AGN galaxies in the BPT diagram, which lies above and to the right of the Kauf03 line, defining a region often known as the LINER/transition region where sources exhibit both AGN and starburst activity. If we adopted the Kewley et al. (2001) borderline, then the fraction of X-ray luminous NELGs classified as SF galaxies would be significantly higher, at least twice (see e.g. Jackson et al. 2012), where their three sources fall between both borderlines). In this paper, we prefer to focus on the X-ray luminous NELGs that are uncontroversially classified as SF galaxies using the BPT diagram, hence we adopt the Kauf03 criterion. Following this criterion, we can directly obtain an optical classification for our sources: star-forming galaxies are those lying below the Kauf03’s line, i.e. optically classified SF or BPT-SF, and conversely those located above the line are classified as AGN, i.e. as either an optically classified AGN or BPT-AGN.
To see how the optical classification compares with X-ray luminosities, we must first obtain the hard X-ray intrinsic luminosity of each source. We used the X-ray fluxes and spectroscopic redshifts3 to calculate the rest-frame 2 − 10 keV luminosities (LX) assuming an X-ray spectrum in the form of a power law modified by Galactic absorption with continuum spectral slope Γ = 1.7; we then corrected these luminosities for the Galactic absorption to compute the intrinsic luminosities, but did not correct for any possible intrinsic absorption. Figure 1 shows the BPT diagram where the dashed line is the Kauf03 criterion and the points change in both form and colour according to their value of LX to highlight the disagreements between the optical-based and X-ray-based classifications. From the optical diagram and according to the values of LX the sample was split into four subsamples (see Table 1):
-
Weak-AGN subsample: consisting of 62 sources classified as AGNs according to the BPT diagram notwithstanding their low luminosities, not exceeding 1042 erg s-1.
-
Strong-AGN subsample: including 83 NELGs identified as BPT-AGNs that have in turn luminosities exceeding 1042 erg s-1.
-
True-SF subsample: consisting of 38 sources that were classified as SF according to both the BPT diagram and LX criterion.
-
Missing-AGN subsample: involves 28 objects classified as BPT-SF that notwithstanding have a LX ≥ 1042 erg s-1.
This classification clearly implies that there is a mismatch between the optical-based and X-ray-based classifications in the missing-AGN and weak-AGN subsamples (also found by Yan et al. 2011). On the one hand, there are several explanations of the low luminosity emitted by weak-AGNs. A significant fraction of the population of AGNs in the local Universe displays a low X-ray luminosity, not exceeding 1042 erg s-1 (see Barth 2002, LLAGN). In particular, low-ionization nuclear emission-line regions (LINERs) were originally defined by Heckman (1980) as a subclass of these LLAGNs, whose optical spectra are dominated by strong low ionization lines and much weaker higher ionization lines classical AGNs. According to Heckman (1980), LINERs are galaxies that satisfy [OII]λ3727 > [OIII]λ5007 and [OI]λ6300/[OIII]λ5007 ≥ 1/3. According to these criteria, we classified 8 (13%) sources in our weak-AGN subsample as pure LINERs and an additional 18 (29%) as weak-[OI] LINERs. The latter fully satisfy Filippenko & Terlevich (1992)’s definition (i.e. [OII]λ6300/Hα < 1/6). On the other hand, the high values of the luminosity emitted by the sources in our missing-AGN subsample suggest that these sources do contain AGNs even though they lie beneath Kauf03’s line implying that optical AGN signatures are lacking and signs of star formation, such as strong Hα and Hβ lines, are clearly visible. The nature of this misclassified population is discussed throughout this paper.
2.3. Optical versus X-ray properties
After discussing the optical classifications of our NELG sample and the mismatches with the X-ray luminosities for some objects, we now compare their optical and X-ray properties in the context of three parameters in an attempt to provide clues about the nature of the source populations within the complete sample of NELGs.
To obtain the most basic X-ray spectral information, we performed a Hardness Ratio (HR) analysis using EPIC-pn data. We adopted the standard hardness ratio, defined as  (2)where S and H are the PSF and vignetting-corrected count rates in the 0.5 − 2 keV and 2 − 4.5 keV energy bands, respectively. A HR analysis is much simpler than a complete spectral analysis and is often the only X-ray spectral information available for the faint sources in the XMM-Newton catalogue. We note that the X-ray selection criteria resulted in a minimum count threshold of around 30, hence a proper X-ray spectral analysis could not be performed for a number of our sources. The HR parameter is an approximate indicator of the intrinsic X-ray spectral shape, which is also sensitive to the level of absorption. An unabsorbed X-ray spectrum has typically a lower HR than an absorbed one. Although this correlation is relatively weak, and redshift-dependent (Trouille et al. 2009), the vast majority of our missing-AGNs have a low HR that is consistent with being unabsorbed as shown in Fig. 2.
An alternative method for evaluating absorption is to measure the X-ray luminosity, and compare this with an isotropic indicator of the intrinsic power of the AGN. Assuming that the unified AGN model is correct, in absorbed sources the X-ray flux iis attenuated with respect to this isotropic indicator by an amount related to the absorbing column density. Taking the reddening corrected [OIII]λ5007 luminosity as an isotropic indicator of the source nuclear strength, we calculated the ratio of the hard X-ray to [OIII] fluxes (Bassani et al. 1999, hereafter thickness parameter or T). According to Bassani et al. (1999), Seyfert 1 galaxies lie in the range 1 < T < 100, Compton-thin Seyfert 2 galaxies, in the range 0.1 < T < 10, and Compton-thick Seyfert 2 galaxies at T < 0.1. To estimate the thickness parameter, ![Mathematical equation: \hbox{$T\equiv F^{\rm c}_{\rm HX}/F^{\rm c}_{\rm [OIII]}$}](/articles/aa/full_html/2012/08/aa18301-11/aa18301-11-eq74.png) , X-ray and [OIII] fluxes were corrected for Galactic absorption and reddening, respectively. We used the Bassani et al. (1999) relation to derive
, X-ray and [OIII] fluxes were corrected for Galactic absorption and reddening, respectively. We used the Bassani et al. (1999) relation to derive ![Mathematical equation: \hbox{$F^{\rm c}_{\rm [OIII]}$}](/articles/aa/full_html/2012/08/aa18301-11/aa18301-11-eq75.png) from the Balmer decrement, as
from the Balmer decrement, as ![Mathematical equation: \hbox{$F^{\rm c}_{\rm [OIII]} = F_{\rm [OIII]} \left( \frac{({\rm H}_{\alpha}/{\rm H}_{\beta})_{\rm obs}}{3.0} \right)^{2.94}$}](/articles/aa/full_html/2012/08/aa18301-11/aa18301-11-eq76.png) which assumes an intrinsic Balmer decrement equal to 3.0 as predicted in the NLR (see Osterbrock & Ferland 2006).
which assumes an intrinsic Balmer decrement equal to 3.0 as predicted in the NLR (see Osterbrock & Ferland 2006).
Finally, a useful parameter used to discriminate between different classes of X-ray sources is the X-ray-to-optical flux ratio (see Maccacaro et al. 1988, hereafter X/O). In this paper, we defined the X-ray to optical flux ratio using the observed X-ray flux in the 0.5 − 4.5 keV energy range and the optical r(SDSS) band flux (for the appropriate conversion factors see Fukugita et al. 1995). X-ray selected AGNs (of both type 1 and type 2) have typical X/O flux ratios in the range between 0.1 and 10 (see Fiore et al. 2003). An X/O ratio of above 10 is typical of obscured AGNs at high-z and high-luminosity (type 2 QSOs), as well as high-z clusters of galaxies and extreme BL Lac objects. Values of X/O below 0.1 are found in coronal emitting stars, normal galaxies (both early-type and star-forming), and nearby heavily absorbed AGNs (Della Ceca et al. 2004).
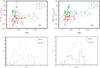 |
Fig. 2 Optical and X-ray properties. Upper two panels: |
![Mathematical equation: \hbox{$T = F^{\rm c}_{\rm HX}/F^{\rm c}_{\rm [OIII]}$}](/articles/aa/full_html/2012/08/aa18301-11/aa18301-11-eq82.png)
Thus, we should expect that the thickness parameter and the X/O values fall within the typical range of values for BPT-SF galaxies, i.e. T < 1 and X/O < 0.1 (respectively). We expect correspondingly that BPT-AGN will fall outside of this range. Figure 2 shows the combined information provided by these three parameters: X/O versus HR and T versus HR. We have used different symbols to denote different ranges of LX: filled and empty symbols denote the optical classification, identified as BPT-AGN and BPT-SF respectively. Whilst nearly all of the X-ray-based AGNs (missing-AGN and strong-AGN subsample, see Table 1) have typical AGN values for both X/O and T parameters, the values for the true-SF and weak-AGN subsample are more consistent with being SF galaxies, for which X/O and T are lower than 0.1 and 1, respectively. Despite this, we cannot define a range of values that isolate AGN from the rest of the sources, either by using T or X/O, i.e. a NELG classified as either a SF galaxy or an AGN (by using either optical-based or X-ray-based criteria) does not occupy a definite region in these parameter spaces. Analogously, hardness ratios do not clearly cluster around different values for different subclasses of objects. In general, that one would expect SF galaxies to have an X-ray spectrum dominated by a thermal component that is softer than the typical power-law spectra exhibited by an AGN. However, the mix of BPT-SF and BPT-AGN galaxies do not show a clear trend in their hardness ratios. Thus, we cannot establich a clearly defined criterion to differentiate AGN from SF, in the context of the three analysed parameters.
However, we find that the log T as well as the log X/O distributions display bimodal shapes for the BPT-SF population opening the possibility that the emission of the missing-AGN population has a different nature (see Fig. 2).
Figure 3 shows the X-ray luminosity as a function of the Hβ FWHM for these two optical populations. From this figure, it is evident that this bimodal feature of the BPT-SF population is directly linked to the values of Hβ FWHM. There is an almost one-to-one correspondence for the NELGs diagnosed as BPT-SF galaxies, between the FWHM of their Hβ line and the X-ray luminosity. Among this sample of 66 BPT-SFs, we indeed found that roughly all these with LX < 1042 erg s-1 exhibit an Hβ FWHM ≲ 600 km s-1, while all the more X-ray luminous objects (which should contain an AGN) have Hβ FWHMs of between 600 and 1200 km s-1. However, this division based on Hβ FWHM does not apply to the BPT-AGNs, where the vast majority are smaller than ~600 km s-1, independent of the value of LX.
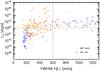 |
Fig. 3 X-ray luminosity as a function of the Hβ FWHM. The vertical dotted line marks the threshold of FWHM(Hβ) = 600 km s-1, while the horizontal dashed line corresponds to LX = 1042 erg/s. Different symbols are related to the optical classification: BPT-AGN as filled circles and BPT-SF as empty triangles. |
2.4. An overview of the missing-AGN subsample
On the basis of the estimated upper limits to the 2−10 keV luminosity given by FLIX4 for objects that were identified as NELGs but lacked X-ray detections, we identified another 1207 galaxies that were classified as SF based on their position in the BPT diagram. However, only 5% (60/1207) of them could be missing-AGN candidates, i.e. those for which the upper limit to their 2−10 keV exceeds 1042 erg s-1.
Therefore the missing-AGN candidates represent only between 2% and 7% (28 + 60), of the BPT-SF population (66 + 1207) and therefore they do not represent a major problem in terms of incompleteness. In terms of the total sample of NELGs covered by X-ray observations, the missing-AGN represent between 1.6% and 5% of the entire sample. However, the nature of the missing-AGN subsample is poorly understood and needs to be explored further.
In the above section we have described the X-ray and optical spectral properties used to explore the nature of the elusiveness of optical signatures in the misssing-AGN subsample. Similar studies have been performed previously focussing on the nature of the so-called elusive AGNs, i.e. sources that show no signs of AGN activity in the optical regime, but display signs of AGN activity in the X-ray band. One possibility is that they could be mildly/heavily obscured AGNs in which star formation dominates the optical emission-line ratios. The obscuration of the narrow-line region may well be caused by gas and dust close to the galactic nucleus and therefore, comparing the X-ray to [OIII] emission should reveal the level of absorption (Maiolino et al. 1998; Bassani et al. 1999). However, given that the thickness parameter is in the range T ≥ 10, the hydrogen column density would have to be < 1023 cm-2 and therefore obscuration by the torus is not very likely to be the cause of the elusiveness of optical AGN signatures in these sources.
Another possibility is that the sample contains composite objects, i.e. those hosting both star formation and an AGN. On the basis of the relation between LX(2 − 10 keV) and LHα for SF galaxies (Ranalli et al. 2003; Kennicutt 1998), LHα/LX should be greater than 1, assuming Av ≤ 2. Whilst type 1 AGNs have ratios lower by two orders of magnitude, composite galaxies are expected to have intermediate ratios (Yan et al. 2011). Figure 4 shows the distribution of log (LHα/LX), where most of the LHα/LX ratios seem to lie in-between both extremes as expected in the composite galaxy range. This opens the possibility that the missing-AGN population could be composite objects having both star formation and active nuclei, although largely consistent with being AGN.
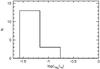 |
Fig. 4 Distribution of the LHα/LX for missing-AGN sub-sample. |
Summary of some observational parameters.
The high values of both X/O and T, which are two orders of magnitude higher than the average in SF galaxies and those typical of Seyfert 1, the low hardness ratio and the quite high values for the Hβ FWHM make our missing-AGN sources very likely to be narrow line Seyfert 1 (NLS1), which are believed to lie in the starburst region of the BPT diagrams. The NLS1 galaxies represent a subclass (Osterbrock & Pogge 1985) of type 1 AGNs that manifest a distinctive ensemble of properties. They are AGN with optical spectral properties similar to those of Seyfert 1 galaxies, except for recombination lines that are only slightly broader than forbidden emission lines. Studies of NLS1s have idenfified many peculiar properties that extend well beyond a pure line-width-based distinction. Distinctive features in optical spectra of NLS1s, are the low values of the [OIII]/Hβ, and the often strong permitted blended FeII emission. Out of the 28 missing-AGNs, the Fe II multiplets were detected in 23 objects at the > 3σ level. Among the rest of the subsample, there is another rare class of NLS1s that do not exhibit strong Fe II multiplets. For the three objects with very narrow Balmer lines (see Fig. 5), there is a prominent He II broad emission line, which ensures their classification as type 1 AGNs. For two additional sources, the SDSS spectra were too noisy to yield reliable measurements of either Fe II multiplets or He II, and in addition they have evidence of high reddening.
The relative strength of the Fe II multiplets is usually expressed as the flux ratio of Fe II to Hβ: R4570 ≡ FeIIλλ4434 − 4684/Hβ, where Fe II λλ4434 − 4684 denotes the flux of the Fe II multiplets integrated over the wavelength range of 4434 − 4684 Å after subtracting the local underlying continuum and the He II λ4686 emission line. Figure 6 shows the distribution of the relative strength of the Fe II multiplets, R4570, for the missing-AGN subsample, which is compared with the distribution given by Zhou et al. (2006). The average is ⟨ R4570 ⟩ = 0.88 and the 1σ dispersion is 0.5, which is consistent with the Zhou’s NLS1 sample: the probability that both distributions come from the same distribution is ~ 89% according to the Kolmogorov-Smirnov test. The average is significantly larger than the typical value of R4570 ~ 0.4 found in normal AGNs (Bergeron & Kunth 1984), bolstering again the idea that these two populations are probably of a different nature.
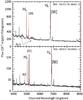 |
Fig. 5 Example of a typical NLS1 with a moderate Fe II emission (top panel) and, on the other hand, a SDSS spectrum of an Fe II-lacking NLS1 (bottom panel). Note in the last spectrum the very narrow Balmer emission lines and also the very weak Fe II multiplets; the prominent He II broad emission line ensures our classification as a type 1 AGN. |
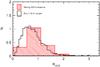 |
Fig. 6 Normalized distribution of the relative strength of the Fe II multiplets, R4570, for the missing-AGN subsample (filled histogram) and the NLS1 sample of Zhou et al. (2006). |
3. X-ray spectral analysis
We carried out an X-ray spectral analysis of the BPT-SF populations, consisting of the two subsamples of missing-AGN and true-SF subsamples. We recall that our main aim is to understand the nature of the missing-AGN subsample, which are optically classified as SF but have LX in excess of 1042 erg s-1 that are indicative of an AGN. The results of the previous section (T, X/O, HR, Hβ FWHM, and R4570) lead us to propose that these objects are good candidate NLS1s. Thus, the missing-AGN and true-SF subsamples were analysed as samples of different natures.
3.1. Data reduction and spectral analysis
All objects presented here were observed with XMM-Newton between 2001 June and 2007 December. The European Photon Imaging Cameras (EPIC) pn (Strüder et al. 2001) and MOS (Turner et al. 2001, MOS1 and MOS2) were operated in full frame imaging mode during all the observations. The XMM-Newton data of some objects were previously presented in the literature (see Table 2). For a fully homogeneous analysis enabling robust conclusions, we reanalysed the XMM-Newton spectra of these objects, in exactly the same way as for the objects whose XMM-Newton data are presented here for the first time.
We chose to use EPIC-pn data as it covers a larger effective area resulting in a higher S/N. The observation data files (ODFs) were processed to produce calibrated event lists using the Science Analysis System (SAS 10.0.0). We extracted the source spectra using the good EPIC-pn events in circular regions of radii ranging from 12′′ to 30′′ centred on the source position. We used single- and double-pixel events for all observations. The background spectra were extracted from nearby circular regions free of sources. Spectral response files were generated using the SAS tasks rmfgen and arfgen. The epatplot SAS task was used to test for the presence of pile up. The EPIC-pn X-ray spectra of all but two of the observations (sources 2XMM J124635.3+022209 and 2XMM J103438.6+393828, see Table 2) were found to be free from the effects of pile-up. We performed an X-ray spectral analysis with XSPEC v12.5 (Arnaud 1996), taking the limits in accurate calibration of the pn data as 0.3−12 keV. The source spectra were grouped to have at least 20 counts in each bin in order to apply the modified χ2 minimization technique; the lowest quality spectra observations (100 − 300 counts) were only grouped with at least 15 counts per bin. We did not carry out an X-ray spectral analysis for the faintest sources (<100). All quoted errors are for a 90 per cent confidence interval for one parameter (Δχ2 = 2.706).
Missing AGNs: results of fitting the spectral data with both a power law in the hard X-ray energy band (2−10 keV) and an absorbed power-law model across the whole X-ray spectrum (0.3−10 keV).
The X-ray selection criteria resulted in a minimum of 30 counts at energies above 2 keV in at least one detector independently of the quality of the spectrum, which means that the S/N was sometimes low. Thus, the level of detail of our spectral analysis varied for each source depending on the quality of the EPIC-pn spectra, ranging from a quite detailed analysis for bright sources, to only very coarse spectral fits for the faintest.
3.2. Missing-AGN subsample
We now study the nature of the missing-AGN subsample, which are possibly NLS1s. Two objects (2XMMi J123748.5+092323 and 2XMM J014856.9+135450, see Table 2) simply could not be modelled owing to the low number of counts (<50). For three other sources (2XMM J141519.4-003021, 2XMM J135724.5+652506, and 2XMM J123126.4+105111, see Table 2) the energy range used by the spectral analysis was E ≲ 4 keV due to the EPIC-pn data being dominated by the background above these energies. Finally, 2XMMi J082912.8+500652, 2XMM J131718.6+324036, and 2XMM J134235.6+261534 were analysed using only EPIC-MOS data because of the lack of EPIC-pn data. In Table 2, we give details of the X-ray observations and the hard X-ray luminosity of each object, which was calculated using the best-fit power-law model over the 2 − 10 keV energy band. We note that the Galactic absorption is implicitly included in all the spectral models presented hereafter at the values given in Table 3.
The general best-fit model of the X-ray spectrum emitted by a NLS1 has typically four components: an underlying absorbed steep power-law, a soft X-ray excess, and a reflection component that might also include a broad feature near the Fe line complex at 5 − 7 keV. Several explanations have been proposed for the origin of the observed soft excess, such as a relativistically blurred photoionized disc reflection (Ross et al. 2002; Crummy et al. 2006), an intrinsic thermal component, or ionized absorption arising in a wind from the inner disc (Gierliński & Done 2004, 2006). For simplicity, we only used two different two-component continua: a partial covering and a thermal model as proxies to each explanation respectively (the quality of the X-ray data did not allow a more sophisticated analysis in the majority of cases). In the case of the first two-component continua, we modelled the soft excess emission due to reprocessing of the primary X-rays as a partial-covering neutral material (PCF model). This can be regarded as a physical model of a clumpy torus, where the torus is a smooth continuation of the broad line region, and provide a physical explanation of the apparent mismatch between the optical classification and the X-ray properties of these objects. In this model, X-ray absorption, dust obscuration, and broad line emission are produced in a single continuous distribution of clouds: the broad line region is located within the dust sublimation radius, hence the non-dust-free clouds obscure the optical emission but not the X-rays, whereas the torus is located outside the dust sublimation ratio. The PCF model assumes that some fraction, f, of the X-ray source is covered by a neutral absorber with a column density of NH,z, while the rest is unobscured. This could be responsible for an apparent soft excess in two different geometries, either by reflection from optically thick material out of the line of sight (Fabian et al. 2002), or absorption by optically thin material along the line of sight (Gierliński & Done 2004; Chevallier et al. 2006).
On the other hand, there are some possible ways of explaining the soft excess from the disc itself in terms of the reprocessing of the primary X-rays in the accretion disc as reflected emission from a geometrically flat disc, with solar abundances, illuminated by an isotropic source. Thus, the soft excess is sometimes closely fitted by a black body that has a roughly constant temperature of 0.1 − 0.2 keV. If this radiation is thermal, this temperature is much too high to be explained by the standard accretion disc model of Shakura & Sunyaev (1973), although it could be explained by a slim accretion disc in which the temperature is raised by photon trapping, in which case the accretion is super-Eddington (Tanaka et al. 2005), or by thhe Comptonization of extreme UV accretion disc photons (e.g. Porquet et al. 2004).
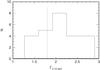 |
Fig. 7 Distribution in Γ2 − 10 for the “missing AGN” when we fitted the individual data in the 2 − 10 keV energy range with a single power law modified by absorption in our Galaxy. The vertical line marks the expected value for objects of Seyfert 2 type. |
Missing AGNs: best-fit models for the soft X-ray excess.
We carried out the hard X-ray spectral fitting procedure using the following scheme:
-
1.
We first fitted the individual data in the2 − 10 keV (when possible) energy range,using a power law modified by absorption from cold gas in ourGalaxy (hereafter PL).
-
2.
We then checked for any significant additional component that may be present in this energy range, such as an iron emission line (model led with zgauss at Ec ~ 6.4 keV) and/or an Fe K-edge among other features.
We found that the PL yields an acceptable fit for almost all objects in the sample, in terms of the minimum χ2 (see Table 3). No other statistically significant and physically meaningful features were found in the hard X-ray spectra. Figure 7 shows that the distribution of Γ2−10 takes values above the typical expected value (~1.8) found for type 2 AGNs. We note that the cases where the X-ray spectra appears very hard with a power-law slope Γ ~ 1.5, also correspond to those with larger errors, ± 0.5 (see Table 3).
We also attempted to fit the spectrum over the entire X-ray band (0.3 − 10 keV) with an intrinsically absorbed power-law model (absorbed-PL). We found that for all sources this simple model was rejected over the whole X-ray band with a high statistical significance. The estimated intrinsic column density was found to be less than 1022 cm-2, which corresponds to an unabsorbed model or at least values of absorption that fall in the low part of the column density distribution of type-2 AGNs. These very low upper limits are not quoted in Table 3.
We found additional evidence against starburst activity in the missing-AGN population by comparing the soft (0.3 − 2.5 keV) versus hard (2 − 10 keV) spectral indices, which revealed an overall spectral steepening towards low energies in many cases. This suggests that there is a soft X-ray excess that contributes mostly below ~2 keV. For the majority of the sources, this soft excess represents more than 20% of the X-ray emission, what is higher than expected for starburst activity. We show this soft component in Fig. 8, defined as the excess over an extrapolation to 0.3 keV of the PL model fitted to the hard X-ray band.
We carried out the soft X-ray component fitting procedure using the following approach and used the probability of the F-test, accepting additional spectral components only when they improved the fit with a significance ≥ 3σ:
-
1.
We added either a redshifted black body component (zbbody inXSPEC) to the PL model (hereafter BB-PL model) or a neutralabsorber at the redshift of the X-ray source that is either fully(f = 1) or partially (f < 1) covers the source (zpcfabs in XSPEC; hereafter PCF-PL model).
-
2.
We then compared these two models5, BB-PL and PCF-PLi. When one of the two models gave a fit with a
 and/or an F-test significance that was really high, ≥ 99%, the new model was taken as the baseline. In the case of sources for which the χ2 for the BB-PL and PCF-PL models were comparable and the values of each free parameter were physically plausible for both components, we adopted as the best fit model the one with the least uncertain model parameters.
Table 4 shows the best-fit model parameters for each source. The addition of either a BB or PCF component provides a good match to the observed spectra in almost all objects with more than 100 counts, and correspondingly provides a close fit according to the χ2 test, than the absorbed-PL model (i.e. Δχ2 and/or PF − test in Table 4). An additional BB component was required to achieve good spectral fits in about one-third of these objects (first part of the Table 4); the inferred electron temperatures are found to be in the range of 100−200 eV, which is slightly higher than those found for classic AGNs. Such high temperatures could be explained by the presence of a slim accretion disc in which the temperature is raised by photon trapping (Abramowicz et al. 1988; Mineshige et al. 2000). For another third of the missing-AGN subsample (second part of the Table 4), the best-fit models were achieved by the addition of a PCF component. The spectral fits for a partial covering model indicate that there were variations in both the absorption column density NH,z = (1−6) × 1021 cm-2 and covering factor f = 0.6−0.9. The measured strength of the non-absorbed X-ray primary emission from the neutral material is ⟨ 1 − f ⟩ = 0.32 ( ≥ 0.2 for the great majority) being slightly higher than those expected by type-2 AGNs (≤0.1−0.2).
Star-forming galaxies: best fit models for the star-forming galaxies.
For the remaining third of the sources, the low quality of their X-ray spectra did not allow us to choose between the various possible models. In summary, the X-ray spectra of the subsample of missing-AGNs were closely fitted by a rather steep power-law, to which a soft excess apparent at energies ≲ 2 keV should be added, when data of sufficiently high quality becomes available. This is totally in line with the assumption that this population is largely dominated by NLS1s.
3.3. True-SF subsample
In parallel, we conducted an X-ray spectral analysis of the true-SF subsample. We were able to perform the spectral analysis of 8 of the 38 sources only, because of the poor X-ray spectral quality of the remaining 30.
The X-ray spectra of local SF galaxies in the 0.5 − 10 keV band can be described by a combination of warm thermal emission (with typically kT ~ 0.6−0.8 keV) dominating at energies ≤ 1 keV, and a power-law spectrum responsible for producing the bulk of their 2−10 keV flux. The latter component has various interpretations, either in terms of an extremely hot (kT ≥ 5 keV) thermal component or a Γ ~ 2 power-law model for high mass X-ray binaries. Given that SF spectra often also exhibit strong collisionally excited emission lines, we used a MEKAL model (Mewe et al. 1985, 1986) to fit the thermal component. This component appeared at soft X-ray energies (below 1−2 keV), and we added a PL component to fit the hard X-ray spectrum. The X-ray spectra were modelled by adding both component which resulted in good fits for only 3 out of 8 objects (2XMM J140920.0+262219, 2XMM J093401.9+551428, and 2XMM J122254.6+154916, see Table 2) with kT ~ 0.6−3 keV and Γ ~ 2.2; the resulting parameters were consistent with those expected for a SF galaxy. The thermal component contributes significantly over the 0.3−10 keV range, supplying ~20% of the total flux. Hence, a hot gas starburst component was found to be present in the spectra of these three objects. The improvement to the fits when a MEKAL component was added to a PL in five of the remaining eight objects, was minimal with Δχ2 < 5 for two additional degrees of freedom (see Table 5). Hence, their X-ray spectra were modelled by a PL only, which resulted in an acceptable fit; the resulting parameters Γ ~ 1.7−2 were compatible with those for a SF galaxy, as expected. We therefore restricted our analysis of the remaining 30 sources to an inspection of the hardness ratios. In Fig. 2, we can see that the hardness ratio of all sources covers a wide range of values, and therefore we are unable to reach any firm conclusion based on these data. However, the invariably low values of the HR for these particular sources are consistent with them being dominated by a thermal spectrum, in full agreement with the expectation for SF galaxies.
As a final additional test, we fitted the missing-AGN X-ray spectra as if they were true-SF sources. We found that the soft X-ray excess is not properly described in terms of a thermal (MEKAL) emission in that case.
3.4. Missing-AGNs versus type-2 AGNs
We then assessed the different nature of the missing-AGN sources in terms of spectral fitting of known type-2 AGNs. To avoid composite objects we adopted the Kewley et al. (2001) criterion to secure optically classified AGNs. As for in the missing-AGN population, we only used the sources with a minimum of 50 counts in at least one detector. This requirement resulted in the selection of 56 AGNs. From inspection of the X-ray data, we excluded 15 of these objects that were dominated by the background above ~2−3 keV. Finally, we removed those sources that had previously been classified as LINERS. The final sample contains 34 bona-fide type-2 AGN candidates.
The results of our analysis are as follows:
-
1.
The spectra of 10 type-2 AGN (~29%) are best-fitted with a simple power-law. The average Γ obtained as a function of the 2−10 keV flux is softer ( ⟨ Γ ⟩ = 1.8) than the typical values of ~1.9 and ~2.1 found in the unabsorbed AGN and the missing-AGN subsamples, respectively.
-
2.
The spectra of 9 AGNs (~26%) could be most closely fitted by the addition of intrinsic absorption at the level of a few × 1022 cm-2 and the average Γ is also ⟨ Γ ⟩ ≅ 1.8.
-
3.
The addition of another PL component as a proxy for a partially covered absorber or scattering of the AGN light, was required to achieve good spectral fits in another 14 AGN (~41%). We found that the average photon index is ⟨ Γ ⟩ = 2.2 and the average intrinsic column denssity ⟨ NH,z ⟩ = 5 × 1023 cm-2. The measured amount of X-ray absorption for the missing-AGN subsample are lower (by two orders of magnitude), falling in the low part of the column density distribution of type-2 AGNs. The average measured strength of the non-absorbed X-ray primary emission by the neutral material was measured to be softer (~8%) than the average of the Missing-AGN subsample. Soft excess emission is not detected with an F-test significance > 99% in the vast majority of the objects.
-
4.
Finally, we found a significant X-ray soft excess in only 1 AGN (~3%), which is clearly negligible compared with the strong soft excess displayed by the missing-AGN subsample.
The conclusion is therefore that the X-ray properties of the missing-AGN population, which we interpret as being dominated by NLS1s, clearly differ from those of the type-2 AGNs in our sample.
 |
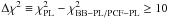
Fig. 8 The X-ray spaltral fitting and optical data for each object within Missing AGN sample. Objects order on the figure follows the Table 2. X-ray band fitting plot (Odd panels): the individual hard (2 − 10 keV) X-ray data has been fitted with a power-law model modified by absorption and we have added the soft component defined as the excess over an extrapolation down up to 0.3 keV of the best power-law model fitting to the hard X-ray band only for those objects where It was made possible by the statistics. Even panels: SDSS spectrum plotted as (log Fλ) in units of 1017 erg/cm2/s/Å. Note that, for two sources (163 and 335) we have not X-ray spectrum due to the low counts in the X-ray energy band. |
 |
Fig. 8 continued. |
4. Discussion
We investigated the nature of galaxies that are optically classified as star-forming, but whose X-ray luminosities are in excess of 1042 erg s-1, hence indicative of an AGN (missing-AGN subsample) by exploring both the X-ray and optical properties of a sample of NELGs. The availability of catalogues at different wavebands with wide sky coverage, allowed us to assemble optical (SDSS-DR7) and X-ray (2XMMi catalogue) information for a large sample of NELGs. A total of 1729 NELGs fall in the region covered by XMM-Newton observations, with which the 2XMMi catalogue was built. Out of these we find 211 X-ray detections, and 1518 upper limits.
For the 211 NELGs detected in X-rays, we compared the optical classification based on the BPT diagram with their hard X-ray luminosity used as an indicator of AGN activity. We found that about 40% of the BPT-AGN subsample exhibit low luminosities not exceeding 1042 erg s-1 (Weak-AGN subsample). Using other optical spectral features, such as the [OI] and [OII] emission lines, we find that 13% of these Weak-AGN subsample are classical LINERs and 29% are likely to be weak-[OI] LINERs. The LINER X-ray spectral energy distribution can be interpreted as a combination of a soft thermal component plus a hard power law (see González-Martín et al. 2006). This soft component may arise from circumnuclear star formation that could also explain their emission-line ratios.
However, the most striking result of this work is that virtually all sources in the missing-AGN subsample which have been classified as BPT-SF according to the BPT diagram and yet display clear signs of AGN activity in the X-ray band are unquestionably NLS1. To investigate this, we have calculated the hard X-ray luminosity, thickness parameter, X-ray-to-optical flux ratio and hardness ratio for the whole NELG sample. We found that it is not clear that we can distinguish between SF and AGN galaxies using a single criterion (Kauf03 or LX). However, the combined use of X/O flux ratio, T and HR allows us to distinguish between SF galaxies and AGNs. For our sample of NELGs including objects of high LXand low redshift (z < 0.4), we found that the distributions of values of both the thickness parameter (T) and X-ray-to-optical flux ratio (X/O) are bimodal, with the two populations being separated by about T ~ 1 and X/O ~ 0.1, respectively. We noted dichotomies in the BPT-SF population, i.e. between the missing-AGN subsample and True-SF galaxies, and on the other hand, in the BPT-AGN subsample, i.e. between the weak-AGN and strong-AGN subsamples.
We performed several tests to determine whether the emission coming from missing-AGNs arises as a result of star formation processes, or as AGN activity. The dichotomy in the BPT-SF population is directly linked to the values of Hβ FWHM: all the galaxies with high LX exhibit the broadest widths in the Hβ line, from ~ 600 to 1200 km s-1, whilst the remainding sources with LX < 1042 erg s-1, display an Hβ FWHM ≲ 600 km s-1. Indeed, the missing-AGN subsample has high values of both X/O and T and low measured hardness ratio for each source. So we conclude that these missing-AGNs are NLS1 candidates whilst the rest (true-SF population) are consistent with being SF galaxies.
Strong supporting evidence for the NLS1 nature of the missing- AGN population comes from a spectral analysis of their X-ray emission. The X-ray spectral properties of the missing-AGN subsample appear to be quite uniform. These spectra are well reproduced by the combination of black body or a partial covering absorption on a steep power-law component at hard X-ray energies. A complete study of their spectral energy distribution is in progress by Castelló-Mor et al. (in prep.). Furthermore, we have established evidence of a missing-AGN population displaying a soft X-ray excess, whenever spectra of sufficient S/N is available to model them. The missing-AGN population have Hβ lines FWHMs larger than 600 km s-1, and often display strong FeII emission.
Therefore, we conclude that the population of the missing-AGN subsample is entirely constituted of NLS1s with very moderate broad-line velocities (600 km s-1 ≲ FWHM(Hβ) ≲ 1200 km s-1), which have X/O > 0.1, T > 1 and the vast majority have strong soft X-ray excess.
The SDSS DR7 data archive server is available at http://www.sdss.org/dr7
Available from http://xmm.esac.esa.int
Optical and X-ray parameters are taken from SDSS-DR7 and 2XMMi-DR3, respectively.
FLIX: upper limit server for XMM-Newton data provided by the XMM-Newton Survey Science Centre.
We note that for most of the sources the X-ray data quality is too poor to attempt more sophisticated fits.
Acknowledgments
We are grateful to the referee for comments that helped improve the paper. N. Castelló-Mor gratefully acknowledges the warm hospitality in 2011 of the Physics Department of the University of Durham where part of this work was done, and the Spanish Ministerio de Ciencia e Innovación for a pre-doctoral fellowship. N.C.-M., X.B., L.B., and F.J.C. acknowledge partial financial support from the Spanish Ministerio de Ciencia e Innovación, through project AYA2010-21490-C02-01.
References
- Abramowicz, M. A., Czerny, B., Lasota, J. P., & Szuszkiewicz, E. 1988, ApJ, 332, 646 [NASA ADS] [CrossRef] [Google Scholar]
- Arnaud, K. A. 1996, in Astronomical Data Analysis Software and Systems V, eds. G. H. Jacoby, & J. Barnes, ASP Conf. Ser., 101, 17 [Google Scholar]
- Baldwin, J. A., Phillips, M. M., & Terlevich, R. 1981, PASP, 93, 5 [NASA ADS] [CrossRef] [EDP Sciences] [Google Scholar]
- Barth, A. J. 2002, in Issues in Unification of Active Galactic Nuclei, eds. R. Maiolino, A. Marconi, & N. Nagar, ASP Conf. Ser., 101, 147 [Google Scholar]
- Bassani, L., Dadina, M., Maiolino, R., et al. 1999, ApJS, 121, 473 [NASA ADS] [CrossRef] [Google Scholar]
- Bergeron, J., & Kunth, D. 1984, MNRAS, 207, 263 [NASA ADS] [Google Scholar]
- Caccianiga, A., Severgnini, P., Della Ceca, R., et al. 2007, A&A, 470, 557 [NASA ADS] [CrossRef] [EDP Sciences] [Google Scholar]
- Chevallier, L., Collin, S., Dumont, A.-M., et al. 2006, A&A, 449, 493 [NASA ADS] [CrossRef] [EDP Sciences] [Google Scholar]
- Civano, F., Mignoli, M., Comastri, A., et al. 2007, A&A, 476, 1223 [NASA ADS] [CrossRef] [EDP Sciences] [Google Scholar]
- Comastri, A., Mignoli, M., Ciliegi, P., et al. 2002, ApJ, 571, 771 [NASA ADS] [CrossRef] [Google Scholar]
- Crummy, J., Fabian, A. C., Gallo, L., & Ross, R. R. 2006, MNRAS, 365, 1067 [NASA ADS] [CrossRef] [Google Scholar]
- Della Ceca, R., Maccacaro, T., Caccianiga, A., et al. 2004, A&A, 428, 383 [NASA ADS] [CrossRef] [EDP Sciences] [Google Scholar]
- Dewangan, G. C., Mathur, S., Griffiths, R. E., & Rao, A. R. 2008, ApJ, 689, 762 [NASA ADS] [CrossRef] [Google Scholar]
- Dickey, J. M., & Lockman, F. J. 1990, ARA&A, 28, 215 [NASA ADS] [CrossRef] [MathSciNet] [Google Scholar]
- Fabian, A. C., Ballantyne, D. R., Merloni, A., et al. 2002, MNRAS, 331, L35 [NASA ADS] [CrossRef] [Google Scholar]
- Filippenko, A. V., & Terlevich, R. 1992, ApJ, 397, L79 [NASA ADS] [CrossRef] [Google Scholar]
- Fiore, F., Brusa, M., Cocchia, F., et al. 2003, A&A, 409, 79 [NASA ADS] [CrossRef] [EDP Sciences] [Google Scholar]
- Foschini, L., Braito, V., Palumbo, G. G. C., et al. 2004, A&A, 428, 51 [NASA ADS] [CrossRef] [EDP Sciences] [Google Scholar]
- Fukugita, M., Shimasaku, K., & Ichikawa, T. 1995, PASP, 107, 945 [NASA ADS] [CrossRef] [Google Scholar]
- Gallo, L. C., Lehmann, I., Pietsch, W., et al. 2006, MNRAS, 365, 688 [NASA ADS] [CrossRef] [Google Scholar]
- Gierliński, M., & Done, C. 2004, MNRAS, 349, L7 [NASA ADS] [CrossRef] [Google Scholar]
- Gierliński, M., & Done, C. 2006, MNRAS, 371, L16 [NASA ADS] [CrossRef] [Google Scholar]
- González-Martín, O., Masegosa, J., Márquez, I., Guerrero, M. A., & Dultzin-Hacyan, D. 2006, A&A, 460, 45 [NASA ADS] [CrossRef] [EDP Sciences] [Google Scholar]
- Grupe, D., Komossa, S., Leighly, K. M., & Page, K. L. 2010, ApJS, 187, 64 [NASA ADS] [CrossRef] [Google Scholar]
- Hao, L., Strauss, M. A., Tremonti, C. A., et al. 2005, AJ, 129, 1783 [NASA ADS] [CrossRef] [Google Scholar]
- Heckman, T. M. 1980, A&A, 87, 152 [NASA ADS] [Google Scholar]
- Iwasawa, K., Koyama, K., Awaki, H., et al. 1993, ApJ, 409, 155 [NASA ADS] [CrossRef] [Google Scholar]
- Jackson, F. E., Roberts, T. P., Alexander, D. M., et al. 2012, MNRAS, 422, 2 [NASA ADS] [CrossRef] [Google Scholar]
- Kauffmann, G., Heckman, T. M., Tremonti, C., et al. 2003, MNRAS, 346, 1055 [Google Scholar]
- Kennicutt, Jr., R. C. 1998, ARA&A, 36, 189 [Google Scholar]
- Kewley, L. J., Dopita, M. A., Sutherland, R. S., Heisler, C. A., & Trevena, J. 2001, ApJ, 556, 121 [Google Scholar]
- Lira, P., Ward, M., Zezas, A., Alonso-Herrero, A., & Ueno, S. 2002, MNRAS, 330, 259 [NASA ADS] [CrossRef] [Google Scholar]
- Maccacaro, T., Gioia, I. M., Wolter, A., Zamorani, G., & Stocke, J. T. 1988, ApJ, 326, 680 [NASA ADS] [CrossRef] [Google Scholar]
- Maiolino, R., Salvati, M., Bassani, L., et al. 1998, A&A, 338, 781 [NASA ADS] [Google Scholar]
- Maitra, D., & Miller, J. M. 2010, ApJ, 718, 551 [NASA ADS] [CrossRef] [Google Scholar]
- Mewe, R., Gronenschild, E. H. B. M., & van den Oord, G. H. J. 1985, A&AS, 62, 197 [NASA ADS] [Google Scholar]
- Mewe, R., Lemen, J. R., & van den Oord, G. H. J. 1986, A&AS, 65, 511 [NASA ADS] [Google Scholar]
- Mineshige, S., Kawaguchi, T., Takeuchi, M., & Hayashida, K. 2000, PASJ, 52, 499 [NASA ADS] [CrossRef] [Google Scholar]
- Osterbrock, D. E. 1981, ApJ, 249, 462 [NASA ADS] [CrossRef] [Google Scholar]
- Osterbrock, D. E., & Ferland, G. J. 2006, Astrophysics of gaseous nebulae and active galactic nuclei, 2nd edn. (Sausalito, CA: University Science Books) [Google Scholar]
- Osterbrock, D. E., & Pogge, R. W. 1985, ApJ, 297, 166 [NASA ADS] [CrossRef] [Google Scholar]
- Page, M. J., Loaring, N. S., Dwelly, T., et al. 2006, MNRAS, 369, 156 [NASA ADS] [CrossRef] [Google Scholar]
- Piconcelli, E., Jimenez-Bailón, E., Guainazzi, M., et al. 2005, A&A, 432, 15 [NASA ADS] [CrossRef] [EDP Sciences] [Google Scholar]
- Porquet, D., Reeves, J. N., O’Brien, P., & Brinkmann, W. 2004, A&A, 422, 85 [NASA ADS] [CrossRef] [EDP Sciences] [Google Scholar]
- Ranalli, P., Comastri, A., & Setti, G. 2003, A&A, 399, 39 [NASA ADS] [CrossRef] [EDP Sciences] [Google Scholar]
- Rigby, J. R., Rieke, G. H., Donley, J. L., Alonso-Herrero, A., & Pérez-González, P. G. 2006, ApJ, 645, 115 [NASA ADS] [CrossRef] [Google Scholar]
- Ross, R. R., Fabian, A. C., & Ballantyne, D. R. 2002, MNRAS, 336, 315 [NASA ADS] [CrossRef] [Google Scholar]
- Severgnini, P., Caccianiga, A., Braito, V., et al. 2003, A&A, 406, 483 [NASA ADS] [CrossRef] [EDP Sciences] [Google Scholar]
- Shakura, N. I., & Sunyaev, R. A. 1973, A&A, 24, 337 [NASA ADS] [Google Scholar]
- Stasińska, G., Cid Fernandes, R., Mateus, A., Sodré, L., & Asari, N. V. 2006, MNRAS, 371, 972 [NASA ADS] [CrossRef] [Google Scholar]
- Strüder, L., Briel, U., Dennerl, K., et al. 2001, A&A, 365, L18 [NASA ADS] [CrossRef] [EDP Sciences] [Google Scholar]
- Tanaka, Y., Boller, T., & Gallo, L. 2005, in Growing Black Holes: Accretion in a Cosmological Context, eds. A. Merloni, S. Nayakshin, & R. A. Sunyaev, 290 [Google Scholar]
- Trouille, L., & Barger, A. J. 2010, ApJ, 722, 212 [NASA ADS] [CrossRef] [Google Scholar]
- Trouille, L., Barger, A. J., Cowie, L. L., Yang, Y., & Mushotzky, R. F. 2009, ApJ, 703, 2160 [NASA ADS] [CrossRef] [Google Scholar]
- Trump, J. R., Impey, C. D., Taniguchi, Y., et al. 2009, ApJ, 706, 797 [NASA ADS] [CrossRef] [Google Scholar]
- Turner, M. J. L., Abbey, A., Arnaud, M., et al. 2001, A&A, 365, L27 [NASA ADS] [CrossRef] [EDP Sciences] [Google Scholar]
- Veilleux, S., & Osterbrock, D. E. 1987, ApJS, 63, 295 [NASA ADS] [CrossRef] [Google Scholar]
- Watson, M. G., Schröder, A. C., Fyfe, D., et al. 2009, A&A, 493, 339 [NASA ADS] [CrossRef] [EDP Sciences] [Google Scholar]
- Yan, R., Ho, L. C., Newman, J. A., et al. 2011, ApJ, 728, 38 [NASA ADS] [CrossRef] [Google Scholar]
- York, D. G., Adelman, J., Anderson, Jr., J. E., et al. 2000, AJ, 120, 1579 [Google Scholar]
- Zhou, H., Wang, T., Yuan, W., et al. 2006, ApJS, 166, 128 [NASA ADS] [CrossRef] [Google Scholar]
All Tables
Missing AGNs: results of fitting the spectral data with both a power law in the hard X-ray energy band (2−10 keV) and an absorbed power-law model across the whole X-ray spectrum (0.3−10 keV).
All Figures
|
Fig. 1 Emission line diagnostic diagram (BPT diagram) for the whole sample of NELGs. The curve separating the AGNs from the non-AGNs (bottom left) zone is taken from Kauffmann et al. (2003). Symbols change in both form and colour according to the hard X-ray luminosity, LX. To avoid confusion, only the mean errors are reported (bottom right). The estimated errors increase with decreasing log[NII]/Hα. |
| In the text | |
|
Fig. 2 Optical and X-ray properties. Upper two panels: |
| In the text | |
|
Fig. 3 X-ray luminosity as a function of the Hβ FWHM. The vertical dotted line marks the threshold of FWHM(Hβ) = 600 km s-1, while the horizontal dashed line corresponds to LX = 1042 erg/s. Different symbols are related to the optical classification: BPT-AGN as filled circles and BPT-SF as empty triangles. |
| In the text | |
|
Fig. 4 Distribution of the LHα/LX for missing-AGN sub-sample. |
| In the text | |
|
Fig. 5 Example of a typical NLS1 with a moderate Fe II emission (top panel) and, on the other hand, a SDSS spectrum of an Fe II-lacking NLS1 (bottom panel). Note in the last spectrum the very narrow Balmer emission lines and also the very weak Fe II multiplets; the prominent He II broad emission line ensures our classification as a type 1 AGN. |
| In the text | |
|
Fig. 6 Normalized distribution of the relative strength of the Fe II multiplets, R4570, for the missing-AGN subsample (filled histogram) and the NLS1 sample of Zhou et al. (2006). |
| In the text | |
|
Fig. 7 Distribution in Γ2 − 10 for the “missing AGN” when we fitted the individual data in the 2 − 10 keV energy range with a single power law modified by absorption in our Galaxy. The vertical line marks the expected value for objects of Seyfert 2 type. |
| In the text | |
|
Fig. 8 The X-ray spaltral fitting and optical data for each object within Missing AGN sample. Objects order on the figure follows the Table 2. X-ray band fitting plot (Odd panels): the individual hard (2 − 10 keV) X-ray data has been fitted with a power-law model modified by absorption and we have added the soft component defined as the excess over an extrapolation down up to 0.3 keV of the best power-law model fitting to the hard X-ray band only for those objects where It was made possible by the statistics. Even panels: SDSS spectrum plotted as (log Fλ) in units of 1017 erg/cm2/s/Å. Note that, for two sources (163 and 335) we have not X-ray spectrum due to the low counts in the X-ray energy band. |
| In the text | |
|
Fig. 8 continued. |
| In the text | |
Current usage metrics show cumulative count of Article Views (full-text article views including HTML views, PDF and ePub downloads, according to the available data) and Abstracts Views on Vision4Press platform.
Data correspond to usage on the plateform after 2015. The current usage metrics is available 48-96 hours after online publication and is updated daily on week days.
Initial download of the metrics may take a while.