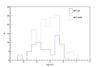
Fig. 2
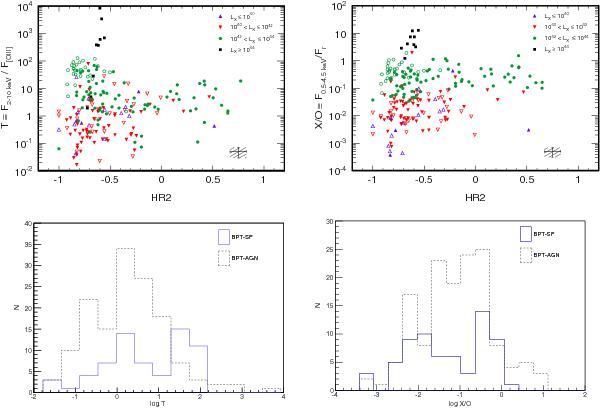
Optical and X-ray properties. Upper two panels:  versus HR (on the left) and the X-ray-to-optical flux ratio distribution as a function of HR (on the right). Different symbols mark X-ray luminosity and the filled/empty symbols represent the optical classification (BPT-AGN and BPT-SF, respectively). In both plots, the point with the error bars is a fake source to represent the error mean value of the parameters. Bottom two panels: distribution of the thickness parameter (on the left) and the X/O distribution (on the right) for the two optical subsamples.
Current usage metrics show cumulative count of Article Views (full-text article views including HTML views, PDF and ePub downloads, according to the available data) and Abstracts Views on Vision4Press platform.
Data correspond to usage on the plateform after 2015. The current usage metrics is available 48-96 hours after online publication and is updated daily on week days.
Initial download of the metrics may take a while.