| Issue |
A&A
Volume 686, June 2024
|
|
|---|---|---|
| Article Number | A223 | |
| Number of page(s) | 11 | |
| Section | Extragalactic astronomy | |
| DOI | https://doi.org/10.1051/0004-6361/202347983 | |
| Published online | 14 June 2024 | |
What excites the optical emission in X-ray-selected galaxies?⋆
1
Max-Planck-Institute for Astronomy, Königstuhl 17, 69117 Heidelberg, Germany
e-mail: pulatova@mpia.de
2
Main Astronomical Observatory of the National Academy of Sciences of Ukraine, Akademika Zabolotnoho str. 27, Kyiv 03143, Ukraine
3
Department of physics, Taras Shevchenko Kyiv National University, Glushkova 2 ave., building 1, Kyiv 03680, Ukraine
4
Niels Bohr Institute, Experimental Particle Physics, Blegdamsvej 17, 2100 København Copenhagen, Denmark
5
Jagiellonian University Faculty of Physics, Astronomy and Applied Computer Science, ul. prof. Stanislawa Lojasiewicza 11, 30-348 Krakow, Poland
Received:
15
September
2023
Accepted:
22
March
2024
We present a study of 1347 galaxies at z < 0.35 with detected nuclear X-ray emission and optical emission line diagnostics in the Baldwin-Phillips-Terlevich (BPT) diagram. This sample was obtained by cross-matching the XMM-Newton DR10 catalogue with Sloan Digital Sky Survey (SDSS) DR17 galaxies with well-measured line ratios. The distribution of these sources in the BPT diagram covers all three excitation regimes: Ionized Hydrogen (HII) regions (23%), ‘composites’ (30%), and Seyfert galaxies with the low ionization nuclear emission line regions (47%). In contrast, the fraction of objects classified as active galactic nuclei (AGN) in the SDSS subsample selected for cross-match with XMM-Newton is only 13%. This fact illustrates that X-ray emission from galaxies commonly points towards the presence of AGN. Our data show, for the first time, a clear dependence of the BPT position on the ratio of the X-ray to Hα fluxes. Sources dominated by X-ray emission lie in the Seyfert and LINER regimes of the BPT diagram. Most sources with a low X-ray-to-Hα-luminosity ratio, log10(LX/LHα) < 1.0, lie in the HII regime. In our sample, there are even 45 galaxies that have LXRStar/LXrayTotal > 0.5. In contrast, the positions of the sample members in the BPT diagram exhibit no dependence on the X-ray hardness ratio. Our finding suggests that the X-ray-to-Hα ratio can help us to differentiate galaxies whose X-ray flux is dominated by an AGN from galaxies with central X-ray binaries and other stellar X-ray sources.
Key words: quasars: emission lines / galaxies: Seyfert / galaxies: star formation / X-rays: galaxies
The catalogue of X-ray galaxies is available at the CDS via anonymous ftp to cdsarc.cds.unistra.fr (130.79.128.5) or via https://cdsarc.cds.unistra.fr/viz-bin/cat/J/A+A/686/A223
© The Authors 2024
 Open Access article, published by EDP Sciences, under the terms of the Creative Commons Attribution License (https://creativecommons.org/licenses/by/4.0), which permits unrestricted use, distribution, and reproduction in any medium, provided the original work is properly cited.
This article is published in open access under the Subscribe to Open model.
Open access funding provided by Max Planck Society.
1. Introduction
The origin of the ‘nuclear emission’ in galaxies, which is seen across a wide range of the electromagnetic spectrum, has been the focus of astrophysical studies for decades. Baldwin et al. (1981) proposed a powerful way to understand what physical processes dominate gas ionisation based on the flux ratios of forbidden optical lines in the interstellar medium. This criterion relies on four reddening-insensitive line ratios: [OIII/H]β, [NII]/Hα, [SII]/Hα, and [OI]/Hα.
The Baldwin-Phillips-Terlevich (BPT) diagram was intended to separate two sources of ionisation: active galactic nuclei (AGN) or accretion discs around the supermassive black hole (SMBH), and young, massive hot stars, that is the host galaxy component. Kauffmann et al. (2003) defined the extreme starburst line to make a semi-empirical fit to the outer bound of the Sloan Digital Sky Survey (SDSS) galaxy spectra. This outer bound defines the region where composite starburst–AGN objects are expected to lie on the diagnostic diagrams. Later, Kewley et al. (2006) proposed an empirical relation to separate Seyfert galaxies from low ionisation nuclear emission-line regions (LINERs). Kauffmann et al. (2003) defined these latter as regions with [OIII] and Hα narrow-line region (NLR) emission-line luminosities in the range of ∼105 − 106 L⊙. LINERs are found in galaxies of earlier Hubble type than Seyfert galaxies, and their nuclear continua are usually dominated by old stars. According to the BPT diagram, galaxies with emission lines can be separated into the following categories depending on the type of source of ionisation that dominates there: Seyfert, LINERs, and HII regions.
We investigated the X-ray emission from star forming regions and AGN separately. X-ray-selected galaxies can play a crucial role in our understanding of these sources: if the dominant X-ray emission inevitably comes from the accretion onto the SMBH, and if it is this process that dominates the excitation of the optical emission lines, we should expect the optical line diagnostics of X-ray-selected galaxies to place them predominantly in the AGN regime in the Kewley version of the BPT diagram. Torbaniuk et al. (2021) used a sample of X-ray-selected galaxies to quantify the level of AGN activity by applying multi-wavelength AGN-selection criteria (optical BPT diagrams, X-ray/optical ratio, etc.). The authors compared specific black hole accretion rates for AGN-dominated, quiescent galaxies and galaxies with active star formation. They concluded that the level of AGN activity decreased with cosmic time, and they found a scenario where both star formation and AGN activity are fueled by a common gas reservoir.
2. SDSS galaxies with nuclear X-ray emission
In this work, we study the X-ray emission and optical emission lines from X-ray-selected galaxies from SDSS Sky Survey DR17 (Blanton et al. 2017). To this end, we created a new sample of 1347 galaxies at z < 0.35 by cross-matching SDSS DR17 with X-ray Multi-Mirror Mission Observatory – Newton (XMM-Newton) DR10 (Webb et al. 2020).
2.1. Data
In our work, we used data from the XMM-Newton observatory to study the X-ray emission of galaxies. We chose 4XMM-Newton X-ray Source Catalogue Data Release 10 (hereafter 4XMM-DR10), as it is one of the largest publicly available repositories of X-ray data from a single observatory (Webb et al. 2020). The 4XMM-DR10 database contains 849 991 detections of 575 158 unique sources over 2.85% of the sky. We used data from the PN camera, which has an angular resolution of 6.6 arcsec (full width at half maximum (FWHM)) in the energy range of 0.2–15 keV (Strüder et al. 2001). We cross-matched 4XMM-DR10 with 204 895 SDSS-selected galaxies using the ‘Sky’ algorithm from the TOPCAT software with a separation of 6.0″. For more information, see https://www.g-vo.org/pmwiki/uploads/VOWorkshop/topcat.pdf, and Sect. 2.2). The sample of 204 895 SDSS galaxies was selected using the following criteria:
1. Galaxies with spectra with fractional flux uncertainties of ≤33% or 0.13 dex (Bolton et al. 2012).
2. Narrow-line galaxies with σline < 200 km s−1. This criterion corresponds to the SDSS limit for narrow-line galaxies. Type 1 AGN galaxies with broad lines (σline > 200 km s−1) cannot be plotted correctly on the BPT diagram (Bolton et al. 2012).
3. These criteria were applied to emission lines [OIII], [OI] λλ5007,6300, [NII] λλ6548,6584, [SII] λλ 6717, 6731 doublets, Hα, Hβ.
We also cross-matched the X-ray catalogue with the full SDSS sample and then applied the quality cuts after the matching. We ended up with nearly the same sample, which implies that source confusion (matching the wrong optical source to the X-ray source) is not a significant issue.
2.2. Sample of X-ray galaxies with emission lines and its general properties
Our cross-match result is a sample of 1364 emission line galaxies with nuclear X-ray emission. Some of these matched sources could be incorrect because the closest match is not necessarily the counterpart. In our previous work, we carried out manual inspection of X-ray and optical sources from the SIMBAD and XMM-IRAP databases (Zadorozhna et al. 2021). In the present study, we quantified the potential contamination by shifting the positions of the X-ray sources by random amounts that are larger than the source-matching radius. After this, we again matched ‘shifted’ X-ray sources with SDSS DR17. As a result, we only got 51 false matches, which corresponds to 3.7%. We used the optical emission-line fluxes from the SDSS DR17 data release to find the positions of X-ray-selected galaxies on the BPT diagrams. This allows us to determine the source of excitation in these galactic nuclei. After visual inspection of the BPT diagram (see Fig. A.1), we found that some galaxies lie below the LINER position for most of the objects from the sample. We separated these galaxies from the primary sample and reviewed every individual galaxy (for more details, please see the Appendix). After careful checking, we removed 17 galaxies from the primary sample. The last two galaxies, SDSS J015308.29+010150.6 and SDSS J130340.81+534323.6, are located at the end of the LINER region. We obtained a final sample that contains 1347 X-ray-selected galaxies at z < 0.35 that covers the northern sky. This number corresponds to 0.6% of the SDSS galaxies with good optical spectra and 0.2% of the XMM-Newton X-ray sources, respectively.
For each galaxy, we included the following parameters: Right Ascension (deg), Declination (deg), redshift (z), optical emission line flux with errors: [OIII],[OI] λ5007,6300, [NII] λλ6548,6584, [SII] λλ6717,6731 doublets, Hα, Hβ in 10−17 erg s−1 cm−2 Å−1, X-ray flux in the total photon energy band with errors (0.2 − 12 keV) from the XMM-DR10 catalogue (erg cm−2 s−1), hardness ratio (HR), and the angular separation between the position of the centre of a galaxy and the X-ray source.
Figures 1–3 present the general properties of the sample. Figure 1 shows the distribution of 1347 galaxies with nuclear X-ray emission in equatorial coordinates. From this distribution, we see that SDSS X-ray-selected galaxies cover the northern sky, and follow the distribution of SDSS galaxies. The equator region with higher spatial density corresponds to Stripe 82 (LaMassa et al. 2013, 2016). SDSS observed this region intensively during 2005, 2006, and 2007. The zone of avoidance in the northern sky corresponds to the Milky Way galaxy. The distribution of X-ray-selected galaxies in equatorial coordinates is homogeneous over the northern sky. The distance between the X-ray source and the optical centre of the galaxy is less than 1 arcsec apart, for more than half of X-ray-selected galaxies (see Fig. 2). The number of X-ray galaxies rapidly decreases with angular separation from 1 arcsec to 3.5 arcsecs from n = 125 at r = 1 arcsec to n = 35 at r = 3.5 arcsec, and after r = 3.5 arcsec and then come to a plateau. We plot the distribution of 1347 SDSS galaxies with a nuclear X-ray source as a function of redshift in Fig. 3. The minimum and the maximum values are ≈0 and 0.362, respectively. For galaxies located at higher redshift (z > 0.35), Hα optical line will be outside the SDSS cutoff wavelength of 9200 Å. For z > 1.14, Hβ is redshifted out of the wavelength range. The distribution of SDSS X-ray-selected galaxies peaks at z ∼ 0.03, and then the number of galaxies decreases with increasing z. The mean and median values for the distribution as a function of redshift are 0.076 and 0.064, respectively.
 |
Fig. 1. Distribution of the sample of 1347 X-ray-selected galaxies in equatorial coordinates. |
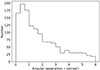 |
Fig. 2. Distribution of 1347 SDSS X-ray galaxies in terms of the angular separation between the SDSS optical centre of the galaxy and the XMM-Newton X-ray source. |
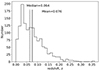 |
Fig. 3. Distribution of 1347 SDSS galaxies with X-ray nuclear emission in terms of redshift, z. |
Figure 4 presents the distribution of the SDSS X-ray-selected galaxies as a function of HR, showing HR1-HR4. The HR is the equivalent of a photometric colour index, and is calculated as a normalized difference of the exposure corrected counts in two energy bands.
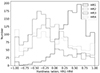 |
Fig. 4. Distribution of 1347 SDSS X-ray-selected galaxies in terms of hardness ratio, HR1-HR4, according to data from the XMM-Newton catalogue. |
For HR1, the commonly used bands are 0.2–0.5 keV and 0.5–1.0 keV. For HR2, the bands 0.5–1.0 keV and 1.0–2.0 keV are used. For HR3, 1.0–2.0 keV and 2.0–4.5 keV are used. Finally, for HR4, 2.0–4.5 keV and 4.5–12.0 keV are used. For more information about the hardness ratio, readers can refer to the XMM-Newton tools website1. From the distribution in the BPT diagram of X-ray-selected galaxies with the HR colour code, we conclude that there is no apparent correlation between the optical type (star formation (SF), AGN, composite) of X-ray galaxies and their HR. However, at the same time, we find a correlation between X-ray-to-Hα flux ratio and optical type. This could be due to the location of the Hα emission line (accretion disc), while X-ray emission comes from the corona.
From the general parameters of the sample, we conclude that most galaxies from the sample belong to the local Universe, and the sample can be considered homogeneous. A benefit of using this SDSS X-ray-selected galaxy sample is that it covers almost all of the northern sky, and is therefore representative of X-ray galaxies in the nearby Universe.
3. Results
In this section, we show how we investigated the position of X-ray-selected galaxies in the BPT diagram as a function of two quantities: the X-ray hardness ratio, HR1-4, and the X-ray-to-Hα flux ratio. Figure 5 displays the distribution of the 1347 X-ray-selected galaxies on the [NII]/Hα version of the BPT diagram. The data points are colour coded according to X-ray hardness ratios (HR1-HR4). Figure 6 presents the full range of BPT diagrams ([NII]/Hα, [SII]/Hα, and [OI]/Hα as the x-axes). The colour code indicates the X-ray-to-Hα flux ratio (Fig. 6a) and the redshift z (Fig. 6b). We also include a comparison with 204 895 galaxies from the SDSS-DR17 dataset in both figures. These galaxies meet the criteria of σ log f ≤ 0.13 for all lines and σline < 200 km s−1; they are plotted as a grey background in the diagrams.
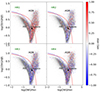 |
Fig. 5. Position of 1347 SDSS X-ray-selected galaxies on the [NII]/HαBPT diagram. The grey background circles show 204 895 SDSS-DR17 galaxies that satisfy the conditions for optical spectra σ log f ≤ 0.13 and σline < 200 km s−1. Empirical lines (dashed blue and solid red) that separate LINERs from Seyfert galaxies are from Kewley et al. (2006). The colour code represents the hardness ratios among the HR1, HR2, HR3, and HR4 bands. |
– We confirm that X-ray-selected galaxies can lie in all regimes of the BPT diagram: Seyfert 25%, LINERs 22%, composite (30%), and HII (23%). For the sample of 204 895 SDSS galaxies with emission lines (plotted as a grey background), AGNs make up only 13%, which is consistent with Kewley et al. (2006). This fact has two immediate implications: X-ray-selected emission-line galaxies have a much higher (3.5×) incidence of AGN than the parent sample of galaxies with narrow emission lines; and the majority of X-ray-detected galaxies with narrow emission lines (at least in our sample) are not AGN dominated according to their optical emission lines.
– From the distribution in the BPT diagram of X-ray-selected galaxies with the HR colour code, we conclude that there is no apparent correlation with HR.
– We checked how many galaxies from our sample have the X-ray luminosity LX > 3 × 1042 erg s−1, and can be classified as AGN according to Torbaniuk et al. (2021). According to this classification, we find 214 AGNs among 1347 X-ray-selected galaxies (16%). The percentage of X-ray AGNs grows from the star forming galaxy category to the Seyfert optical category: 6 from 316 (1.8%) star forming galaxies, 52 from 405 (12.8%) composite galaxies, and 176 from 626 (28%) Seyfert galaxies with LINERs. This means that X-ray AGNs (LX > 3 × 1042 erg s−1) can be found in all optical categories. However, the highest percentage of X-ray AGNs is found in Seyfert galaxies and LINERs. This result shows that X-ray luminosity is a necessary but insufficient condition for identifying a source as an AGN.
– We show, for the first time, that the X-ray-to-Hα flux ratio is a good predictor of the BPT regime in which a galaxy located: almost all the objects with the highest X-ray-to-Hα ratios, log10(LX/LHα) > 1.0, are located in the AGN regime. Almost all the galaxies with low ratios, log10(LX/LHα) < 1.0, are located in the H II regime.
The distinct pattern in the colours of the data points (reflecting log10(LX/LHα) in Fig. 6a (top) reflects the power of the log10(LX/LHα) flux ratio as a predictor of the excitation mechanism. The bottom panel of Fig. 6 explores whether aperture corrections or the distance to the object play a significant role. The absence of a redshift dependence in the BPT position implies that such effects are insignificant.
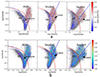 |
Fig. 6. Distribution on the BPT diagram (Baldwin et al. 1981) of 1347 SDSS X-ray-selected galaxies. Empirical lines (dashed blue and solid red) that separate LINERs from Seyfert galaxies are from Kewley et al. (2006). The grey background circles show all the 204 895 SDSS-DR17 galaxies that satisfy our basic optical quality cuts: all line fluxes have fractional uncertainties of < 0.13 dex (33%) and are ‘narrow’ σline < 200 km s−1. The colour bar represents X-ray/Hα flux ratio (6a) and redshift z (6b) and corresponds only to 1347 SDSS X-ray-selected galaxies. |
To detect the type of ionisation that influences the X-ray and Hα luminosities, we plot the distribution of SDSS X-ray-selected galaxies in the X-ray versus Hα plane in Fig. 7. The plot is similar to Fig. 6 but adds additional information about the distribution of X-ray and Hα luminosities for different types of excitation mechanisms in galaxies. In Fig. 7, we separate the whole sample of 1347 SDSS X-ray-selected galaxies into three groups (AGN, composite galaxies, and star-forming galaxies) according to their position on the [NII]/Hα diagram (source of ionisation). These three groups are colour coded in Fig. 7.
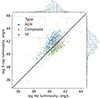 |
Fig. 7. Positions of 1347 SDSS X-ray selected galaxies on X-ray versus Hα luminosities plane. X-ray luminosity is in the range 0.2–12 keV and in erg s−1, Hα luminosity is in erg s−1. Type of ionisation (AGNs, Composite, SF) corresponds to the position of X-ray galaxy on [OIII]/Hβ versus [NII]/Hα BPT diagram. AGNs are marked with blue circles, Composites - with orange crosses, and SF – with green squares. |
From Fig. 7, we see that the peaks of the distribution of the X-ray-selected galaxies correspond to different types of ionising sources. The first peak in Hα luminosity at 3 × 1040 corresponds to AGN, and the second two belong to composite and star-forming galaxies. The distribution of Hα luminosity for composite and star-forming galaxies shows flat peaks of about 1041 erg s−1. The peak in the Hα luminosity distribution for AGNs is one order less than for composite and star-forming galaxies. The opposite situation is seen for X-ray luminosity. From Fig. 7, we see that the maximum of the distribution of X-ray-selected AGNs in the energy range of 0.2–12 keV corresponds to 1042 erg s−1, while for star-forming and composite galaxies, the maximum of the distribution matches 1041 erg s−1. The distribution of X-ray-selected AGNs is almost symmetrical to the black line in the centre of Fig. 7, and star-forming and composite X-ray-selected galaxies are located mostly below the black line. AGNs are mostly brighter in X-rays than star-forming and composite galaxies.
The distribution on the log10[OIII] versus log10Hα luminosity plane of SDSS X-ray-selected galaxies (left) and 204 895 SDSS galaxies (right) (see Fig. 8) shows the same general behaviour. The brightest in [OIII] luminosity are AGNs in both samples with peak values of about 1040 erg s−1. Composite galaxies then follow, with peak values of about 8 × 1039 erg s−1. The weakest of the three optical categories is the star-forming galaxies, with a peak in [OIII] luminosity corresponding to 5 × 1039 erg s−1. A different situation is seen for log10Hα luminosity. The brightest are composite galaxies with peak values of about 1041 erg s−1 for both samples. The distributions of star-forming galaxies and AGNs both show peaks at 5 × 1040 erg s−1. The main difference between the two plots is that AGN dominate the distribution of X-ray-selected galaxies, while star-forming galaxies dominate the SDSS sample.
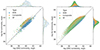 |
Fig. 8. Distribution on the log10[OIII] versus log10Hα plane of SDSS X-ray selected galaxies (left) and 204 895 SDSS galaxies (right). Type of ionisation (AGNs, Composite, SF) corresponds to the position of X-ray galaxy on [OIII]/Hβ versus [NII]/Hα BPT diagram. |
We calculated the part of X-ray emission from the stellar component in SDSS X-ray-selected galaxies. To this end, we used the method described in Lehmer et al. (2010):
where  and
and 
 traces the combined emission from high-mass X-ray binaries (HMXBs) and low-mass X-ray binaries (Lehmer et al. 2010). This empirical equation was obtained based on high-resolution Chandra observations.
For the M* and SFR in Eq. (1), we used data from Chang et al. (2015).
For 1262 SDSS X-ray-selected galaxies, we obtained the relation between X-ray emission from X-ray binaries and the total X-ray emission from XMM-Newton data. The results are plotted in Fig. 9.
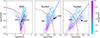 |
Fig. 9. BPT diagram for 1262 SDSS X-ray selected galaxies. Empirical lines (dashed blue and solid red) that separate LINERs from Seyfert galaxies are from Kewley et al. (2006). The relation between X-ray luminosity from the stellar component and the total X-ray luminosity from the XMM-Newton observations is shown with colour coding. |
The AGN component dominates the X-ray emission for almost the entire sample  , except for 45 objects that are preferentially located at the lower end of the BPT. These galaxies could be pure X-ray AGN-free galaxies (Tugay & Vasylenko 2011). The AGN dominance is stronger for Seyferts than for LINERS and HII regions. To investigate this question further, we plotted the star-formation rate (SFR) and masses of the stellar component on the BPT diagram, using a colour code (see Fig. 10). By separating the stellar X-ray components, we see that LINERS have higher stellar masses and much lower SFRs than Seyferts. In the HII region, objects with a low SFR also have low masses.
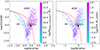 |
Fig. 10. BPT diagram for 1262 SDSS X-ray-selected galaxies. The empirical lines (dashed blue and solid red) that separate LINERs from Seyfert galaxies are from Kewley et al. (2006). The mass of the stellar component (left) and the SFR (right) from Chang et al. (2015) are shown with colour coding in the respective panels. |
4. Discussion and conclusion
It is commonly accepted that most X-ray emission in the Universe originates from AGN but some amount could come from the stellar population of a host galaxy. For a detailed study of the physical mechanism inside AGNs and star-forming galaxies, separating stellar and AGN components in optical spectra is essential. Contributions to the emission-line spectrum from both star formation and the AGN are almost inevitable in many SDSS galaxies, given the relatively large projected aperture size of the fibres (5.5 kpc diameter at z = 0.1; Kauffmann et al. 2003).
The connection between star formation and the central SMBH has been investigated in multiple studies. Stellar feedback from a young nuclear star cluster has been shown to influence the interstellar medium at the centres of AGN (Schartmann et al. 2009; Costa et al. 2014; Hopkins et al. 2016; Shangguan et al. 2020). However, AGN located inside the galaxy can also influence star formation in the host galaxy. These effects are called negative and positive AGN feedback. Through such processes, AGN can suppress or trigger star formation in the host galaxy (Croton et al. 2006; Ishibashi & Fabian 2012; Cresci & Maiolino 2018; Stemo et al. 2020).
The interdependence of the emission in X-rays and optical lines was discovered at the end of the 20th century. For example, in luminous sources, strong correlations exist between Hα, Hβ, [OIII]λ5007 luminosities, and X-ray luminosities (Elvis et al. 1984; Ward et al. 1988; Mulchaey et al. 1994). Many authors have used the X-ray-to-optical(continuum) flux ratio to identify AGN in their host galaxies (Brandt & Hasinger 2005; Fitriana & Murayama 2022; Torbaniuk et al. 2021). Brandt & Hasinger (2005) list three AGN criteria:
– An intrinsic X-ray luminosity, LX, int > = 3 × 1042 erg s−1;
– An X-ray-to-optical flux ratio of log10 (fX/fopt) > − 1;
– An X-ray-to-IR flux ratio of log10(fX/fKs) > − 1.2.
The interdependence of X-ray and optical flux in the r-band was revealed based on a study of a sample of 6181 X-ray sources from the Stripe-82X survey (Ananna et al. 2017). The authors claim that objects with log10X/O > 1 and R − K(Vega magnitude) > 5 are candidates for heavily obscured AGNs. Our investigation partially confirms this result. Namely, we find that galaxies with log10(LX/LHα) > 1.0 are linked to LINER or Seyfert-type nuclear activity.
A series of works is devoted to BPT diagnostic diagrams for X-ray AGNs. Birchall et al. (2022) present a sample of 917 X-ray-selected AGN within the local galaxy population. Similarly to the present work, these authors created their sample from galaxies listed in SDSS DR8 and 3XMM DR7. The BPT diagnostic diagram can be used to confirm an AGN inside a host galaxy. The BPT diagnostic is more effective at reliably identifying sources as AGN in higher-mass galaxies. These latter authors used this sample to calculate the incidence of AGN as a function of stellar mass and redshift. Their main finding is that the fraction of galaxies hosting AGN above a fixed specific accretion rate limit of 10−3.5 is constant (at ∼1%) over stellar masses of 8 < log10M*/M⊙< 12 and increases (from ∼1% to 10%) with redshift.
Torbaniuk et al. (2021) used the sample of X-ray-selected galaxies to quantify the level of AGN activity by applying multi-wavelength AGN-selection criteria (optical BPT-diagrams, X-ray/optical ratio, etc.).
The present work is different because Torbaniuk et al. (2021) used flux in only one line from two doublets, [NII] λ6583 and [SII] λ6717, to find the position of a galaxy on the BPT diagrams. In our work, we consider both doublet lines [NII] λλ 6548, 6584, [SII] λλ 6717, 6731, as was done in the original work of Baldwin et al. (1981). We restrict our sample to SDSS spectra whose fractional flux uncertainties in all lines are ≤0.13 dex.
For a more detailed investigation of the relationship between X-ray and Hα flux for AGNs and star-forming galaxies, we separated the sample of 1347 X-ray-selected galaxies into four groups according to their position on the BPT diagram and the type of ionisation that dominates; these are star-forming galaxies, composite galaxies, Seyfert galaxies, and LINERs (See Table 1). As Table 1 shows, 23% of the 1347 X-ray-selected galaxies belong to pure galaxies with star-forming regions. Seyfert galaxies and LINERs make up less than 50% of all X-ray galaxies and can be divided into almost equal parts of about 20% each. In the original work of Kewley et al. (2006), the authors used the sample of 85 224 galaxies, finding 63 893 (75%) star-forming galaxies, 2411 (3%) Seyferts, 6005 (7%) LINERs, and 5870 (7%) composite galaxies, as well as 7045 (8%) galaxies of an ambiguous nature. We find that the fraction of galaxies with an AGN type of nuclear activity is significantly higher among X-ray-selected galaxies (47%) compared to that of the total sample of 204 895 SDSS galaxies (about 13%, or three times lower; see Table 1). This means that a major part of X-ray emission in galaxies comes from central SMBHs. However, SMBHs are not the only source of X-ray emission from galaxies; it can arise from star forming regions as well. When we compare the sample of 204 895 SDSS galaxies with 1347 X-ray-selected galaxies, we see that the two samples differ in their fraction of star-forming galaxies. More than half (57%) of the SDSS-selected galaxies are star-forming galaxies as defined based on their nuclear activity, while for the X-ray-selected galaxies, this fraction is less than one-quarter (23%). We conclude that most galaxies in the HII regime have no detectable X-ray emission (weak X-ray emission from star formation may be present). We explore the star-formation activity in a galaxy using the optical spectra, and the Hα line in particular; from [OIII], we can obtain information about AGN activity (Panessa et al. 2006).
Distribution of 1347 SDSS X-ray-selected galaxies and 204 895 SDSS galaxies (the last column), according to their position on the BPT diagram.
In all these analyses involving the BPT diagram, we need to define a minimum quality cut for the flux measurements of all emission lines to ensure sufficient precision on the locations of all entries within the BPT diagram. Therefore, we chose the weakest line with the lowest signal-to-noise ratio (S/N) for the sample, namely [SII] (see Fig. 11). Following convention (e.g. Bolton et al. 2012), we adopt a maximal fractional flux uncertainty of 33% or 0.13 dex (see Eq. (2) if  ) for the Hα, [NII], [SII], and [OIII] lines. We find that at high S/N (S/N > 30, Fig. 12), the fraction of composite galaxies increases significantly compared to SF and Seyfert+LINER. Therefore, increasing the S/N > 3 may influence the selection criteria, as we will get a higher fraction of composite galaxies, which are prevalent in the local Universe. The right panel of Fig. 12 shows that the probability density function for log(X-ray/Hα) has a more symmetrical form with S/N > 3 compared to S/N > 10. We conclude that S/N > 3 is an optimal criterion that provides results of sufficient quality and allows us to create the most homogeneous sample of objects with which to study their properties.
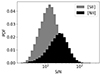 |
Fig. 11. Probability density function of S/N for [NII] and [SII] doublets for 204 895 SDSS galaxy spectra. We choose the weakest line for S/N selection criteria; that is, [SII]. |
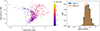 |
Fig. 12. Distribution of SDSS X-ray-selected galaxies Left: galaxies with S/N > 30 on the [SII] version of the BPT diagram (Baldwin et al. 1981). Compared to Fig. 6, the contribution of composite-type galaxies increases. The colour bar represents the X-ray/Hα flux ratio. Right: PDF of log(X-ray/Hα) for S/N 3 and 10, respectively. |
Summarising our findings and conclusions, we find a clear dependence of the BPT position on the X-ray-to-Hα flux ratio. Sources dominated by X-ray emission lie in the AGN and LINER regime of the BPT diagram. Almost all sources with low X-ray-to-Hα luminosity ratio, log10(LX/LHα) < 1.0, lie in the HII regime. Our findings suggest that the X-ray-to-Hα ratio can be used to differentiate galaxies whose X-ray flux is dominated by an AGN from those with central X-ray binaries and other stellar X-ray sources. We find that from XMM-Newton observations of Seyfert galaxies, the fraction of the total X-ray emission coming from the stellar component is less than 1/30. The galaxies with more than 50% of their total X-ray emission coming from the stellar component ( for 45 galaxies of our sample) are characterised by a dominance of X-ray emission from the stellar component. The galaxies for which the highest fraction of X-ray emission is from the stellar component are located at the bottom of the BPT diagram and are the galaxies that follow the green line that separates LINERs from Seyferts. These galaxies could be candidates for pure X-ray AGN-free galaxies.
Acknowledgments
Pulatova Nadiia is grateful to the Deutsche Forschungsgemeinschaft for supporting the project and managing director of the Max Planck Institute for Astronomy, Thomas Henning, for his kind invitation to work at the Institute, which made this work possible. We are grateful to Igor Chilingarian, Andrea Merloni and Andrey Zhiglo for their useful comments and advice on this work. L. V. Zadorozhna is thankful to Dr. Chunshan Lin for his hospitality at the Institute of Theoretical Physics, Jagiellonian University. L.V. Zadorozhna gratefully acknowledges financial support from the National Science Center Poland, grants No. UMO-2021/40/C/ST9/00015, UMO-2018/30/Q/ST9/00795. This research was carried out with the support of the Center for the Collective Use of Scientific Equipment “Laboratory of High Energy Physics and Astrophysics” of the Taras Shevchenko National University of Kyiv. The authors are grateful to Alexander J. Dimoff (Max-Planck-Institut für Astronomie) for the helpful suggestion, which has improved the English text of our paper. We thank the anonymous referee for the helpful comments. This research has made use of data obtained from the 4XMM XMM-Newton serendipitous source catalogue compiled by the 10 institutes of the XMM-Newton Survey Science Centre selected by ESA. Funding for the Sloan Digital Sky Survey IV has been provided by the Alfred P. Sloan Foundation, the US Department of Energy Office of Science, and the Participating Institutions. SDSS-IV acknowledges support and resources from the Center for High Performance Computing at the University of Utah. The SDSS website is https://www.sdss.org. SDSS-IV is managed by the Astrophysical Research Consortium for the Participating Institutions of the SDSS Collaboration including the Brazilian Participation Group, the Carnegie Institution for Science, Carnegie Mellon University, Center for Astrophysics | Harvard & Smithsonian, the Chilean Participation Group, the French Participation Group, Instituto de Astrofísica de Canarias, The Johns Hopkins University, Kavli Institute for the Physics and Mathematics of the Universe (IPMU)/University of Tokyo, the Korean Participation Group, Lawrence Berkeley National Laboratory, Leibniz Institut für Astrophysik Potsdam (AIP), Max-Planck-Institut für Astronomie (MPIA Heidelberg), Max-Planck-Institut für Astrophysik (MPA Garching), Max-Planck-Institut für Extraterrestrische Physik (MPE), National Astronomical Observatories of China, New Mexico State University, New York University, University of Notre Dame, Observatário Nacional / MCTI, The Ohio State University, Pennsylvania State University, Shanghai Astronomical Observatory, United Kingdom Participation Group, Universidad Nacional Autónoma de México, University of Arizona, University of Colorado Boulder, University of Oxford, University of Portsmouth, University of Utah, University of Virginia, University of Washington, University of Wisconsin, Vanderbilt University, and Yale University. Data availability: All the data presented and used in this paper are publicly available. The SDSS data (DR17 release) are accessible through the online SQL search service on the web page at http://skyserver.sdss.org/dr17/SearchTools/sql. The XMM-Newton data are available in the XMM-Newton Survey Science Centre.
References
- Ananna, T. T., Salvato, M., LaMassa, S., et al. 2017, ApJ, 850, 66 [Google Scholar]
- Baldwin, J. A., Phillips, M. M., & Terlevich, R. 1981, PASP, 93, 5 [Google Scholar]
- Birchall, K. L., Watson, M. G., Aird, J., & Starling, R. L. C. 2022, MNRAS, 510, 4556 [NASA ADS] [CrossRef] [Google Scholar]
- Blanton, M. R., Bershady, M. A., Abolfathi, B., et al. 2017, AJ, 154, 28 [Google Scholar]
- Bolton, A. S., Schlegel, D. J., Aubourg, É., et al. 2012, AJ, 144, 144 [NASA ADS] [CrossRef] [Google Scholar]
- Brandt, W. N., & Hasinger, G. 2005, ARA&A, 43, 827 [NASA ADS] [CrossRef] [Google Scholar]
- Brescia, M., Cavuoti, S., & Longo, G. 2015, MNRAS, 450, 3893 [NASA ADS] [CrossRef] [Google Scholar]
- Chang, Y.-Y., van der Wel, A., da Cunha, E., & Rix, H.-W. 2015, APJS, 219, 8 [NASA ADS] [CrossRef] [Google Scholar]
- Costa, T., Sijacki, D., Trenti, M., & Haehnelt, M. G. 2014, MNRAS, 439, 2146 [NASA ADS] [CrossRef] [Google Scholar]
- Cresci, G., & Maiolino, R. 2018, Nat. Astron., 2, 179 [Google Scholar]
- Croton, D. J., Springel, V., White, S. D. M., et al. 2006, MNRAS, 365, 11 [Google Scholar]
- Elvis, M., Soltan, A., & Keel, W. C. 1984, ApJ, 283, 479 [NASA ADS] [CrossRef] [Google Scholar]
- Fitriana, I. K., & Murayama, T. 2022, PASJ, 74, 689 [NASA ADS] [CrossRef] [Google Scholar]
- Hopkins, P. F., Torrey, P., Faucher-Giguère, C.-A., Quataert, E., & Murray, N. 2016, MNRAS, 458, 816 [NASA ADS] [CrossRef] [Google Scholar]
- Ishibashi, W., & Fabian, A. C. 2012, MNRAS, 427, 2998 [NASA ADS] [CrossRef] [Google Scholar]
- Kauffmann, G., Heckman, T. M., Tremonti, C., et al. 2003, MNRAS, 346, 1055 [Google Scholar]
- Kewley, L. J., Groves, B., Kauffmann, G., & Heckman, T. 2006, MNRAS, 372, 961 [Google Scholar]
- LaMassa, S. M., Urry, C. M., Cappelluti, N., et al. 2013, MNRAS, 436, 3581 [CrossRef] [Google Scholar]
- LaMassa, S. M., Urry, C. M., Cappelluti, N., et al. 2016, ApJ, 817, 172 [NASA ADS] [CrossRef] [Google Scholar]
- Lehmer, B. D., Alexander, D. M., Bauer, F. E., et al. 2010, ApJ, 724, 559 [Google Scholar]
- Mulchaey, J. S., Koratkar, A., Ward, M. J., et al. 1994, ApJ, 436, 586 [NASA ADS] [CrossRef] [Google Scholar]
- Panessa, F., Bassani, L., Cappi, M., et al. 2006, A&A, 455, 173 [NASA ADS] [CrossRef] [EDP Sciences] [Google Scholar]
- Schartmann, M., Meisenheimer, K., Klahr, H., et al. 2009, MNRAS, 393, 759 [CrossRef] [Google Scholar]
- Shangguan, J., Ho, L. C., Bauer, F. E., Wang, R., & Treister, E. 2020, ApJ, 899, 112 [NASA ADS] [CrossRef] [Google Scholar]
- Stemo, A., Comerford, J. M., Barrows, R. S., et al. 2020, ApJ, 888, 78 [NASA ADS] [CrossRef] [Google Scholar]
- Strüder, L., Briel, U., Dennerl, K., et al. 2001, A&A, 365, L18 [Google Scholar]
- Torbaniuk, O., Paolillo, M., Carrera, F., et al. 2021, MNRAS, 506, 2619 [NASA ADS] [CrossRef] [Google Scholar]
- Tugay, A. V., & Vasylenko, A. A. 2011, Odessa Astron. Pub., 24, 72 [Google Scholar]
- Ward, M. J., Done, C., Fabian, A. C., Tennant, A. F., & Shafer, R. A. 1988, ApJ, 324, 767 [NASA ADS] [CrossRef] [Google Scholar]
- Webb, N. A., Coriat, M., Traulsen, I., et al. 2020, A&A, 641, A136 [NASA ADS] [CrossRef] [EDP Sciences] [Google Scholar]
- Zadorozhna, L. V., Tugay, A. V., Shevchenko, S. Y., & Pulatova, N. G. 2021, Kinematics Phys. Celestial Bodies, 37, 149 [NASA ADS] [CrossRef] [Google Scholar]
Appendix A: Rejected objects
We checked all 19 X-ray-selected SDSS galaxies below the LINER’s position on the BPT diagram. The empirical separation line between LINERs and ‘doubtful galaxies’ marked with the green line, [OIII]/Hβ < 0.64 + 1.18 ⋅ OI/Hα in Fig. A.1. We find that 12 of all 19 galaxies have no emission lines that we use to plot BPT diagrams (see Table A.1). The Hβ line was mostly falsely detected, and its flux was calculated automatically. Visually, this region appears to be a random fluctuation of noise. We removed these galaxies from the sample.
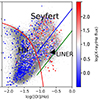 |
Fig. A.1. The position on OIII/Hβ vs OI/Hα BPT diagram of selected SDSS galaxies with X-ray nuclear emission. Empirical lines (dashed blue and solid red) that separate LINERs from Seyfert galaxies are from Kewley et al. (2006). The green empirical line ([OIII]/Hβ < 0.64 + 1.18 ⋅ OI/Hα) separates "true" LINERs from “doubtful” galaxies. |
Information about 19 individual SDSS galaxies with nuclear X-ray emission, located under LINER position on BPT diagram
The other four galaxies are classified automatically by SDSS (Brescia et al. 2015) as BROADLINE galaxies (with σline > 200 km/s). We removed these galaxies from the sample as the physical conditions that give rise to the broad lines are different from those that give rise to the narrow lines, and so comparing these types of objects is misleading.
Finally, the remaining three galaxies were classified as STARBURST or STARFORMING. The difference between the STARBURST and STARFORMING classifications of galaxies is worthy of note. A STARBURST galaxy is a STARFORMING galaxy with an equivalent width of Hα of greater than 50 Å. From these three STARBURST or STARFORMING galaxies (numbers 2, 10, 14 in Table A.1) we find that the last one, 14, has σline > 200 km/s for all-optical emission lines, except Hα, Hβ with σline ∼ 200 km/s ). According to this, we decided to remove galaxy 14 from Table A.1 as a BROADLINE galaxy. The last two STARFORMING galaxies (SDSS J015308.29+010150.6 and SDSS J130340.81+534323.6) are located at the bottom end of the LINER region and were not investigated further.
All Tables
Distribution of 1347 SDSS X-ray-selected galaxies and 204 895 SDSS galaxies (the last column), according to their position on the BPT diagram.
Information about 19 individual SDSS galaxies with nuclear X-ray emission, located under LINER position on BPT diagram
All Figures
|
Fig. 1. Distribution of the sample of 1347 X-ray-selected galaxies in equatorial coordinates. |
| In the text | |
|
Fig. 2. Distribution of 1347 SDSS X-ray galaxies in terms of the angular separation between the SDSS optical centre of the galaxy and the XMM-Newton X-ray source. |
| In the text | |
|
Fig. 3. Distribution of 1347 SDSS galaxies with X-ray nuclear emission in terms of redshift, z. |
| In the text | |
|
Fig. 4. Distribution of 1347 SDSS X-ray-selected galaxies in terms of hardness ratio, HR1-HR4, according to data from the XMM-Newton catalogue. |
| In the text | |
|
Fig. 5. Position of 1347 SDSS X-ray-selected galaxies on the [NII]/HαBPT diagram. The grey background circles show 204 895 SDSS-DR17 galaxies that satisfy the conditions for optical spectra σ log f ≤ 0.13 and σline < 200 km s−1. Empirical lines (dashed blue and solid red) that separate LINERs from Seyfert galaxies are from Kewley et al. (2006). The colour code represents the hardness ratios among the HR1, HR2, HR3, and HR4 bands. |
| In the text | |
|
Fig. 6. Distribution on the BPT diagram (Baldwin et al. 1981) of 1347 SDSS X-ray-selected galaxies. Empirical lines (dashed blue and solid red) that separate LINERs from Seyfert galaxies are from Kewley et al. (2006). The grey background circles show all the 204 895 SDSS-DR17 galaxies that satisfy our basic optical quality cuts: all line fluxes have fractional uncertainties of < 0.13 dex (33%) and are ‘narrow’ σline < 200 km s−1. The colour bar represents X-ray/Hα flux ratio (6a) and redshift z (6b) and corresponds only to 1347 SDSS X-ray-selected galaxies. |
| In the text | |
|
Fig. 7. Positions of 1347 SDSS X-ray selected galaxies on X-ray versus Hα luminosities plane. X-ray luminosity is in the range 0.2–12 keV and in erg s−1, Hα luminosity is in erg s−1. Type of ionisation (AGNs, Composite, SF) corresponds to the position of X-ray galaxy on [OIII]/Hβ versus [NII]/Hα BPT diagram. AGNs are marked with blue circles, Composites - with orange crosses, and SF – with green squares. |
| In the text | |
|
Fig. 8. Distribution on the log10[OIII] versus log10Hα plane of SDSS X-ray selected galaxies (left) and 204 895 SDSS galaxies (right). Type of ionisation (AGNs, Composite, SF) corresponds to the position of X-ray galaxy on [OIII]/Hβ versus [NII]/Hα BPT diagram. |
| In the text | |
|
Fig. 9. BPT diagram for 1262 SDSS X-ray selected galaxies. Empirical lines (dashed blue and solid red) that separate LINERs from Seyfert galaxies are from Kewley et al. (2006). The relation between X-ray luminosity from the stellar component and the total X-ray luminosity from the XMM-Newton observations is shown with colour coding. |
| In the text | |
|
Fig. 10. BPT diagram for 1262 SDSS X-ray-selected galaxies. The empirical lines (dashed blue and solid red) that separate LINERs from Seyfert galaxies are from Kewley et al. (2006). The mass of the stellar component (left) and the SFR (right) from Chang et al. (2015) are shown with colour coding in the respective panels. |
| In the text | |
|
Fig. 11. Probability density function of S/N for [NII] and [SII] doublets for 204 895 SDSS galaxy spectra. We choose the weakest line for S/N selection criteria; that is, [SII]. |
| In the text | |
|
Fig. 12. Distribution of SDSS X-ray-selected galaxies Left: galaxies with S/N > 30 on the [SII] version of the BPT diagram (Baldwin et al. 1981). Compared to Fig. 6, the contribution of composite-type galaxies increases. The colour bar represents the X-ray/Hα flux ratio. Right: PDF of log(X-ray/Hα) for S/N 3 and 10, respectively. |
| In the text | |
|
Fig. A.1. The position on OIII/Hβ vs OI/Hα BPT diagram of selected SDSS galaxies with X-ray nuclear emission. Empirical lines (dashed blue and solid red) that separate LINERs from Seyfert galaxies are from Kewley et al. (2006). The green empirical line ([OIII]/Hβ < 0.64 + 1.18 ⋅ OI/Hα) separates "true" LINERs from “doubtful” galaxies. |
| In the text | |
Current usage metrics show cumulative count of Article Views (full-text article views including HTML views, PDF and ePub downloads, according to the available data) and Abstracts Views on Vision4Press platform.
Data correspond to usage on the plateform after 2015. The current usage metrics is available 48-96 hours after online publication and is updated daily on week days.
Initial download of the metrics may take a while.