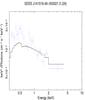
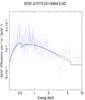
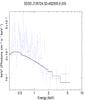
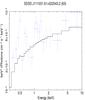
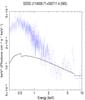
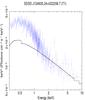
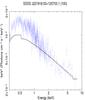
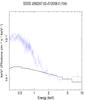
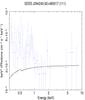
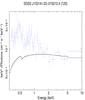
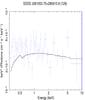
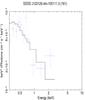
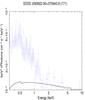
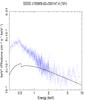
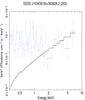
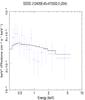
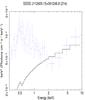
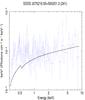
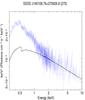
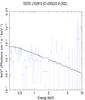
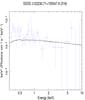
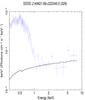
Fig. 8
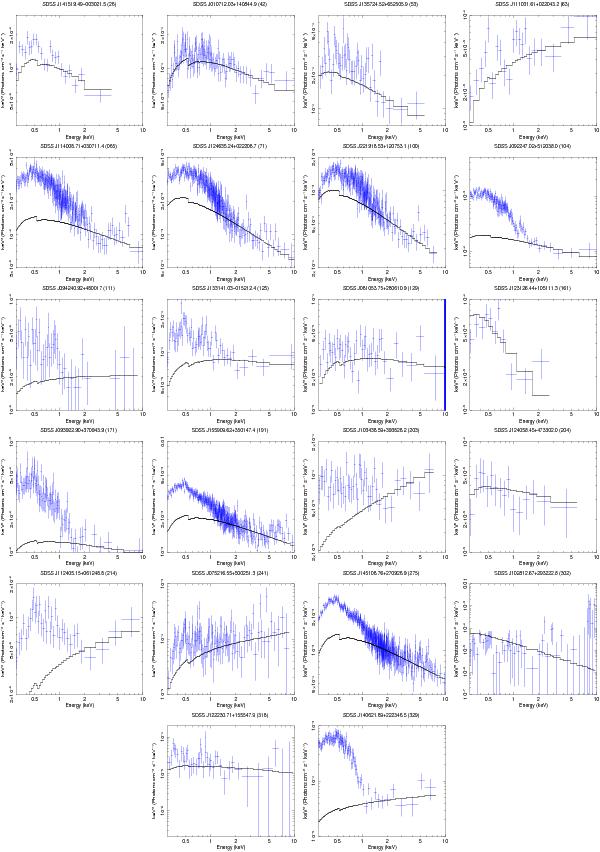
The X-ray spaltral fitting and optical data for each object within Missing AGN sample. Objects order on the figure follows the Table 2. X-ray band fitting plot (Odd panels): the individual hard (2 − 10 keV) X-ray data has been fitted with a power-law model modified by absorption and we have added the soft component defined as the excess over an extrapolation down up to 0.3 keV of the best power-law model fitting to the hard X-ray band only for those objects where It was made possible by the statistics. Even panels: SDSS spectrum plotted as (log Fλ) in units of 1017 erg/cm2/s/Å. Note that, for two sources (163 and 335) we have not X-ray spectrum due to the low counts in the X-ray energy band.
Current usage metrics show cumulative count of Article Views (full-text article views including HTML views, PDF and ePub downloads, according to the available data) and Abstracts Views on Vision4Press platform.
Data correspond to usage on the plateform after 2015. The current usage metrics is available 48-96 hours after online publication and is updated daily on week days.
Initial download of the metrics may take a while.