Fig. 1
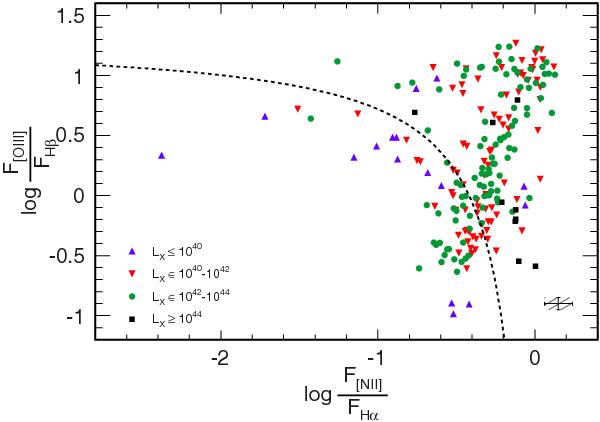
Emission line diagnostic diagram (BPT diagram) for the whole sample of NELGs. The curve separating the AGNs from the non-AGNs (bottom left) zone is taken from Kauffmann et al. (2003). Symbols change in both form and colour according to the hard X-ray luminosity, LX. To avoid confusion, only the mean errors are reported (bottom right). The estimated errors increase with decreasing log[NII]/Hα.
Current usage metrics show cumulative count of Article Views (full-text article views including HTML views, PDF and ePub downloads, according to the available data) and Abstracts Views on Vision4Press platform.
Data correspond to usage on the plateform after 2015. The current usage metrics is available 48-96 hours after online publication and is updated daily on week days.
Initial download of the metrics may take a while.