| Issue |
A&A
Volume 543, July 2012
|
|
|---|---|---|
| Article Number | A72 | |
| Number of page(s) | 9 | |
| Section | Extragalactic astronomy | |
| DOI | https://doi.org/10.1051/0004-6361/201218816 | |
| Published online | 29 June 2012 | |
e-MERLIN and VLBI observations of the luminous infrared galaxy IC 883: a nuclear starburst and an AGN candidate revealed
1 Instituto de Astrofísica de Andalucía – CSIC, PO Box 3004, 18008 Granada, Spain
e-mail: This email address is being protected from spambots. You need JavaScript enabled to view it.
2 Tuorla Observatory, Department of Physics and Astronomy, University of Turku, Väisäläntie 20, 21500 Piikkiö, Finland
3 Netherlands Institute for Radio Astronomy (ASTRON), Postbus 2, 7990 AA Dwingeloo, The Netherlands
4 Jodrell Bank Centre for Astrophysics, Alan Turing Building, School of Physics and Astronomy, The University of Manchester, Manchester M13 9PL, UK
5 Onsala Space Observatory, 439 92 Onsala, Sweden
6 School of Sciences, European University Cyprus, Diogenes Street, Engomi, 1516 Nicosia, Cyprus
7 Australian Astronomical Observatory, PO Box 296, Epping, 1710 NSW, Australia
8 South African Astronomical Observatory, PO Box 9, 7935 Observatory, South Africa
Received: 13 January 2012
Accepted: 10 May 2012
Abstract
Context. The high star formation rates of luminous infrared galaxies (LIRGs) make them ideal places for core-collapse supernova (CCSN) searches. Massive star formation can often be found in coexistence with an active galactic nucleus (AGN), contributing jointly to the energy source of LIRGs. At radio frequencies, where light is unaffected by dust extinction, it is possible to detect compact components within the innermost LIRG nuclear regions, such as SNe and SN remnants, as well as AGN buried deep in the LIRG nuclei.
Aims. Our study of the LIRG IC 883 aims at: (i) investigating the parsec-scale radio structure of the (circum-)nuclear regions of IC 883; (ii) detecting at radio frequencies the two recently reported circumnuclear SNe 2010cu and 2011hi, which were discovered by near-IR (NIR) adaptive optics observations of IC 883; and (iii) further investigating the nature of SN 2011hi at NIR wavelengths.
Methods. We used the electronic European very long baseline interferometry (VLBI) Network (e-EVN) at 5 GHz, and the electronic Multi-Element Remotely Linked Interferometer Network (e-MERLIN) at 6.9 GHz, to observe contemporaneously the LIRG IC 883 at high angular-resolution (from tens to hundreds of milliarcsec) and with high sensitivity (<70 μJy), complemented by archival VLBI data at 5 GHz and 8.4 GHz. We also used the Gemini North telescope to obtain late-time JHK photometry for SN 2011hi.
Results. The circumnuclear regions traced by e-MERLIN at 6.9 GHz have an extension of ~ 1 kpc, at a position angle of 130°, and show a striking double-sided structure, which very likely corresponds to a warped rotating ring, in agreement with previous studies. Our e-EVN observations at 5 GHz and complementary archival VLBI data at 5 GHz and 8.4 GHz, reveal various milliarcsec compact components in the nucleus of IC 883. A single compact source, an AGN candidate, dominates the emission at both nuclear and circumnuclear scales, as imaged with the e-EVN and e-MERLIN, respectively. The other milliarcsec components are strongly indicative of ongoing nuclear CCSN activity. Our e-EVN observations also provided upper limits to the radio luminosity of the two SNe in IC 883 recently discovered at NIR wavelengths. We refine the classification of SN 2011hi as a Type IIP SN according to our latest epoch of Gemini North observations acquired in 2012, in agreement with a low-luminosity radio SN nature. We estimate a CCSN rate lower limit of 1.1-0.6+1.3 yr-1 for the entire galaxy, based on three nuclear radio SNe and the circumnuclear SNe 2010cu and 2011hi.
Key words: galaxies: starburst / galaxies: individual: IC 883 / radio lines: stars / radiation mechanisms: non-thermal
© ESO, 2012
1. Introduction
The excess of radio continuum and infrared (IR) emission in luminous IR galaxies (LIRGs) is associated with the vigorous formation of massive stars (M ≳ 8 M⊙) and/or an active galactic nucleus (AGN) (see e.g., Sanders & Mirabel 1996). Core-collapse supernovae (CCSNe) serve as probes of the star formation rate (SFR) of massive stars, hence their detection in LIRGs is a pertinent task.
IC 883 is a LIRG with an IR luminosity (LIR = L [8 − 1000 μm] ) of about 4.7 × 10¹¹ L⊙ at a distance of 100 Mpc (1 mas ≈ 0.48 pc), according to Sanders et al. (2003). This LIRG is probably the result of the merger of two disc galaxies (Smith et al. 1995), as suggested by its associated tidal tails, a diffuse one approximately perpendicular to the region where gas and dust preferentially concentrate (i.e., the disc) as seen in optical and near-IR (NIR) studies (e.g., Smith et al. 1995; Scoville et al. 2000; Modica et al. 2012), and a narrow one along the disc itself (Keel 1985).
Observational parameters of the radio observations.
Taking LIR as a measure of the rate at which massive stars are formed, results in a corresponding CCSN rate, νSN, of ~1.3 yr-1 for IC 883 (assuming the empirical relation obtained by Mattila & Meikle 2001). The optical spectroscopic studies of Veilleux et al. (1995) led to the classification of the IC 883 nucleus as a low-ionisation narrow emission-line region. However, Yuan et al. (2010) reclassified this galaxy as a composite starburst-AGN, based on the revised optical diagnostic diagrams of Kewley et al. (2006). The multi-wavelength study of IC 883 by Modica et al. (2012) also provides evidence of its composite nature. It is consequently expected that an AGN contributes to the total LIR in IC 883, thus that the νSN should be lower than 1.3 yr-1. At radio frequencies, Smith et al. (1998) and Parra et al. (2010) have found evidence of compact AGN activity based on very long baseline interferometry (VLBI) studies of IC 883.
IC 883 is part of our program “An ALTAIR study of Supernovae in Luminous Infrared Galaxies”, using Gemini North with its laser guide star adaptive optics (AO) system (e.g., Kankare et al. 2008). During the four-year survey, our program has yielded the discovery of two CCSNe in IC 883 within a 12-month period: SN 2010cu (24 Feb. 2010, Ryder et al. 2010) and SN 2011hi (11 Feb. 2011, Kankare et al. 2011). Kankare et al. (2012) concluded that either a Type IIP or a IIn/L SN provided the best fits to the NIR light curves of SNe 2010cu and 2011hi.
In this paper, we report our radio observations towards the nuclear and circumnuclear regions of IC 883, as well as the most recent NIR epoch obtained with Gemini North on 31 January 2012, that was not included in Kankare et al. (2012). In Sect. 2, we give details of our radio and NIR observations, Sect. 3 contains our results and discussion, and Sect. 4 contains the summary of our study.
2. Observations
IC 883 was observed at radio frequencies with the electronic Multi-Element Remotely Linked Interferometer Network (e-MERLIN) and the electronic European VLBI Network (e-EVN1), and at NIR wavelengths with the Gemini North telescope. Our observations had been designed to image the parsec-scale radio structure of the (circum-)nuclear regions of IC 883, and detect SNe 2010cu and 2011hi at radio frequencies, as well as to investigate the nature of SN 2011hi at NIR wavelengths. To complement our radio observations, we also analysed publicly available archival VLBI data.
In Table 1, we provide some details of the observational parameters of the different radio observations included in our study: e-MERLIN, e-EVN, and additional Very Long Baseline Array (VLBA) and EVN observations.
2.1. e-MERLIN observations and data reduction
We carried out our e-MERLIN observations of IC 883 at 6.9 GHz (median central frequency) on 19 March 2011. These were director’s discretionary time (DDT) observations within the commissioning phase of e-MERLIN, which included the 25 m diameter antennas Mark II, Defford, Knockin, Darnhall, and Pickmere. The observations lasted ~24 h, of which approximately 20 were spent on target and 10 h were ultimately usable after editing. Four sub-bands (512 channels each) with dual polarisation were used, accounting for a total bandwidth of 512 MHz.
We analysed the data within the National Radio Astronomy Observatory (NRAO) Astronomical Image Processing System (aips). 3C286 set the absolute flux density scale following an iterative process. The flux estimated for 3C286 on the shortest baseline (Mark II-Pickmere), at the centre of the different sub-bands, was on average 5.56 Jy. We then calibrated the amplitude of DA 193, which is a bright and unresolved source as seen by all e-MERLIN baselines, resulting in an average flux density of 3.72 Jy. Finally, we used DA 193 to set the flux density of the phase reference source, J1324+3622, which resulted in an average flux density of 68.25 mJy. We performed a series of phase-only self-calibration iterations of the phase reference source, before phase-calibrating the target source. To account for the correlation offset from the position of the strongest source in the field, we used the task UVSUB in aips. To improve the sensitivity, we performed phase-only self-calibration iterations on the target source. We achieved a thermal root mean square (rms) noise in the IC 883 map of 44 μJy/beam, for a beam size of 165 × 88 mas at − 11.6° (see left panel in Fig. 1), which was obtained with natural weighting and ROBUST = 1 within aips.
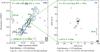 |
Fig. 1 IC 883 contour images at a median central frequency of 6.9 GHz obtained with e-MERLIN (left), and at 5 GHz with the e-EVN (right), in observations carried out in March 2011. The rms noise in the two images is 44 and 66 μJy/beam, respectively, and the convolving beam in each case is indicated in the upper left corner of the maps. Dashed contours represent − 3σ levels. Note that the brightest component on e-MERLIN scales is dominated by a compact source seen on mas scales with the e-EVN. The crosses in the left panel indicate the coordinates and positional errors of SNe 2010cu and 2011hi, according to the values reported in Kankare et al. (2012). |
2.2. e-EVN observations and data reduction
We observed IC 883 on 23 March 2011 (ToO project: RR006, P.I.: Romero-Cañizales) at 5 GHz, with the e-EVN, which included the following antennas (diameter, location): Effelsberg (100 m, Germany), Mark II (25 m, UK), Medicina (32 m, Italy), Onsala (25 m, Sweden), Torun (32 m, Poland), Westerbork array (14 × 25 m, NL) and Yebes (40 m, Spain).
RR006 was a two-hour experiment (~1.3 h, total time on source), recorded at 1024 Mbps using eight sub-bands, each of 16 MHz and dual polarisation. The data were correlated at the EVN MkIV data processor at JIVE with an averaging time of 2 s. The point-like source J1159+2914 (2.45 Jy at 5 GHz) was used as a fringe finder and bandpass calibrator. J1317 + 3425 (0.35 Jy at 5 GHz), at ~0.7° angular distance from IC 883, served as a phase reference source. We alternated 3.4 min scans of IC 883 with 1.2 min scans of J1317 + 3425. The data were analysed with aips. We also used the Caltech program DIFMAP (Shepherd et al. 1995) to image the calibrators and assess the performance of each antenna.
In an attempt to detect a radio counterpart to SN 2011hi, its coordinates derived from the NIR images were used for pointing and correlation. A local rms of ~30 μJy/beam was achieved at the pointing centre. Since no radio source was detected above 3σ at that position, we corrected the visibility data with the task UVSUB in aips, as we did for the e-MERLIN data, to account for the correlation offset from the position of the strongest source in the field, i.e., to the radio nucleus of IC 883. The shift of ~0.8 arcsec is well within the primary beam of each antenna in the used array.
For the imaging process within aips, we used different weighting schemes in order to test the reliability of our results. Owing to the scarce uv-coverage, the use of natural weighting tends to give rise to secondary side lobes at the 60 per cent level of the main lobe, which can produce artifacts in the reconstruction imaging process that can be confused with putative sources. Our final image was made using uniform weighting and ROBUST = 1. We achieved a final thermal rms in the map of 66.2 μJy/beam, for a beam size of 9.20 × 6.36 mas at − 76.1°(see Fig. 1, right panel).
2.3. Archival VLBI data
We analysed VLBA data from projects BN026 and BN027 at 5 GHz, and BC196 at 8.4 GHz. The VLBA observations under program BC196 were processed with the DiFX VLBI correlator (Deller et al. 2011). We also report EVN observations at 5 GHz made on 15 June 2006 (project: EP055, P.I.: R. Parra) see Table 1.
In project EP055, IC 883 was observed in four scans spread over 24 h to optimize the uv-coverage for a total observation time on source of ~1.3 h. The array used comprised 10 EVN stations: Lovell (76 m, UK), Cambridge (32 m, UK), Westerbork array (14 × 25 m, NL), Effelsberg (100 m, Germany), Medicina (32 m, Italy), Noto (32 m, Italy), Onsala (25 m, Sweden), Torun (32 m, Poland), Urumqi (25 m, China), and Shanghai (25 m, China). The observations were performed in a 1024 Mbps dual polarization mode. The data were correlated at JIVE in the Netherlands with an averaging time of 2 s.
All the additional VLBI data were edited and reduced using standard procedures within aips. The phase reference calibrator used in project BN027 is slightly resolved at VLBA scales, and we thus corrected the fringe solutions from its structure. We did not apply any self-calibration to obtain the final images of IC 883. In the case of project EP055, the data from the two Chinese antennas (Ur and Sh) as well as from Cm could not be properly calibrated, so we omitted these antennas in the imaging process.
As in the case of our e-EVN epoch, we tested the reliability of the sources in the different VLBI maps, by using different weighting schemes. We used the aips task UVSUB to apply shifts in α and δ to the visibility data on all the additional archival VLBI epochs. This allowed us to have all the maps centred at the same position (α(J2000) = 13h20m35 3184,
3184,  ). Since the resulting images have a different convolving beam and were thus mapped with different pixel sizes, we changed their geometry to match that of our e-EVN epoch (pixel size of 0.5 mas), using the task OHGEO within aips.
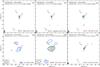 |
Fig. 2 IC 883 contour maps of the VLBI observations listed in Table 1. All the maps are centred on α(J2000) = 13h20m35 |
2.4. Gemini North observations
Our Gemini North observations of IC 883 were conducted with the ALTAIR Laser Guide Star AO system on the Near-InfraRed Imager (NIRI). The LIRG was observed in 11 separate epochs between 2008 April 15.5 UT and 2012 January 31.6 UT, covering a period of 3.8 yr. Here we report the results from the most recent epoch of JHK imaging obtained in 2012 under program GN-2012A-Q-56 (P.I.: S. Ryder); the previous epochs are reported in Kankare et al. (2012). For details of the data reduction, calibration, image subtraction process, and photometry of the ALTAIR/NIRI data on SN 2010cu and SN 2011hi, we refer to Kankare et al. (2012).
Image subtraction based on the ISIS 2.2 (Alard & Lupton 1998; Alard 2000) package was used to compare the 2012 JHK images of IC 883 to the reference data obtained on 2010 May 4-5 UT. This revealed SN 2011hi to have faded below the detection limit of the Gemini images. As in our derivation of the J-band upper limit for SN 2010cu in Kankare et al. (2012), we used the QUBA package (see Valenti et al. 2011) running standard iraf tasks, to measure the faintest detectable sources in the 2010 reference image with poorer quality AO correction compared to the latest 2012 epoch. Taking into account that the noise increases by a factor of  owing to the image subtraction process, conservative 5σ upper limits of roughly mJ > 19.7 mag, mH > 19.9 mag, and mK > 19.9 mag were derived.
3. Results and discussion
The images of the nuclear and circumnuclear regions of IC 883 observed with the e-EVN and e-MERLIN are shown in Fig. 1. In Fig. 2, we show the images resulting from a total of six VLBI epochs, covering a period of seven years. In Table 2 we report the estimated parameters for the > 5σ sources detected in all the images.
Our new Gemini North epoch has yielded new JHK magnitude limits for SN 2011hi. In Fig. 3 we show the SN 2011hi template light curve fits from Kankare et al. (2012), including the new limits obtained from our 2012 observations for comparison.
We note that the discovery of two SNe (2010cu and 2011hi) in a 3.8 yr period results in a  yr-1 (using the upper and lower Poisson 1σ uncertainties for two events given by Gehrels 1986), which agrees within the uncertainties with the IR luminosity-based CCSN rate of the galaxy. However, this estimate does not include any correction factors nor control time considerations, and should thus be regarded as a lower limit.
Estimated parameters of the detected radio-emitting sources in the (circum-)nuclear regions of IC 883.
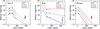 |
Fig. 3 Template light-curve fits for SN 2011hi presented in Kankare et al. (2012) adopting the Calzetti et al. (2000) extinction law, with the addition of the late-time JHK upper limits obtained for SN 2011hi in this work. The epochs not covered by the templates are linearly extrapolated and marked with the dashed lines. |
3.1. The nature of SNe 2010cu and 2011hi
In Kankare et al. (2012), we investigated the nature of SNe 2010cu and 2011hi by means of five epochs of NIR photometric observations prior to 2012. After comparing the light curves of SN 2010cu and SN 2011hi to both the CCSN templates presented in Mattila & Meikle (2001) and the well sampled NIR light curves of the canonical Type IIP SN 1999em (Krisciunas et al. 2009), it was concluded that the best fit for both SNe was either a Type IIP or a IIn/L SN (see Kankare et al. 2012). The ordinary, linearly declining template fit was previously excluded because this fit corresponds to an extremely early discovery and an unrealistically long rise time to the light curve peak. A NIR-bright Type IIn/L SN with ~0 mag of extinction was proposed by Kankare et al. (2012) as the type of SN 2011hi due to the low (<2 mag) total line-of-sight extinction implied by the J − K colour map of the galaxy. However, a Type IIP light curve with higher extinction could also provide a good fit to the data, and as noted in Kankare et al. (2012), higher localized extinctions are possible, as the colour map is tracing only the large scale structures of the LIRG.
In Fig. 3 we present the template χ2 fits of the SN 2011hi light curves adopting the Calzetti et al. (2000) reddening law and including the new upper limits. However, these limits are not included in the fit, i.e., the values reported in the Table 2 of Kankare et al. (2012) are unchanged. Based on the new data, the slowly declining (NIR-bright Type IIn/L) SN template is now excluded due to the fading of the SN. In addition to the SN 1999em template, we have now also compared the NIR light curve of SN 2011hi with that of other Type IIP SNe: 2003hn (Krisciunas et al. 2009) and 2004et (Maguire et al. 2010). The results of the best fits are similar to those obtained with SN 1999em, but have larger χ2 values. The V-band extinctions inferred for the three different Type IIP SNe used for comparison are consistent within 0.5 mag for the adopted extinction law. We conclude that SN 2011hi was a slightly over-luminous (1–2 mag brighter than SN 1999em) Type IIP SN discovered roughly a month after its SN explosion, with 5 or 7 mag of host galaxy extinction in the V-band when adopting either the Cardelli et al. (1989) or the Calzetti et al. (2000) reddening law, respectively.
We note that no radio sources were detected with the e-EVN with confidences higher than 3σ at/around the reported positions for either SN 2010cu, or SN 2011hi. Therefore, the 3σ upper limits at 5 GHz correspond to 2.4 × 1027 erg s-1 Hz-1 for both SNe. The SNe were also not detected in the archival 8.4 GHz VLBA observations (project BC196) carried out two months after our e-EVN observations. Source B2a detected with e-MERLIN at 6.9 GHz is positionally consistent within the uncertainties with SN 2010cu. However, since B2a is not a compact source, we discard the possibility of it being a SN.
SN 2010cu, had an estimated age of 14–17 months at the time of the radio observations made in 2011. Its non-detection at 5, 6.9, and 8.4 GHz is an indication that: (i) its radio emission at these frequencies has entered the optically thin decline phase of its evolution (e.g., a Type Ib/c SN), with a luminosity well below 2.4 × 1027 erg s-1 Hz-1; and/or (ii) SN 2010cu is an intrinsically low-luminosity Type II radio supernova (e.g., a Type IIP such as SN 1999em) and thus more sensitive observations would be required for its detection.
SN 2011hi was also undetected in our radio observations made 2–5 months after its explosion, which is consistent with Type IIP SNe being low-luminosity radio emitters. Other well-known type IIP SNe such as SNe 1999em, 2004dj, and 2004et (Pooley et al. 2002; Beswick et al. 2005; Martí-Vidal et al. 2007, respectively) have peak radio luminosities below 1026 erg s-1 Hz-1 (see e.g., Fig. 2 in Chevalier et al. 2006). At NIR wavelengths, SN 2011hi was only slightly brighter than SN 1999em. If its radio emission were likewise only slightly stronger, we would expect its radio luminosity to be well below the 3σ detection threshold (2.4 × 1027 erg s-1 Hz-1) of our most sensitive radio observations carried out with the e-EVN. We note that the non-detection of SNe 2010cu and 2011hi at radio wavelengths does not imply that no radio emission has been produced by these NIR-detected SNe.
To gain a clearer understanding of SNe in LIRGs, it is desirable to perform a radio monitoring of the NIR-detected SNe by including observations at different frequencies over many epochs. This strategy would help us to detect either a rapidly or slowly evolving SN, which would also help to constrain the SN type (Stockdale et al. 2007). However, not all CCSNe will be bright radio emitters. This depends on the interaction between the SN ejecta and the circumstellar medium, which gives rise to the synchrotron emission at radio frequencies (see e.g., Chevalier 1982).
3.2. The circumnuclear regions of IC 883: a jet or a disc?
The quest to detect radio emission from SNe 2010cu and 2011hi has enabled us to unveil the different facets of IC 883. In the following, we discuss the circumnuclear structure of IC 883 and the nature of its nuclear regions.
Our e-MERLIN observations reveal a double-sided structure with an approximate projected extent of 2 arcsec (~1 kpc) by 0.3 arcsec ( ≈ 150 pc), at a position angle of 130° (Fig. 1). This inclination matches that previously found in other radio studies (e.g., Condon et al. 1991; Parra et al. 2010). However, the double-sided structure in IC 883 is revealed for the first time at 6.9 GHz with our e-MERLIN observations (see also the 1.4 GHz MERLIN map from Clemens & Alexander 2004). VLA observations (e.g., from Condon et al. 1991; Parra et al. 2010) are of insufficient spatial resolution to image the circumnuclear regions with a similar level of detail. By convolving our e-MERLIN image with a beam of size 0 4, which corresponds to VLA A-configuration observations at 5 GHz, we were able to recover a structure similar to that shown in Fig. 2 of Parra et al. (2010).
At first glance, the structure seen with e-MERLIN resembles that of a two-sided jet of an AGN, whose restarting activity explains the presence of two sets of condensations (B1a-B1b and B2a-B2b; see left panel in Fig. 1), at either side of the core A. The higher flux density of the approaching components in the jet, which are B1a and B2a in this case, with respect to the flux density of the receding components, B1b and B2b, could be explained in terms of Doppler boosting effects.
There are however strong arguments against a jet interpretation: (i) the approaching components are at shorter distances from the core than the receding components, thus implying that their apparent velocities are smaller; (ii) the putative jet structure is placed on top of the disc of the galaxy, which is difficult to explain, unless we consider that the directions of jet and disc coincide owing to a projection effect.
Different studies of the molecular and atomic gas towards IC 883 (Downes & Solomon 1998; Bryant & Scoville 1999; Clemens & Alexander 2004) provide evidence of the rotation of the disc from south-east towards north-west. This situation would imply that the putative jet is perpendicular to the rotation axis, and hence that no projection effect could explain the superposition of the jet on the disc. Schmitt et al. (2002) studied the orientation of jets with respect to the rotation axis in a sample of radio galaxies and found that large misalignments (<77°) may occur because of warping mechanisms acting in the black hole’s accretion disc. In the case of IC 883, the misalignment would be close to 90°, so a jet scenario for the structure revealed with e-MERLIN is even less viable.
If we consider instead a rotating disc (or ring) scenario, component A would be at the centre, while B1a and B2a (approaching components) and B1b and B2b (receding components) would be continuum radio components of the disc itself. We note that the line joining component B1a with B1b through A, is not the same as the line joining B2a with B2b, which provides evidence of the disc/ring being warped (in agreement with previous studies, e.g., Clemens & Alexander 2004), probably due to the interaction with the ambient material. We note that the structure unveiled by e-MERLIN has a width of approximately 150 pc. Whilst this width might appear to be too narrow for representing a disc, thin discs of a few hundreds of parsecs are not uncommon for edge-on galaxies at radio frequencies (Dumke et al. 1995). Furthermore, e-MERLIN resolves out some of the extended emission that is otherwise visible at lower resolution, for instance with the VLA (Condon et al. 1991; Parra et al. 2010), and hence, the size of the structure mapped with e-MERLIN is compatible with a disc/ring structure.
Thus, whilst we cannot completely rule out that the structure mapped by e-MERLIN is a jet, there is strong evidence both against this, and it may instead be a rotating disc/ring.
Further e-MERLIN observations at different frequencies could be used to probe the radio lifetime of the condensations on either side of the core A. Observations optimized for polarimetry studies would yield information on the configuration of the large-scale magnetic field, which could probe the existence of shocked material as expected in a jet scenario, hence helping us to arrive to a firm conclusion.
3.3. The ongoing nuclear activity in IC 883
Our e-EVN observations (see right panel in Fig. 1), performed simultaneously with our e-MERLIN observations, reveal at least two compact sources (labelled A1 and A2) above 5σ in the innermost nuclear regions of IC 883. The high brightness temperatures of sources A1 and A2 are both indicative of a non-thermal origin.
The brightest component in our e-MERLIN image (A) has a peak intensity similar to that of A1. By adding up the flux densities of components A1 and A2 in our e-EVN map, we recover a flux density of 4.38 ± 0.27 mJy, which is still lower than both the peak intensity and the flux density of component A (see Table 2). We find that A1 provides a strong contribution to the flux density on larger scales (although seen at slightly different frequencies), and furthermore, has a position highly coincident with component A, despite the use of different phase reference sources and different spatial resolutions. Hence, A1 is very likely the main source producing the radio emission of component A.
From our e-EVN observations alone, we can neither characterise the natures of sources A1 and A2, nor investigate a possible relation between components A1 and A. We therefore searched for additional, publicly available, archival VLBI data (see Table 1) that could be of use to investigate these issues.
Component A1 from our e-EVN observations is detected in all the additional VLBI observations (see Fig. 2) and appears to fluctuate in terms of flux density at 5 GHz, varying by at least a factor of three between the minimum and maximum values displayed within the seven years spanning the different VLBI epochs (see Table 2). Component A2 is only detected in experiment RR006. At 8.4 GHz (experiment BC196), we detect a 5σ source (A3) north-west of component A1. The resolution of our e-EVN observations (RR006) does not allow us to detect component A3, but the source is also undetected in the VLBA epochs at 5 GHz, whose data have a resolution similar to that of experiment BC196. A 3σ component located north-east of component A1, is detected as a 5σ source in experiment EP055 and labelled A4. This source has no counterpart at 8.4 GHz in the observations of project BC196, indicating that at that frequency the emission from A4 has become optically thin, as expected in a SN scenario. We thus have a total of three transient sources (A2, A3, and A4) in the nucleus of IC 883, in addition to the more luminous, variable, component A1, which has remained visible for at least seven years.
3.4. The nature of the compact sources in the IC 883 nucleus
The milliarcsec sources detected in the innermost regions of IC 883 are evidence of its ongoing nuclear activity. A variable source, A1, was detected in six different VLBI epochs (see Table 2 and Fig. 2) over seven years, and appears to be the main powering source of the emission on the larger scales imaged with e-MERLIN. Three transient sources were also detected. All the sources have sizes and brightness temperatures that correspond to a non-thermal origin. The transient sources are most probably SNe and/or SN remnants (SNR), whereas for component A1 the nature is less clear. To investigate the nature of sources A1–A4, we compare their luminosities with those reported in the literature for the non-thermal sources (SNe and SNRs) at 5 GHz in the starburst galaxy M 82, the LIRG Arp 299-A, and in the ULIRG Arp 220 (Fig. 4).
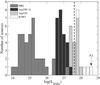 |
Fig. 4 Luminosity distribution at 5 GHz of SNe and SNRs in M 82, Arp 299-A, and Arp 220. All the IC 883 nuclear sources have been added for comparison purposes. Each bin has a width of log10(L5 GHz) = 0.2 with L5 GHz in units of erg s-1 Hz-1. The SN and SNR luminosities have been retrieved from Fenech et al. (2008) and Marchili et al. (2010) for M 82, from Bondi et al. (2012) for Arp 299-A, and from Batejat et al. (2011) for Arp 220. The most luminous M 82 source corresponds to SN 2008iz. In the case of Arp 220, we have included SNe and SNRs from both the west and east nuclei. The luminosities of the IC 883 components were taken from Table 2: from experiment RR006 for A1 and A2, from experiment BC196 for A3, and from experiment EP055 for A4. We have assumed a spectral index of − 0.7 to obtain the luminosity at 5 GHz of component A3. Note that A1 is the brightest source, and with our most sensitive VLBI image (RR006) we are only sensitive to sources above a 5σ luminosity limit of 4 × 1027 erg s-1 Hz-1, which is indicated by a dashed line in the histogram. |
From Fig. 4, we see that the nuclear components of IC 883, although less numerous, are in general more luminous than the components identified as SNe and SNRs in the nuclear regions of other galaxies with high star formation rates. The lifetime of the transient sources in IC 883 ranges from less than a few months up to a few years. It is thus very likely that these sources are a mixture of SNe and SNRs, which therefore implies that there has been a recent starburst activity in the nucleus of IC 883. We lack the spectral information that might have helped to differentiate between a SN or a SNR origin for each of these transient sources.
Component A1 is the most luminous of all the sources that we have studied (see histogram in Fig. 4). A SN or a SNR origin are not very likely, based on its flux density fluctuations (see Cols. 5 and 6 in Table 2), its longevity, and its relatively flat two-point spectral index between 5 and 8.4 GHz, α = 0.3 (Sν ~ να), calculated from the flux densities obtained in experiments RR006 and BC196. Therefore, A1 is very likely an AGN.
Further evidence of an obscured AGN in IC 883 can be inferred from the ratio of radio to hard X-ray luminosity (RX = νLν(5 GHz)/LHX; Terashima & Wilson 2003). Iwasawa et al. (2011) report a hard X-ray luminosity (LHX = L [2–10 keV] ) of 6.4 × 1040 erg s-1 for IC 883. Considering the luminosity at 5 GHz of A1 observed with the e-EVN (see Table 2), we calculate RX ≈ 3.6 × 10⁻³, which is consistent with a low-luminosity AGN (LLAGN) or a normal AGN in a radio galaxy, as inferred from Fig. 4 of Terashima & Wilson (2003).
By comparing the maximum variability (a factor of about three) displayed by A1 in our observations, with the largest inter-year variability displayed by typical LLAGNs (Nagar et al. 2002), we find that A1 would be placed at the high end of the LLAGN behaviour. Thus, we can only conclude that A1 is a candidate to be either a normal AGN or a low-luminosity one.
Component A4 whose elongation could be a sort of outflow, has however no counterpart at 8.4 GHz (experiment BC196). Future VLBI observations at different frequencies should allow an unequivocal characterisation of the AGN candidate in IC 883, as well as the possible discovery of additional nuclear components.
If we considered sources A2, A3, and A4 to have an origin in recent star formation activity, we would have three CCSN events that occurred in the period between June 2006 and May 2011, i.e., five years. We can thus estimate a CCSN rate for the IC 883 nuclear region of ≈  yr-1, using the upper and lower Poisson 1σ uncertainties for three events given by Gehrels (1986). Combining the nuclear CCSN rate with the CCSN rate inferred from the detection of SNe 2010cu and 2011hi within 3.8 yr in the circumnuclear regions of IC 883, we obtain a CCSN rate for the entire galaxy of ≈
  yr-1. These rates are considered as lower limits since our irregular temporal sampling at both radio and NIR wavelengths might have missed rapidly evolving SNe, and also because our 5σ radio luminosity detection threshold (4 × 1027 erg s-1 Hz-1) prevents us from detecting Type IIP and IIb SNe, and even some Type IIL. We note that the total rate estimate agrees with the IR luminosity-based CCSN rate estimate (see Sect. 1). It is thus of great interest to estimate the contribution of a putative AGN to the IR luminosity in order to obtain a more reliable estimate of the expected CCSN rate.
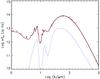 |
Fig. 5 The infrared SED of IC 883 including 2MASS and IRAS data, as well as the SCUBA point from Dunne et al. (2000). The red-dashed line is our starburst model fit, and the blue-dotted line is the model fit for an AGN upper limit contribution. The black-solid line is the model fit including both components. |
3.5. The infrared SED of IC 883: estimating the contribution of an AGN
As mentioned in Sect. 1, IC 883 was classified by Yuan et al. (2010) as a composite starburst-AGN, based on its optical diagnostic diagrams.
We modelled the spectral energy distribution (SED) of IC 883 (see Fig. 5) to estimate the contribution of an AGN to the total IR luminosity and provide an estimate of the CCSN rate in this galaxy. For this, we used a grid of AGN dusty torus models that were computed with the method of Efstathiou & Rowan-Robinson (1995) and a grid of starburst models that were computed with the method of Efstathiou et al. (2000), but with a revised dust model (Efstathiou & Siebenmorgen 2009). The spatial resolution of the mid- and far-IR data used for the modelling is not high enough to spatially separate the different components. Therefore, to distinguish the contribution of the AGN torus from the starburst we fitted a model combining both an AGN and a starburst.
For the AGN, we considered a grid of tapered disc models computed with the method of Efstathiou & Rowan-Robinson (1995). In this grid of models, we considered four discrete values for the equatorial 1000 Å optical depth (500, 750, 1000, 1250), three values for the ratio of outer to inner disc radii (20, 60, 100), and three values for the opening angle of the disc (30°, 45° and 60°). The best-fit model parameters corresponding to the minimum χ2 when we combine the starburst and the AGN torus models, are an opening angle of 60° for the torus, an equatorial optical depth of 1250 at 1000 Å, and a ratio of outer to inner radius of 60. The AGN torus is viewed close to edge-on owing to the IC 883 geometry; thus, its apparent contribution to the total infrared emission is insignificant (probably < 10 per cent of the starburst luminosity). Therefore, the starburst clearly dominates the observed luminosity of the entire galaxy. We note that owing to our almost edge-on view of the torus and its extremely high optical depth, the intrinsic luminosity of the AGN itself could be a factor of about 30 times higher than the observed one. This enhancing factor is related to the anisotropy of the torus emission (see Efstathiou 2006, for a definition), and implies that the intrinsic luminosity of the AGN could be about three times higher than the observed starburst luminosity.
Our model incorporates the stellar population synthesis model of Bruzual & Charlot (2003), which makes a prediction of the SN rate, νSN(t), at a time t after star formation in an instantaneous burst. The starburst model of Efstathiou et al. (2000) predicts the spectrum of this instantaneous burst at time t and assumes a star formation history for the starburst. We assumed that the SFR in IC 883 declines exponentially with an e-folding time of 20 Myr, and that the age of the starburst is 55 Myr. The initial optical depth of the molecular clouds that constitute the starburst is assumed to be 100. The SFR averaged over the duration of the starburst is 185 M⊙ yr-1. It is also possible to calculate self-consistently the SN rate at different stages of the starburst evolution by convolving the star formation history with νSN(t). This yields a νSN of 1.1 yr-1, which is relevant to the entire galaxy and can therefore be compared with the observed values. We combined the CCSN rate for the nuclear regions, which is based on three radio SNe detected in our VLBI observations, with the CCSN rate for the circumnuclear regions based on the discovery of SNe 2010cu and 2011hi, which resulted in a lower limit to the CCSN rate of ≈ yr-1 for the entire galaxy (see Sect. 3.4). This CCSN rate estimate is in good agreement with the predicted CCSN rate for the entire IC 883 galaxy from the IR SED modelling.
Although IC 883 is less luminous in the IR but farther away than Arp 299-A and in a much more advanced merger stage, it also contains both a starburst and an AGN. The nuclear starburst in IC 883 is apparently less prolific than in Arp 299-A (Pérez-Torres et al. 2009). However, the AGN in IC 883 seems to be stronger than the one in Arp 299-A (Pérez-Torres et al. 2010), and even powers the radio luminosity on circumnuclear scales, although its contribution to the emission of the entire galaxy at IR wavelengths is apparently insignificant.
4. Summary
We have imaged the nuclear and circumnuclear regions of the LIRG IC 883 at radio frequencies. Our e-EVN observations, together with archival VLBI observations, reveal the presence of at least four non-thermal components in the nuclear regions of IC 883. Three of these are transient sources and one is a long-lived, variable compact source, which is very likely an AGN. Our e-MERLIN observations show a striking double-sided structure, which likely represents a warped disc/ring, in agreement with previous studies on the interstellar medium of this galaxy.
The source we have identified as an AGN candidate powers the radio emission in IC 883 on nuclear and circumnuclear scales, and yet, as indicated by our radio and NIR observations, and our model of the IR SED, this LIRG displays very active star formation both within the innermost 100 pc of its nucleus, and the circumnuclear regions. We have estimated lower limits to the CCSN rate in the innermost nuclear regions of yr-1 based on the detection of three radio SNe above a 5σ luminosity threshold of 4 × 1027 erg s-1 Hz-1, and yr-1 for the entire galaxy, based on the nuclear radio SNe and the NIR SNe 2010cu and 2011hi discovered in the circumnuclear regions. Our most recent NIR Gemini North observations of IC 883 clarify the nature of SN 2011hi as a Type IIP SN, in agreement with its non-detection in our observations at radio frequencies.
The composite starburst-AGN nature of IC 883, revealed previously by optical spectroscopy (e.g., Yuan et al. 2010), is now supported by our radio observations for the first time, thus making IC 883 one of the few galaxies where the starburst-AGN connection can be studied in detail.
The development of e-VLBI within the EVN has been made possible via EXPReS project funded by the EC FP6 IST Integrated Infrastructure Initiative contract # 026642 – with a goal of achieving 1 Gbps e-VLBI real-time data transfer and correlation.
Acknowledgments
We thank the anonymous referee for his/her comments. The authors are thankful to the EVN directors for their rapid provision of target-of-opportunity observations. The European VLBI Network is a joint facility of European, Chinese, South African, and other radio astronomy institutes funded by their national research councils. We also made use of observations with e-MERLIN, the UK’s facility for high resolution radio astronomy observations, operated by The University of Manchester for the Science and Technology Facilities Council; and observations obtained at the Gemini Observatory, which is operated by the Association of Universities for Research in Astronomy, Inc., under a cooperative agreement with the NSF on behalf of the Gemini partnership: the National Science Foundation (US), the Science and Technology Facilities Council (UK), the National Research Council (Canada), CONICYT (Chile), the Australian Research Council (Australia), Ministério da Ciência e Tecnologia (Brazil), and Ministerio de Ciencia, Tecnología e Innovación Productiva (Argentina). This article is also based on observations made with the Very Long Baseline Array (VLBA) of the National Radio Astronomy Observatory (NRAO); the NRAO is a facility of the National Science Foundation operated under cooperative agreement by Associated Universities, Inc. This work made use of the Swinburne University of Technology software correlator, developed as part of the Australian Major National Research Facilities Programme and operated under licence. Our work is supported by the European Community Framework Programme 7, Advanced Radio Astronomy in Europe, grant agreement No. 227290. C.R.-C., M.A.P.-T. and A.A. acknowledge financial support from the Spanish MICINN through grant AYA2009-13036-C02-01, co-funded with FEDER funds. S.M., E.K. and C.R.-C. acknowledge financial support from the Academy of Finland (project: 8120503). E.K. acknowledges support from the Finnish Academy of Science and Letters (Vilho, Yrjö and Kalle Väisälä Foundation).
References
- Alard, C. 2000, A&AS, 144, 363 [NASA ADS] [CrossRef] [EDP Sciences] [Google Scholar]
- Alard, C., & Lupton, R. H. 1998, ApJ, 503, 325 [NASA ADS] [CrossRef] [Google Scholar]
- Batejat, F., Conway, J. E., Hurley, R., et al. 2011, ApJ, 740, 95 [NASA ADS] [CrossRef] [Google Scholar]
- Beswick, R. J., Muxlow, T. W. B., Argo, M. K., et al. 2005, ApJ, 623, L21 [NASA ADS] [CrossRef] [Google Scholar]
- Bondi, M., Pérez-Torres, M. A., Herrero-Illana, R., & Alberdi, A. 2012, A&A, 539, A134 [NASA ADS] [CrossRef] [EDP Sciences] [Google Scholar]
- Bruzual, G., & Charlot, S. 2003, MNRAS, 344, 1000 [NASA ADS] [CrossRef] [Google Scholar]
- Bryant, P. M., & Scoville, N. Z. 1999, AJ, 117, 2632 [NASA ADS] [CrossRef] [Google Scholar]
- Calzetti, D., Armus, L., Bohlin, R. C., et al. 2000, ApJ, 533, 682 [NASA ADS] [CrossRef] [Google Scholar]
- Cardelli, J. A., Clayton, G. C., & Mathis, J. S. 1989, ApJ, 345, 245 [NASA ADS] [CrossRef] [Google Scholar]
- Chevalier, R. A. 1982, ApJ, 259, 302 [NASA ADS] [CrossRef] [Google Scholar]
- Chevalier, R. A., Fransson, C., & Nymark, T. K. 2006, ApJ, 641, 1029 [NASA ADS] [CrossRef] [Google Scholar]
- Clemens, M. S., & Alexander, P. 2004, MNRAS, 350, 66 [NASA ADS] [CrossRef] [Google Scholar]
- Condon, J. J., Huang, Z.-P., Yin, Q. F., & Thuan, T. X. 1991, ApJ, 378, 65 [NASA ADS] [CrossRef] [Google Scholar]
- Deller, A. T., Brisken, W. F., Phillips, C. J., et al. 2011, PASP, 123, 275 [NASA ADS] [CrossRef] [Google Scholar]
- Downes, D., & Solomon, P. M. 1998, ApJ, 507, 615 [NASA ADS] [CrossRef] [Google Scholar]
- Dumke, M., Krause, M., Wielebinski, R., & Klein, U. 1995, A&A, 302, 691 [NASA ADS] [Google Scholar]
- Dunne, L., Eales, S., Edmunds, M., et al. 2000, MNRAS, 315, 115 [NASA ADS] [CrossRef] [Google Scholar]
- Efstathiou, A. 2006, MNRAS, 371, L70 [NASA ADS] [Google Scholar]
- Efstathiou, A., & Rowan-Robinson, M. 1995, MNRAS, 273, 649 [NASA ADS] [CrossRef] [Google Scholar]
- Efstathiou, A., & Siebenmorgen, R. 2009, A&A, 502, 541 [NASA ADS] [CrossRef] [EDP Sciences] [Google Scholar]
- Efstathiou, A., Rowan-Robinson, M., & Siebenmorgen, R. 2000, MNRAS, 313, 734 [NASA ADS] [CrossRef] [Google Scholar]
- Fenech, D. M., Muxlow, T. W. B., Beswick, R. J., Pedlar, A., & Argo, M. K. 2008, MNRAS, 391, 1384 [NASA ADS] [CrossRef] [Google Scholar]
- Gehrels, N. 1986, ApJ, 303, 336 [NASA ADS] [CrossRef] [Google Scholar]
- Iwasawa, K., Sanders, D. B., Teng, S. H., et al. 2011, A&A, 529, A106 [NASA ADS] [CrossRef] [EDP Sciences] [Google Scholar]
- Kankare, E., Mattila, S., Ryder, S., et al. 2008, ApJ, 689, L97 [NASA ADS] [CrossRef] [Google Scholar]
- Kankare, E., Ryder, S. D., Mattila, S., et al. 2011, Central Bureau Electronic Telegrams, 2889, 1 [NASA ADS] [Google Scholar]
- Kankare, E., Mattila, S., Ryder, S., et al. 2012, ApJ, 744, L19 [NASA ADS] [CrossRef] [Google Scholar]
- Keel, W. C. 1985, AJ, 90, 2207 [NASA ADS] [CrossRef] [Google Scholar]
- Kewley, L. J., Groves, B., Kauffmann, G., & Heckman, T. 2006, MNRAS, 372, 961 [NASA ADS] [CrossRef] [Google Scholar]
- Krisciunas, K., Hamuy, M., Suntzeff, N. B., et al. 2009, AJ, 137, 34 [NASA ADS] [CrossRef] [Google Scholar]
- Maguire, K., Di Carlo, E., Smartt, S. J., et al. 2010, MNRAS, 404, 981 [NASA ADS] [CrossRef] [Google Scholar]
- Marchili, N., Martí-Vidal, I., Brunthaler, A., et al. 2010, A&A, 509, A47 [NASA ADS] [CrossRef] [EDP Sciences] [Google Scholar]
- Martí-Vidal, I., Marcaide, J. M., Alberdi, A., et al. 2007, A&A, 470, 1071 [NASA ADS] [CrossRef] [EDP Sciences] [Google Scholar]
- Mattila, S., & Meikle, W. P. S. 2001, MNRAS, 324, 325 [NASA ADS] [CrossRef] [Google Scholar]
- Modica, F., Vavilkin, T., Evans, A. S., et al. 2012, AJ, 143, 16 [NASA ADS] [CrossRef] [Google Scholar]
- Nagar, N. M., Falcke, H., Wilson, A. S., & Ulvestad, J. S. 2002, A&A, 392, 53 [NASA ADS] [CrossRef] [EDP Sciences] [Google Scholar]
- Parra, R., Conway, J. E., Aalto, S., et al. 2010, ApJ, 720, 555 [NASA ADS] [CrossRef] [Google Scholar]
- Pérez-Torres, M. A., Romero-Cañizales, C., Alberdi, A., & Polatidis, A. 2009, A&A, 507, L17 [NASA ADS] [CrossRef] [EDP Sciences] [Google Scholar]
- Pérez-Torres, M. A., Alberdi, A., Romero-Cañizales, C., & Bondi, M. 2010, A&A, 519, L5 [NASA ADS] [CrossRef] [EDP Sciences] [Google Scholar]
- Pooley, D., Lewin, W. H. G., Fox, D. W., et al. 2002, ApJ, 572, 932 [NASA ADS] [CrossRef] [Google Scholar]
- Ryder, S., Kankare, E., & Mattila, S. 2010, Central Bureau Electronic Telegrams, 2286, 1 [NASA ADS] [Google Scholar]
- Sanders, D. B., & Mirabel, I. F. 1996, ARA&A, 34, 749 [NASA ADS] [CrossRef] [Google Scholar]
- Sanders, D. B., Mazzarella, J. M., Kim, D., Surace, J. A., & Soifer, B. T. 2003, AJ, 126, 1607 [Google Scholar]
- Schmitt, H. R., Pringle, J. E., Clarke, C. J., & Kinney, A. L. 2002, ApJ, 575, 150 [NASA ADS] [CrossRef] [Google Scholar]
- Scoville, N. Z., Evans, A. S., Thompson, R., et al. 2000, AJ, 119, 991 [NASA ADS] [CrossRef] [Google Scholar]
- Shepherd, M. C., Pearson, T. J., & Taylor, G. B. 1995, in BAAS 27, ed. B. J. Butler, & D. O. Muhleman, 903 [Google Scholar]
- Smith, D. A., Herter, T., Haynes, M. P., Beichman, C. A., & Gautier III, T. N. 1995, ApJ, 439, 623 [NASA ADS] [CrossRef] [Google Scholar]
- Smith, H. E., Lonsdale, C. J., & Lonsdale, C. J. 1998, ApJ, 492, 137 [NASA ADS] [CrossRef] [Google Scholar]
- Stockdale, C. J., Kelley, M. T., Weiler, K. W., et al. 2007, in Supernova 1987A: 20 Years After: Supernovae and Gamma-Ray Bursters, ed. S. Immler, K. Weiler, & R. McCray, AIP Conf. Ser., 937, 264 [Google Scholar]
- Terashima, Y., & Wilson, A. S. 2003, ApJ, 583, 145 [NASA ADS] [CrossRef] [Google Scholar]
- Valenti, S., Fraser, M., Benetti, S., et al. 2011, MNRAS, 416, 3138 [NASA ADS] [CrossRef] [Google Scholar]
- Veilleux, S., Kim, D.-C., Sanders, D. B., Mazzarella, J. M., & Soifer, B. T. 1995, ApJS, 98, 171 [NASA ADS] [CrossRef] [Google Scholar]
- Yuan, T.-T., Kewley, L. J., & Sanders, D. B. 2010, ApJ, 709, 884 [NASA ADS] [CrossRef] [Google Scholar]
All Tables
Estimated parameters of the detected radio-emitting sources in the (circum-)nuclear regions of IC 883.
All Figures
|
Fig. 1 IC 883 contour images at a median central frequency of 6.9 GHz obtained with e-MERLIN (left), and at 5 GHz with the e-EVN (right), in observations carried out in March 2011. The rms noise in the two images is 44 and 66 μJy/beam, respectively, and the convolving beam in each case is indicated in the upper left corner of the maps. Dashed contours represent − 3σ levels. Note that the brightest component on e-MERLIN scales is dominated by a compact source seen on mas scales with the e-EVN. The crosses in the left panel indicate the coordinates and positional errors of SNe 2010cu and 2011hi, according to the values reported in Kankare et al. (2012). |
| In the text | |
|
Fig. 2 IC 883 contour maps of the VLBI observations listed in Table 1. All the maps are centred on α(J2000) = 13h20m35 |
| In the text | |
|
Fig. 3 Template light-curve fits for SN 2011hi presented in Kankare et al. (2012) adopting the Calzetti et al. (2000) extinction law, with the addition of the late-time JHK upper limits obtained for SN 2011hi in this work. The epochs not covered by the templates are linearly extrapolated and marked with the dashed lines. |
| In the text | |
|
Fig. 4 Luminosity distribution at 5 GHz of SNe and SNRs in M 82, Arp 299-A, and Arp 220. All the IC 883 nuclear sources have been added for comparison purposes. Each bin has a width of log10(L5 GHz) = 0.2 with L5 GHz in units of erg s-1 Hz-1. The SN and SNR luminosities have been retrieved from Fenech et al. (2008) and Marchili et al. (2010) for M 82, from Bondi et al. (2012) for Arp 299-A, and from Batejat et al. (2011) for Arp 220. The most luminous M 82 source corresponds to SN 2008iz. In the case of Arp 220, we have included SNe and SNRs from both the west and east nuclei. The luminosities of the IC 883 components were taken from Table 2: from experiment RR006 for A1 and A2, from experiment BC196 for A3, and from experiment EP055 for A4. We have assumed a spectral index of − 0.7 to obtain the luminosity at 5 GHz of component A3. Note that A1 is the brightest source, and with our most sensitive VLBI image (RR006) we are only sensitive to sources above a 5σ luminosity limit of 4 × 1027 erg s-1 Hz-1, which is indicated by a dashed line in the histogram. |
| In the text | |
|
Fig. 5 The infrared SED of IC 883 including 2MASS and IRAS data, as well as the SCUBA point from Dunne et al. (2000). The red-dashed line is our starburst model fit, and the blue-dotted line is the model fit for an AGN upper limit contribution. The black-solid line is the model fit including both components. |
| In the text | |
Current usage metrics show cumulative count of Article Views (full-text article views including HTML views, PDF and ePub downloads, according to the available data) and Abstracts Views on Vision4Press platform.
Data correspond to usage on the plateform after 2015. The current usage metrics is available 48-96 hours after online publication and is updated daily on week days.
Initial download of the metrics may take a while.