Fig. 4
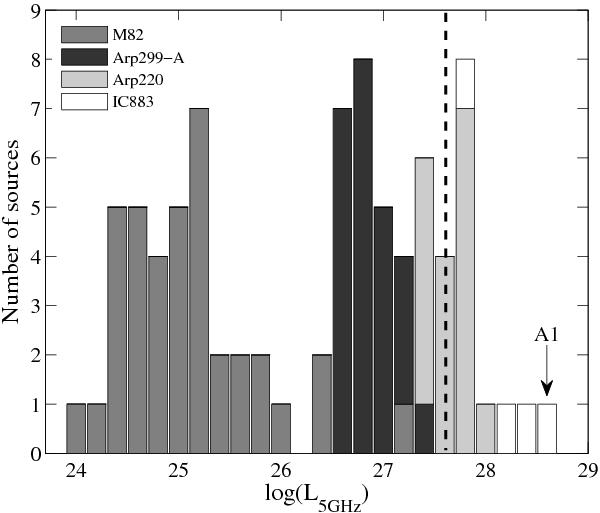
Luminosity distribution at 5 GHz of SNe and SNRs in M 82, Arp 299-A, and Arp 220. All the IC 883 nuclear sources have been added for comparison purposes. Each bin has a width of log10(L5 GHz) = 0.2 with L5 GHz in units of erg s-1 Hz-1. The SN and SNR luminosities have been retrieved from Fenech et al. (2008) and Marchili et al. (2010) for M 82, from Bondi et al. (2012) for Arp 299-A, and from Batejat et al. (2011) for Arp 220. The most luminous M 82 source corresponds to SN 2008iz. In the case of Arp 220, we have included SNe and SNRs from both the west and east nuclei. The luminosities of the IC 883 components were taken from Table 2: from experiment RR006 for A1 and A2, from experiment BC196 for A3, and from experiment EP055 for A4. We have assumed a spectral index of − 0.7 to obtain the luminosity at 5 GHz of component A3. Note that A1 is the brightest source, and with our most sensitive VLBI image (RR006) we are only sensitive to sources above a 5σ luminosity limit of 4 × 1027 erg s-1 Hz-1, which is indicated by a dashed line in the histogram.
Current usage metrics show cumulative count of Article Views (full-text article views including HTML views, PDF and ePub downloads, according to the available data) and Abstracts Views on Vision4Press platform.
Data correspond to usage on the plateform after 2015. The current usage metrics is available 48-96 hours after online publication and is updated daily on week days.
Initial download of the metrics may take a while.