Free Access
Fig. 2
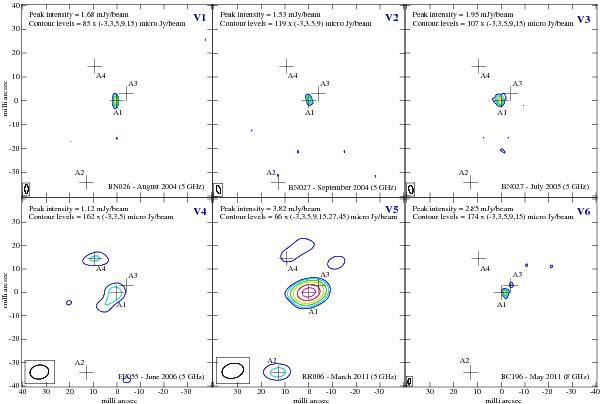
IC 883 contour maps of the VLBI observations listed in Table 1. All the maps are centred on α(J2000) = 13h20m35 3184,
3184,  . The crosses indicate the positions from the detection epoch of the different 5σ sources reported in Table 2: A1 and A2 from experiment V5; A3 from experiment V6; and A4 from experiment V4.
Current usage metrics show cumulative count of Article Views (full-text article views including HTML views, PDF and ePub downloads, according to the available data) and Abstracts Views on Vision4Press platform.
Data correspond to usage on the plateform after 2015. The current usage metrics is available 48-96 hours after online publication and is updated daily on week days.
Initial download of the metrics may take a while.