Free Access
Fig. 5
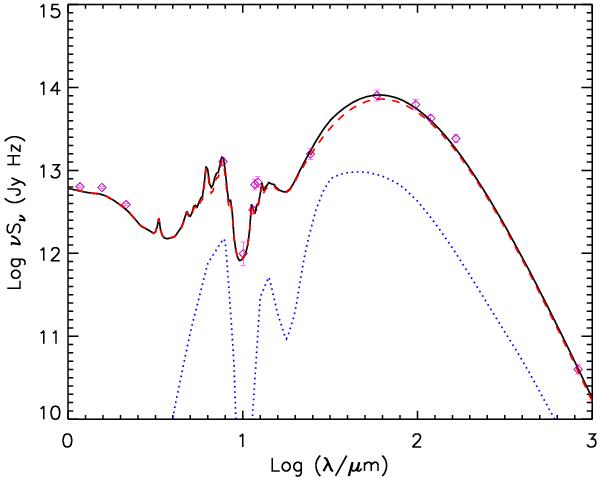
The infrared SED of IC 883 including 2MASS and IRAS data, as well as the SCUBA point from Dunne et al. (2000). The red-dashed line is our starburst model fit, and the blue-dotted line is the model fit for an AGN upper limit contribution. The black-solid line is the model fit including both components.
Current usage metrics show cumulative count of Article Views (full-text article views including HTML views, PDF and ePub downloads, according to the available data) and Abstracts Views on Vision4Press platform.
Data correspond to usage on the plateform after 2015. The current usage metrics is available 48-96 hours after online publication and is updated daily on week days.
Initial download of the metrics may take a while.