Fig. 1
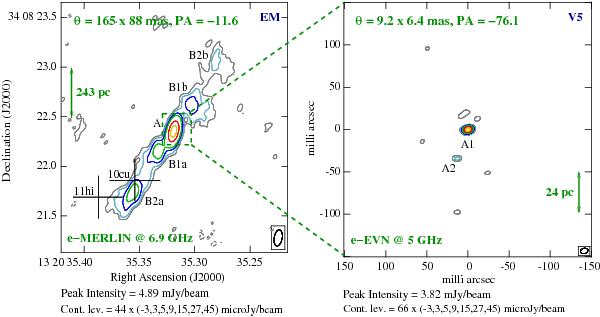
IC 883 contour images at a median central frequency of 6.9 GHz obtained with e-MERLIN (left), and at 5 GHz with the e-EVN (right), in observations carried out in March 2011. The rms noise in the two images is 44 and 66 μJy/beam, respectively, and the convolving beam in each case is indicated in the upper left corner of the maps. Dashed contours represent − 3σ levels. Note that the brightest component on e-MERLIN scales is dominated by a compact source seen on mas scales with the e-EVN. The crosses in the left panel indicate the coordinates and positional errors of SNe 2010cu and 2011hi, according to the values reported in Kankare et al. (2012).
Current usage metrics show cumulative count of Article Views (full-text article views including HTML views, PDF and ePub downloads, according to the available data) and Abstracts Views on Vision4Press platform.
Data correspond to usage on the plateform after 2015. The current usage metrics is available 48-96 hours after online publication and is updated daily on week days.
Initial download of the metrics may take a while.