| Issue |
A&A
Volume 540, April 2012
|
|
|---|---|---|
| Article Number | A118 | |
| Number of page(s) | 8 | |
| Section | Planets and planetary systems | |
| DOI | https://doi.org/10.1051/0004-6361/201118339 | |
| Published online | 09 April 2012 | |
Chaotic diffusion of the Vesta family induced by close encounters with massive asteroids
ASD, IMCCE-CNRS UMR8028, Observatoire de Paris, UPMC, 77 Av. Denfert-Rochereau, 75014 Paris, France
e-mail: This email address is being protected from spambots. You need JavaScript enabled to view it.
Received: 26 October 2011
Accepted: 1 March 2012
Abstract
We numerically estimate the semi-major axis chaotic diffusion of the Vesta family asteroids induced by close encounters with 11 massive main-belt asteroids: (1) Ceres, (2) Pallas, (3) Juno, (4) Vesta, (7) Iris, (10) Hygiea, (15) Eunomia, (19) Fortuna, (324) Bamberga, (532) Herculina, (704) Interamnia. We find that most of the diffusion is caused by Ceres and Vesta. By extrapolating our results, we are able to constrain the global effect of close encounters with all main-belt asteroids. A comparison of this drift estimate with the one expected for the Yarkovsky effect shows that for asteroids whose diameter is larger than about 40 km, close encounters dominate the Yarkovsky effect. Overall, our findings confirm the standard scenario for the history of the Vesta family.
Key words: celestial mechanics / minor planets, asteroids: general / chaos / methods: numerical
© ESO, 2012
1. Introduction
It is now common consent that most of the V-type near-Earth asteroids (NEAs) and howardite, eucrite, and diogenite (HED) meteorites are fragments of a collision between Vesta and another object that also produced the Vesta family (see Sears 1997). V-type NEAs and HED meteorites are former members of the Vesta family that have been carried from the main asteroid belt to Earth-crossing orbits by the two main resonances in the neighborhood of Vesta: the ν6 and 3:1 resonances with Jupiter. The major problem in this scenario is the fact that the average life time of fragments in these two resonances is too short to explain the mean age of HED meteorites and V-type NEAs (Migliorini et al. 1997).
The commonly accepted explanation for this is that NEAs spent most of their life time in the main asteroid belt before entering in resonance and being carried to their current orbits. This supposes that a mechanism can induce a diffusion process that brings fragments to one (or both) of the two main resonances. The Yarkovsky effect is now viewed as the main mechanism explaining the diffusion of Vesta family members (e.g. Carruba et al. 2003).
However, other processes also contribute to the diffusion. This is in particular the case for the chaos induced by overlaps of mean-motion resonances or close encounters between asteroids in the main belt. Morbidelli & Gladman (1998) showed for resonances that the chaotic zone around the 3:1 resonance is too narrow to explain the needed diffusion. Recently, Laskar et al. (2011) showed that close encounters among massive asteroids induce strong chaos that appears to be the main limiting factor for planetary ephemeris on tens of Myr. In the continuation of this work we concentrated our study on the diffusion induced by close encounters of Vesta family members with massive asteroids.
This effect has already been studied for different asteroid families (e.g. for the Flora and Lixiaohua families Nesvorný et al. 2002; Novaković et al. 2010). The most exhaustive study (in terms of the number of asteroids taken into account) concerned the Gefion and Adeona families and was conducted by Carruba et al. (2003). The authors considered all 682 asteroids of radius larger than 50 km for encounters with members of the families. They concluded that the four largest asteroids ((1) Ceres, (2) Pallas, (4) Vesta and (10) Hygiea) had a much stronger influence than all other 678 remaining asteroids; therefore these can be considered negligible. The Vesta family has also been the object of such an analysis (Carruba et al. 2007), but only close encounters with (4) Vesta were taken into account. These different studies show that the effect of close encounters with massive asteroids depends to a great extent on the considered family and its position in phase space with respect to those of massive asteroids.
The purpose of this work is to explore the effect of close encounters for the Vesta family in more detail by considering the effect of 11 large asteroids: (1) Ceres, (2) Pallas, (3) Juno, (4) Vesta, (7) Iris, (10) Hygiea, (15) Eunomia, (19) Fortuna, (324) Bamberga, (532) Herculina, and (704) Interamnia. Moreover, we use the results from these interactions to extrapolate and obtain an estimate of the effect that would be raised by the whole main asteroid belt. Finally, we compare the semi-major axis diffusion induced by the Yarkovsky effect and the diffusion caused by close encounters (for the Vesta family).
2. Numerical simulations
We ran two sets of numerical simulations. Both of them comprise the eight planets of the solar system, Pluto, the Moon and the 11 asteroids enumerated above. In both simulations, we generated a synthetic Vesta family produced by an initial collision of another object with Vesta. We did not model a realistic collision process but instead considered a set of test particles initially at the same position as Vesta, but with different relative velocities. This is not a problem because we are mainly interested here in exploring the phase space in the region of the Vesta family. The relative velocities of the collision fragments are sampled both in norm and direction. For the norm, we chose eight different values (every 50 m s-1) between the escape velocity at Vesta’s surface (around 350 m s-1) and twice this value (700 m s-1). The inclination was sampled between −50° and 50° every 10° (11 different values). Finally, the direction in the invariant plane was taken every 10° (36 values). This way we created 3168 test particles that represent the Vesta family. We plotted the positions of these particles in the (a,e) and (a,I) planes (where a is the semi-major axis, e the eccentricity and I the inclination) superimposed with the catalog published by Nesvorný (2010) of current Vesta family members (Fig. 1). Note that although we did not compute the proper elements, whereas the catalog uses them, the two sets of points superimpose quite well. Moreover, we constructed an initial set of particles just after the original collision, whereas the catalog exposes the remnants of the family after approximately 1.2 Gyr of evolution (Carruba et al. 2007).
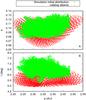 |
Fig. 1 Initial distribution of the synthetic Vesta family in the (a,e) plane (top) and the (a,I) plane (bottom). Real members proper elements (from Nesvorný 2010) are superimposed for comparison. |
In the first simulation (the reference simulation, S), the 11 asteroids were considered as test particles as well and therefore do not perturb the fragments of collision. In the second simulation (SE) the 11 asteroids were considered as the planets and accordingly interact with members of the synthetic Vesta family. Both solutions are integrated over 30 Myr using the symplectic integrator described in Laskar et al. (2011) and references therein. The effects of all planets and Pluto are taken into account, as is general relativity. Particles were integrated over the full span of time unless their trajectories became hyperbolic, in which case they are stopped to avoid numerical overflows.
We set up different logs to be able to analyze the evolution of the test particles and in particular the impact of close encounters with the 11 asteroids. We recorded for each particle its instantaneous orbital elements every 1 kyr. We did not compute proper elements but instead used the minimum and maximum values (Laskar 1994) taken by a, e, and I on time spans of 10 kyr. We used here the average of the minimum and maximum values as proper elements. We also set up a log of close encounters for each particle. Each time that a particle passed within 0.01 AU from an asteroid, the asteroid number, the minimum distance of approach, and the time of the encounter were recorded in the logs.
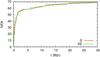 |
Fig. 2 Number of near-Earth asteroids (NEA) among the synthetic Vesta family as a function of time in S and SE. The criterion for considering a fragment as an NEA is based on the minimum value taken by the periastron. When this value is less than 1.3 AU the fragment is considered an NEA. |
3. Global overview of the diffusion
The goal of this study is to understand whether the current flux of V-type asteroids that comes from the main belt and is carried to near-Earth orbits through strong planetary resonances can be explained by the chaos induced by close encounters in the main asteroid belt (or at least if these encounters contribute significantly). The simplest way to check this assumption is to consider the number of NEAs in S and SE simulations as a function of time and to see if the consideration of asteroidal interactions implies more NEAs. We used the usual criterion to decide whether an asteroid is an NEA or not: if the periastron of its orbit becomes smaller than 1.3 AU, the asteroid is considered an NEA (see for example Morbidelli et al. 2002). In Fig. 2 we plot the evolution of the number of NEAs in both simulations as a function of time. We can see in this graph that the close encounters do not have a major effect on the population of NEAs during the simulation. However, we did not run our simulations on the total age of the Vesta family (around 1.2 Gyr) and we assume that just after the collision that produced the Vesta family, the population of V-type NEAs is dominated by fragments of the collision that were directly injected into the two main resonances. The diffusion process is supposed to provide these resonances on a much longer time scale.
Another way to search for the effect of close encounters is to compare the proper elements of the initial and final distribution of fragments in both simulations. A common way to do that is to compute the standard deviation of different proper elements (and in particular the semi-major axis) on the whole population of fragments at a time t with respect to the initial values of these elements (see for example Carruba et al. 2003): 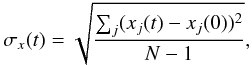 (1)where x can be the semi-major axis a, the eccentricity e or the inclination I of Vesta family fragments. We used the averages of the minima and maxima as proper elements, and in particular for the initial values we computed them on the first 10 kyr of the simulation. We did not use the initial conditions given in Fig. 1 because they are only instantaneous values.
We measured only the diffusion in the semi-major axis caused by close encounters, i.e., we excluded resonances, in particular strong ones. For this purpose we plotted the value of the standard deviation between the beginning and the end (after 30 Myr of evolution) for both simulations (S, SE) as a function of the initial (proper) semi-major axis. We divided the interval of the semi-major axis into bands of 0.01 AU and computed for each band the standard deviation (of the semi-major axis, the eccentricity, and the inclination) of the set of asteroids that were initially in this band. The results of this calculation are given in Fig. 3. We can see that the strong resonance 3:1 around 2.5 AU induces considerable diffusion in both S and SE and that for a semi-major axis lower than 2.25 AU both simulations are strongly affected by resonances (see Nesvorný et al. 2008, for a list of resonances acting on the Vesta family). Note that in strong resonances most fragments are highly unstable and for a great part of them the calculation stops before the end of the simulation (collisions with a planet or the Sun, or escapes from the solar system). Therefore calculations of the diffusion between the beginning and the end of the simulation in these zones are not representative of their instability (see Fig. 3D).
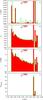 |
Fig. 3 Semi-major axis dependency of the diffusion in semi-major axis (A), eccentricity (B), and inclination (C) in S and SE. For each band of 0.01 AU, we plot the standard deviation of the average of the minimum and the maximum values of a (respectively e and I) during the last 10 kyr of the simulations with respect to the initial values (see Eq. (1)). Some of the particle’s orbits are not integrated on the total duration of the simulation because of their instability. We plot the number of these fragments for each band of initial semi-major axis (D). For bands containing unstable fragments (in both simulations: around 2.5 AU, i.e., around the 3:1 resonance with Jupiter) the calculation of standard deviations is underestimated and comparisons between both simulations are meaningless. |
Between 2.26 and 2.48 AU, S shows a very limited semi-major axis diffusion even though we can see small peaks (e.g., around 2.42 AU corresponding to the 1:2 resonance with Mars). SE undergoes a more important diffusion in this band. We ran our calculations on this band because it fulfills two important conditions at the same time: the diffusion caused by resonances is limited and the band contains (at the beginning of the simulation) a sufficient amount of fragments (2617 of the 3168 fragments), which is important for the statistics. Note that for the eccentricity and the inclination, the diffusion is hidden in the remaining oscillations caused by the secular evolution of these elements induced by the planets.Thus, the diffusion in eccentricity and inclination caused by close encounters as well as the diffusion caused by weak resonances (e.g., 1:2 with Mars) is not visible in Fig. 3B and C. However, this is not really a problem since in this work we are mainly interested in the semi-major axis diffusion.
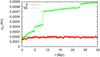 |
Fig. 4 Evolution in time of the semi-major axis diffusion in S and SE. We plot the standard deviation of the average of the minimum and the maximum values of a for each fragment over 10 kyr steps with respect to the initial values (see Eq. (1)) for asteroids whose semi-major axes are initially between 2.26 and 2.48 AU (to avoid strong resonances). |
The evolution (in time) of the standard deviation of the semi-major axis computed on the 2.26–2.48 AU band for both simulations is plotted in Fig. 4. The standard deviation is approximately constant for S, which reinforces our choice of this band. In contrast, SE clearly undergoes diffusion. Analyzing Fig. 4 gives us an approximation of the drift in semi-major axis caused by asteroidal interactions during the simulation. After 30 Myr of evolution, we have a standard deviation around 9 × 10⁻⁴ AU for SE and 2 × 10⁻⁴ AU for S. To evaluate the diffusion caused by asteroidal interactions, we have to remove the diffusion obtained in the reference simulation (which is probably caused by resonances and output sampling of the secular evolution of the semi-major axis) from the total standard deviation. Note that the total variance (the squared of the standard deviation) is the sum of the variances of the different contributions. Thus we obtain a standard deviation caused by asteroidal interactions after 30 Myr of evolution of about 8.8 × 10⁻⁴ AU. We also observe several jumps in the semi-major axis diffusion, which are caused by very close encounters of a single fragment with one of the 11 considered asteroids. Indeed, it has been shown (Carruba et al. 2007) that the distribution of jump sizes is not a Gaussian but has thicker wings. Therefore the curve is not regular on the time scale of this simulation because of the presence of rare very significant events. We can find the same kind of effects in Fig. 3, the curve is not regular in the 2.26–2.48 AU band and shows peaks caused by a few very close encounters.
4. Diffusion induced by asteroid close encounters
The global analysis that we made does not allow us to separate the contributions of the 11 asteroids in the diffusion process or to extrapolate to the whole main asteroid belt. To do this we have to examine logs of close encounters and estimate the diffusion resulting from each of these events and then compile statistics. This entire analysis is still restricted to the 2.26–2.48 AU band to avoid the strong resonances as previously.
For each encounter recorded in the logs we compared the value of the semi-major axis before and after the encounter. Figure 5 gives an example of the evolution of the semi-major axis of a fragment that underwent several close encounters that resulted in jumps of different sizes. Figure 6 gives a more unusual example of the evolution of a fragment that underwent a very close encounter with Vesta resulting in a very significant jump in semi-major axis.
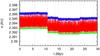 |
Fig. 5 Semi-major axis evolution of a fragment that underwent various close encounters. We plot the maximum, minimum, and instantaneous values of the semi-major axis of the fragment. All times of encounters closer than 10-3 AU are highlighted with dotted vertical lines. |
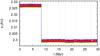 |
Fig. 6 Semi-major axis evolution of a fragment that underwent a very close encounter (minimum distance of 3.4 × 10⁻⁵ AU) with Vesta (at t ≈ 8.39 Myr). We plot the maximum, minimum, and instantaneous values of the semi-major axis of the fragment. All times of encounters closer than 10-3 AU are highlighted with dotted vertical lines. |
We analyzed statistically all encounters with each of the 11 asteroids. As an example of our results, Fig. 7 gives the histograms of jump sizes for close encounters with the first four asteroids considered in the simulation (Ceres, Pallas, Juno, and Vesta). These distributions are centered on 0, which means that the probabilities are the same to have an increase or a decrease of the semi-major axis after a close encounter. We thus measure the average diffusion resulting from a single encounter with each of the 11 asteroids by calculating the standard deviation of each distribution.
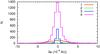 |
Fig. 7 Histograms of jump sizes caused by close encounters with Ceres (1), Pallas (2), Juno (3), and Vesta (4). These histograms are plotted with a step width of 5 × 10⁻⁵ AU. |
As we already noticed, it is more convenient to manipulate variances than standard deviations since the latter are not additive. If we assume that close encounters are independent events, every fragment undergoes a random walk and after N encounters, the total variance is multiplied by a factor N: ![Mathematical equation: \begin{equation} \label{eq:sigN} \sigma_a^2 [N] = N \sigma_a^2 [1]. \end{equation}](/articles/aa/full_html/2012/04/aa18339-11/aa18339-11-eq26.png) (2)This gives a measure of the average diffusion resulting from N encounters with the considered asteroid. We then merely need to replace N by the mean number of close encounters per fragment with the selected asteroid during the whole simulation to obtain the diffusion (variance) caused by this asteroid during the simulation. The diffusion caused by close encounters with all 11 asteroids during the simulation is the sum of the variances of the 11 asteroids. With the same reasoning as for Eq. (2) it is possible to extrapolate the value of the variance on longer time-scales:
(2)This gives a measure of the average diffusion resulting from N encounters with the considered asteroid. We then merely need to replace N by the mean number of close encounters per fragment with the selected asteroid during the whole simulation to obtain the diffusion (variance) caused by this asteroid during the simulation. The diffusion caused by close encounters with all 11 asteroids during the simulation is the sum of the variances of the 11 asteroids. With the same reasoning as for Eq. (2) it is possible to extrapolate the value of the variance on longer time-scales:  (3)Note that as has been shown (e.g. Nesvorný et al. 2002), close encounters do not exactly trigger random walk (there are some correlations between successive encounters) and that the variance is not exactly linear with time (or number of encounters). It can, indeed, be written as a power law of the form
  (4)For a random walk B = 0.5. Numerical estimates of this coefficient B for different families (see Nesvorný et al. 2002; Carruba et al. 2003; Novaković et al. 2010) show that it depends on the family considered and can even evolve with time. However, the values found in the literature range between 0.5 and 0.65 and we did not find any estimations in the case of the Vesta family so we decided to stick to the random walk hypothesis.
Comparison of the contributions of the encounters with the 11 asteroids to the semi-major axis diffusion. All standard deviations are given in AU.
In this reasoning we excluded the influence of noise in the calculation of jumps sizes. Indeed, we observe in Figs. 5 and 6 that the minimum and maximum values of the semi-major axis are not constant outside the close encounters (jumps) but undergo oscillations that are caused by remaining secular evolution. It is possible to eliminate a considerable part of this noise by taking the minimum of minima and the maximum of maxima over longer time-scales before and after the encounters. To choose the best time interval to compute these extrema, and to evaluate the remaining noise after this treatment, we used the reference simulation S and calculated the standard deviation of the difference of semi-major axis before and after random times. Since there are no close encounters, there are no jumps in this simulation, and this standard deviation measures only the remaining noise. With this method we computed the standard deviation of the noise for different time intervals for the calculation of extrema and found that the minimum value (4.4 × 10⁻⁵ AU) is obtained for an interval length of 200 kyr. This is the value we employed for all following calculations.
The variance of jump sizes in SE (for real close encounters) is affected by the same noise. The value we obtained for this variance is the sum of the real diffusion variance and the variance of the noise. Thus the real diffusion resulting from close encounters is given by ![Mathematical equation: \begin{equation} \bar{\sigma}_a^2[1] = \sigma_a^2[1] - \sigma_{\rm noise}^2. \end{equation}](/articles/aa/full_html/2012/04/aa18339-11/aa18339-11-eq38.png) (5)Another problem we experienced is that the logs of close encounters record all encounters within 0.01 AU, but it appears that at this distance the effect is too weak and is completely hidden in the noise. Thus statistics are contaminated by false events (without real jumps). To avoid this contamination we considered only encounters within 0.001 AU, which are more significant events.
(5)Another problem we experienced is that the logs of close encounters record all encounters within 0.01 AU, but it appears that at this distance the effect is too weak and is completely hidden in the noise. Thus statistics are contaminated by false events (without real jumps). To avoid this contamination we considered only encounters within 0.001 AU, which are more significant events.
Finally, when a fragment undergoes several close encounters spaced by less than 200 kyr, we are unable to separate the effect of each encounter. We therefore ignored all such multiple encounters and kept only single encounters for calculating the standard deviation of the jumps size. However, when we computed the total diffusion during the simulation we used all encounters that occurred during the simulation because multiple encounters should not be ignored.
Table 1 lists the results we obtained for each asteroid and for the 11 asteroids together. We give the numbers of encounters during the simulation (including multiple encounters), the standard deviation obtained from statistics on single encounters (σa [1]), the corrected values from the noise (![Mathematical equation: \hbox{$\bar\sigma_a[1]$}](/articles/aa/full_html/2012/04/aa18339-11/aa18339-11-eq33.png) ) and the standard deviations during the simulation (
) and the standard deviations during the simulation ( ). Finally, the percentages of contribution of the different asteroids are given in term of variance. We obtained a total diffusion caused by close encounters of 8.63 × 10⁻⁴ AU during the 30 Myr of the simulation (see Table 1). This number is to be compared with the drift rate obtained with the global approach (8.8 × 10⁻⁴ AU). The results given by both methods agree well.
By using Eq. (3) we can extrapolate our results to longer times:  (6)Of course it is possible to do the same for the contribution of each asteroid. This allows us to compare our results with the previous study of Carruba et al. (2007). In this article, the authors found a drift rate of
  AU/(100 Myr) by considering only close encounters with Vesta. If we extrapolate our results to 100 Myr and consider only Vesta, we find a drift of 1.3 × 10⁻³ AU, which is coherent with Carruba et al. (2007) findings.
Considering the different contributions in Table 1, we see that close encounters with Ceres and Vesta together represent about 99% of the total diffusion (in variance). Contributions from the nine other asteroids seem negligible. This is coherent with findings of previous studies on other asteroid families (see in particular Carruba et al. 2003). On the contrary, since Ceres represents 36% of the diffusion, this asteroid should not be neglected (like in Carruba et al. 2007). We believe that there are two main reasons for these proportions of contribution: the mass of the asteroids and their proximity with the Vesta family members in phase space. The mass must influence the significance of the effect of a single close encounter, whereas the proximity in phase space influences the number of these events. To check for these correlations we plotted the variance caused by close encounters as a function of the mass of the considered asteroid (Fig. 8) and the number of events as a function of the distance in phase space of the considered asteroid with respect to Vesta (Fig. 9). We used the definition of the distance in phase space introduced by Zappala et al. (1994):  (7)This distance has the dimensions of a velocity since it is an estimate of the ejection velocity that would be needed to carry two objects that initially are at the same position to their current positions. In Eq. (7), we used the mean values of the semi-major axes, the eccentricities and the inclinations of the 11 asteroids during the whole simulation (30 Myr) to compute the distances. We deduce from these plots that we indeed have an effect of the mass and the proximity in phase space but we cannot obtain a simple and precise law to evaluate the diffusion that would result from close encounters with other asteroids than the ones considered in our simulation.
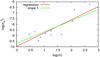 |
Fig. 8 Contribution to the semi-major axis diffusion caused by each asteroid as a function of its mass. |
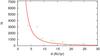 |
Fig. 9 Number of close encounters (<10-3 AU) between Vesta family fragments and each of the 11 considered asteroids as a function of the distance in phase space between these asteroids and Vesta. We used the mean values of the semi-major axes, the eccentricities and the inclinations of the 11 asteroids during the 30 Myr of the simulation to compute the distances (see Eq. (7)). |
However, we can constrain the global effect of the remaining objects of the main asteroid belt. In our simulation we took into account the most massive objects of the main asteroid belt. Indeed, if we add the masses of the 11 asteroids of our simulation we obtain a total mass of 8.36 × 10⁻¹⁰ M⊙. The estimated total mass contained in the main asteroid belt is about 15 × 10-10 M⊙ (obtained from INPOP10a fits, Fienga et al. 2011), while Krasinsky et al. (2002) gave 18 × 10-10 M⊙. The most massive asteroid in the main belt is Ceres with 4.76 × 10⁻¹⁰ M⊙, thus the remaining mass (not considered in our simulation) represents about 1.5 to 2 times the mass of Ceres. The total mass contained in the main asteroid belt is not well constrained but we can assume the upper limit of this remaining mass to be about twice the mass of Ceres.
In Fig. 8, the slope of the regression curve is about 1.2. We plotted a straight line of slope 1 for comparison. A slope of 1 means that two objects of masses 0.5 have the same effect as one of mass 1. If the slope is higher than 1, it is more efficient to have a single object, whereas if the slope is lower than 1, it is more efficient to have two objects. Even if this slope is not well constrained in Fig. 8 it is reasonable to consider that it is greater than 1, accordingly it is more efficient to have one big object than to split it into smaller objects. Therefore, we can assume that the total contribution of the remaining objects of the main belt will be less than twice the contribution of Ceres.
We still have the problem of the influence of the distance in phase space, but it seems realistic to consider that the case of Vesta is singular since it is the parent body of the Vesta family and that the remaining objects must have a probability of close encounter closer to that of Ceres than to Vesta (Fig. 9). Thus, the total variance caused by encounters with all asteroids of the main belt should not exceed (and is probably a lot lower than) 1.7 times the value of the variance obtained in our simulation. In terms of standard deviations it corresponds to a factor of about 1.3.
5. Comparison with the Yarkovsky-YORP effect
The Yarkovsky effect is a non-gravitational force that results from the interaction between asteroids and the solar radiation. There are two versions of the Yarkovsky effect: a diurnal and a seasonal effect. The diurnal effect can result in an increase or a decrease of the semi-major axis depending on the obliquity (ϵ) of the asteroid ( ∝ cosϵ), whereas the seasonal effect systematically decreases the semi-major axis (∝ sin2ϵ). The diurnal effect is maximal when ϵ = 0° or 180° and is zero when ϵ = 90°. In contrast, the seasonal effect is maximal when ϵ = 90° and zero when ϵ = 0°,180°. Both effects are size-dependent, for instance the diurnal effect is given for basaltic material by (see in particular Nesvorný et al. 2008) 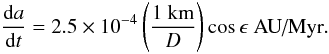 (8)In addition to the Yarkovsky effect, we have to consider the YORP (Yarkovsky – O’Keefe – Radzievskii – Paddack) effect, which also comes from the solar radiation but affects the rotational velocity and the obliquity of asteroids. This effect highly depends on the shape and the surface composition of the asteroid but it is possible to assemble some statistics to understand what the most probable scenario is (Vokrouhlický & Čapek 2002; Čapek & Vokrouhlický 2004). It has been shown (Čapek & Vokrouhlický 2004) that for most of the basaltic asteroids (more than 95%), the obliquity is asymptotically driven to 0° or 180° by the YORP effect. The time scale for the YORP effect is about 10–50 Myr (Vokrouhlický & Čapek 2002; Morbidelli & Vokrouhlický 2003). This means that on a 1 Gyr time scale (which is the order of magnitude for the age of the Vesta family, Carruba et al. 2007), we can consider that the obliquity is either 0° or 180° during the whole evolution and that the seasonal effect is negligible and the diurnal effect is maximal (in one or the other direction).
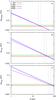 |
Fig. 10 Comparison of the semi-major axis diffusion induced by the close encounters and by the Yarkovsky effect after 250 Myr (A), 1 Gyr (B) and 3 Gyr (C). EN is the diffusion caused by close encounters with the 11 asteroids considered in our simulations. TEN is the extrapolation we performed for the entire main belt ( × 1.3). YMX stands for the maximum diurnal Yarkovsky effect. YRW stands for the Yarkovsky effect with reorientations (random walk). |
Nevertheless, the collisions must also be taken into account. We have to distinguish whether a collision is destructive or not. The collisional life time of a 1–10 km asteroid in the main belt is about 1 Gyr. But non-destructive collisions are more frequent and can reorient the spin axis of the asteroid. The characteristic time scale of these events is given (still for basaltic material) by (Farinella et al. 1998; Morbidelli & Vokrouhlický 2003)  (9)For kilometer-sized asteroids, the time between two reorienting collisions is about 300 Myr. This means that there are a few (3 or 4) reorientations on the time scale of the age of the Vesta family. Thus it is likely that these reorientations will reduce the diffusion caused by the Yarkovsky effect, but not by a large factor. Moreover, we can still consider that the YORP effect acts almost instantaneously between two reorientations and that the seasonal Yarkovsky effect is negligible and the diurnal effect is always maximal.
Considering these different results we estimate the diffusion of Vesta family members under the effect of Yarkovsky, YORP, and collisions by a simple random walk process and the maximal diurnal Yarkovsky effect between each reorientation. Figure 10 shows a comparison between the diffusion caused by close encounters and the one caused by the Yarkovsky effect as functions of the asteroid diameter at different times (250 Myr, 1 Gyr and 3 Gyr). For the close encounters, we plotted the diffusion obtained for the 11 asteroids and the extrapolation we deduced for the whole main asteroid belt. For the Yarkovsky effect we plotted both the maximum diurnal effect (without any reorientation) and the result of the random walk process. We can see that reorienting collisions do not affect much the magnitude of the Yarkovsky effect for the range of diameters we are interested in, even at 3 Gyr. We recall that the estimated age of the Vesta family is about 1 Gyr (Carruba et al. 2007). For this duration, close encounters are dominant for the diffusion of asteroids larger than 40 ± 5 km (Fig. 10), but below this value the Yarkovsky effect is prevailing. For a diameter of 1 km the Yarkovsky effect is about 25 times greater than the effect of close encounters.
Regarding the time evolution of these effects, we assumed that close encounters generate a random walk process that evolves as  , whereas the maximum Yarkovsky effect is linear with time. When we include reorientations for the Yarkovsky effect, we also have a random walk process, therefore the evolution law should be proportional to . However, this is an asymptotic law that is valid when a great number of random walk steps is reached. For reorienting collisions the characteristic time is about 300 Myr, accordingly, there are only a few steps per Gyr and the asymptotic law is invalid on this time scale. It means that for the time scale we are interested in, the Yarkovsky effect evolves faster than , i.e., faster than close encounters. This is exactly what we observe in Fig. 10: for 250 Myr the close encounters take a more important part in the diffusion process (equivalence of the two effects for D = 19 km), whereas for 3 Gyr the Yarkovsky effect is even more prevailing (equivalence for D = 54 km). Note that known Vesta family members are relatively small objects. The biggest members have a diameter of about 7–8 km (absolute magnitude of 12, see Nesvorný et al. 2008). For these diameters, the Yarkovsky effect is thus dominating the diffusion caused by close encounters by a factor of about 4–5 over 1 Gyr.
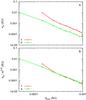 |
Fig. 11 Semi-major axis jump size for a single encounter with Ceres (1) and Vesta (4) as a function of the minimum distance of approach. Close encounters with both asteroids are sorted into 0.001 AU wide strips of minimum distance of approach. For each band we plot A) the standard deviation (corrected from the noise) of the jump size distribution. This plot needs the effect of encounters to be much higher than the noise. It also needs a sufficient number of encounters in each band to attain a regular curve. This is why we only plotted the curves of Ceres and Vesta. We also plot B) the standard deviations with a renormalization for Ceres. We divided Ceres values by the mass ratio of Ceres and Vesta to the power 0.8. Vesta’s curve is left unchanged. This power law would be equivalent to a slope of 1.6 (instead of 1.2) in Fig. 8. However, the fit of the slope in Fig. 8 is made with 11 points and is therefore more reliable. |
6. Very close encounters
When we compare the global (average) effect on the semi-major axis diffusion of the Vesta family induced by close encounters with the Yarkovsky effect, we find that the latter is much more important. However, we have also seen that a single very close encounter can result in a very significant jump in semi-major axis (see Fig. 6).
Here we quantify the probability and the impact of very close encounters. Figure 11 gives the change in semi-major axis during a single encounter as a function of the minimum distance of approach for Ceres and Vesta. Because close encounters with Vesta are more frequent, determinating the evolution law is more reliable using Vesta data. By fitting for the standard deviation of Vesta (Fig. 11), we obtain the following power law: (10)Assuming that this formula remains valid for very close encounters, we can extrapolate our results and look, for instance, at the effect of encounters at distances comparable to the diameter of Vesta. When the minimum distance of approach with respect to Vesta is on the order of the magnitude of its diameter (about 512 km, Drummond & Christou 2008), Eq. (10) gives a jump size of 1.3 AU.
The probability of such an encounter can be evaluated using the same approach as in Laskar et al. (2011). We obtain a number of encounters closer than the diameter of Vesta (without colliding, i.e., farther away than the radius of Vesta) of about 7 × 10⁻⁴ per Gyr and per fragment. This means that on the time scale of the age of the Vesta family (1 Gyr), 1 fragment in 1400 should undergo such an encounter. As a comparison, Nesvorný (2010) catalog lists 13 800 members of the Vesta family.
We used the symplectic integrator SABA4 of Laskar & Robutel (2001) with a stepsize of 5 × 10⁻² years throughout. But contrary to Laskar & Gastineau (2009), the step size was not reduced here during close approaches, because this would have reduced the integration time too much, because of the large number of particles present. The regularity of the curves presented in Fig. 11 indicates that our study did not suffer significantly from this drawback.
7. Conclusion
We evaluated the effect of close encounters between Vesta family members and massive asteroids on the semi-major axis diffusion of the family. We calculated this effect by two methods. We first considered the collective effect of close encounters and deduced an estimate of the semi-major axis drift caused by the 11 massive asteroids taken into account here. Then we studied the close encounters individually and assembled statistics on these events.
With this second method we were able to separate the contribution of each of the 11 asteroids to the diffusion. We showed that both methods yield comparable results and that our findings are compatible with previous work on the Vesta family (Carruba et al. 2007). We used the results we obtained for the 11 asteroids to extrapolate and constrain the diffusion that would result from close encounters with all main-belt asteroids. We showed that this diffusion should not exceed 1.3 times the diffusion caused by the 11 asteroids. Finally, we compared the diffusion caused by close encounters with the Yarkovsky-driven drift of the semi-major axis of asteroids in the 1–100 km range (in terms of asteroids diameters). We found that both effects are equivalent over 1 Gyr for a diameter of 40 ± 5 km. For smaller asteroids the Yarkovsky effect dominates the semi-major axis diffusion and for larger asteroids close encounters become more important. Since Vesta family members are all smaller than 7–8 km, we confirmed that although asteroid close encounters have a significant influence, the main mechanism of semi-major axis diffusion that transports main-belt asteroids (and especially V-type asteroids) to Earth-crossing orbits via strong resonances is the Yarkovsky effect. This global approach should not hide that a small fraction of initial Vesta family members underwent very close encounters that resulted in considerable alterations of their orbits. For example, we estimated that about 10 fragments of the 13 800 known Vesta family objects (Nesvorný 2010) may have had an encounter with Vesta within one diameter over the age of the family (about 1 Gyr) and this kind of event may have resulted (in terms of semi-major axis) in jumps of about 1 AU.
Acknowledgments
This work was supported by ANR-ASTCM, INSU-CNRS, PNP-CNRS, and CS, Paris Observatory. Part of the computations were made at CINES/GENCI.
References
- Carruba, V., Burns, J. A., Bottke, W., & Nesvorný, D. 2003, Icarus, 162, 308 [NASA ADS] [CrossRef] [Google Scholar]
- Carruba, V., Roig, F., Michtchenko, T. A., Ferraz-Mello, S., & Nesvorný, D. 2007, A&A, 465, 315 [NASA ADS] [CrossRef] [EDP Sciences] [Google Scholar]
- Drummond, J., & Christou, J. 2008, Icarus, 197, 480 [NASA ADS] [CrossRef] [Google Scholar]
- Farinella, P., Vokrouhlicky, D., & Hartmann, W. K. 1998, Icarus, 132, 378 [NASA ADS] [CrossRef] [Google Scholar]
- Fienga, A., Laskar, J., Kuchynka, P., et al. 2011, Cel. Mech. Dyn. Astron., 101 [Google Scholar]
- Krasinsky, G. A., Pitjeva, E. V., Vasilyev, M. V., & Yagudina, E. I. 2002, Icarus, 158, 98 [CrossRef] [Google Scholar]
- Laskar, J. 1994, A&A, 287, L9 [NASA ADS] [Google Scholar]
- Laskar, J., & Gastineau, M. 2009, Nature, 459, 817 [NASA ADS] [CrossRef] [PubMed] [Google Scholar]
- Laskar, J., & Robutel, P. 2001, Cel. Mech. Dyn. Astron., 80, 39 [NASA ADS] [CrossRef] [Google Scholar]
- Laskar, J., Gastineau, M., Delisle, J.-B., Farrés, A., & Fienga, A. 2011, A&A, 532, L4 [NASA ADS] [CrossRef] [EDP Sciences] [Google Scholar]
- Migliorini, F., Morbidelli, A., Zappala, V., et al. 1997, Meteor. Planet. Sci., 32, 903 [Google Scholar]
- Morbidelli, A., & Gladman, B. 1998, Meteor. Planet. Sci., 33, 999 [Google Scholar]
- Morbidelli, A., & Vokrouhlický, D. 2003, Icarus, 163, 120 [NASA ADS] [CrossRef] [Google Scholar]
- Morbidelli, A., Bottke, Jr., W. F., Froeschlé, C., & Michel, P. 2002, Asteroids III, 409 [Google Scholar]
- Nesvorný, D. 2010, Nesvorny HCM Asteroid Families V1.0. EAR-A-VARGBDET-5-NESVORNYFAM-V1.0. NASA Planetary Data System [Google Scholar]
- Nesvorný, D., Morbidelli, A., Vokrouhlický, D., Bottke, W. F., & Brož, M. 2002, Icarus, 157, 155 [NASA ADS] [CrossRef] [Google Scholar]
- Nesvorný, D., Roig, F., Gladman, B., et al. 2008, Icarus, 193, 85 [NASA ADS] [CrossRef] [Google Scholar]
- Novaković, B., Tsiganis, K., & Knežević, Z. 2010, Cel. Mech. Dyn. Astron., 107, 35 [Google Scholar]
- Sears, D. 1997, Meteor. Planet. Sci., 32, 3 [NASA ADS] [CrossRef] [Google Scholar]
- Čapek, D., & Vokrouhlický, D. 2004, Icarus, 172, 526 [NASA ADS] [CrossRef] [Google Scholar]
- Vokrouhlický, D., & Čapek, D. 2002, Icarus, 159, 449 [NASA ADS] [CrossRef] [Google Scholar]
- Zappala, V., Cellino, A., Farinella, P., & Milani, A. 1994, AJ, 107, 772 [NASA ADS] [CrossRef] [Google Scholar]
All Tables
Comparison of the contributions of the encounters with the 11 asteroids to the semi-major axis diffusion. All standard deviations are given in AU.
All Figures
|
Fig. 1 Initial distribution of the synthetic Vesta family in the (a,e) plane (top) and the (a,I) plane (bottom). Real members proper elements (from Nesvorný 2010) are superimposed for comparison. |
| In the text | |
|
Fig. 2 Number of near-Earth asteroids (NEA) among the synthetic Vesta family as a function of time in S and SE. The criterion for considering a fragment as an NEA is based on the minimum value taken by the periastron. When this value is less than 1.3 AU the fragment is considered an NEA. |
| In the text | |
|
Fig. 3 Semi-major axis dependency of the diffusion in semi-major axis (A), eccentricity (B), and inclination (C) in S and SE. For each band of 0.01 AU, we plot the standard deviation of the average of the minimum and the maximum values of a (respectively e and I) during the last 10 kyr of the simulations with respect to the initial values (see Eq. (1)). Some of the particle’s orbits are not integrated on the total duration of the simulation because of their instability. We plot the number of these fragments for each band of initial semi-major axis (D). For bands containing unstable fragments (in both simulations: around 2.5 AU, i.e., around the 3:1 resonance with Jupiter) the calculation of standard deviations is underestimated and comparisons between both simulations are meaningless. |
| In the text | |
|
Fig. 4 Evolution in time of the semi-major axis diffusion in S and SE. We plot the standard deviation of the average of the minimum and the maximum values of a for each fragment over 10 kyr steps with respect to the initial values (see Eq. (1)) for asteroids whose semi-major axes are initially between 2.26 and 2.48 AU (to avoid strong resonances). |
| In the text | |
|
Fig. 5 Semi-major axis evolution of a fragment that underwent various close encounters. We plot the maximum, minimum, and instantaneous values of the semi-major axis of the fragment. All times of encounters closer than 10-3 AU are highlighted with dotted vertical lines. |
| In the text | |
|
Fig. 6 Semi-major axis evolution of a fragment that underwent a very close encounter (minimum distance of 3.4 × 10⁻⁵ AU) with Vesta (at t ≈ 8.39 Myr). We plot the maximum, minimum, and instantaneous values of the semi-major axis of the fragment. All times of encounters closer than 10-3 AU are highlighted with dotted vertical lines. |
| In the text | |
|
Fig. 7 Histograms of jump sizes caused by close encounters with Ceres (1), Pallas (2), Juno (3), and Vesta (4). These histograms are plotted with a step width of 5 × 10⁻⁵ AU. |
| In the text | |
|
Fig. 8 Contribution to the semi-major axis diffusion caused by each asteroid as a function of its mass. |
| In the text | |
|
Fig. 9 Number of close encounters (<10-3 AU) between Vesta family fragments and each of the 11 considered asteroids as a function of the distance in phase space between these asteroids and Vesta. We used the mean values of the semi-major axes, the eccentricities and the inclinations of the 11 asteroids during the 30 Myr of the simulation to compute the distances (see Eq. (7)). |
| In the text | |
|
Fig. 10 Comparison of the semi-major axis diffusion induced by the close encounters and by the Yarkovsky effect after 250 Myr (A), 1 Gyr (B) and 3 Gyr (C). EN is the diffusion caused by close encounters with the 11 asteroids considered in our simulations. TEN is the extrapolation we performed for the entire main belt ( × 1.3). YMX stands for the maximum diurnal Yarkovsky effect. YRW stands for the Yarkovsky effect with reorientations (random walk). |
| In the text | |
|
Fig. 11 Semi-major axis jump size for a single encounter with Ceres (1) and Vesta (4) as a function of the minimum distance of approach. Close encounters with both asteroids are sorted into 0.001 AU wide strips of minimum distance of approach. For each band we plot A) the standard deviation (corrected from the noise) of the jump size distribution. This plot needs the effect of encounters to be much higher than the noise. It also needs a sufficient number of encounters in each band to attain a regular curve. This is why we only plotted the curves of Ceres and Vesta. We also plot B) the standard deviations with a renormalization for Ceres. We divided Ceres values by the mass ratio of Ceres and Vesta to the power 0.8. Vesta’s curve is left unchanged. This power law would be equivalent to a slope of 1.6 (instead of 1.2) in Fig. 8. However, the fit of the slope in Fig. 8 is made with 11 points and is therefore more reliable. |
| In the text | |
Current usage metrics show cumulative count of Article Views (full-text article views including HTML views, PDF and ePub downloads, according to the available data) and Abstracts Views on Vision4Press platform.
Data correspond to usage on the plateform after 2015. The current usage metrics is available 48-96 hours after online publication and is updated daily on week days.
Initial download of the metrics may take a while.