Fig. 3
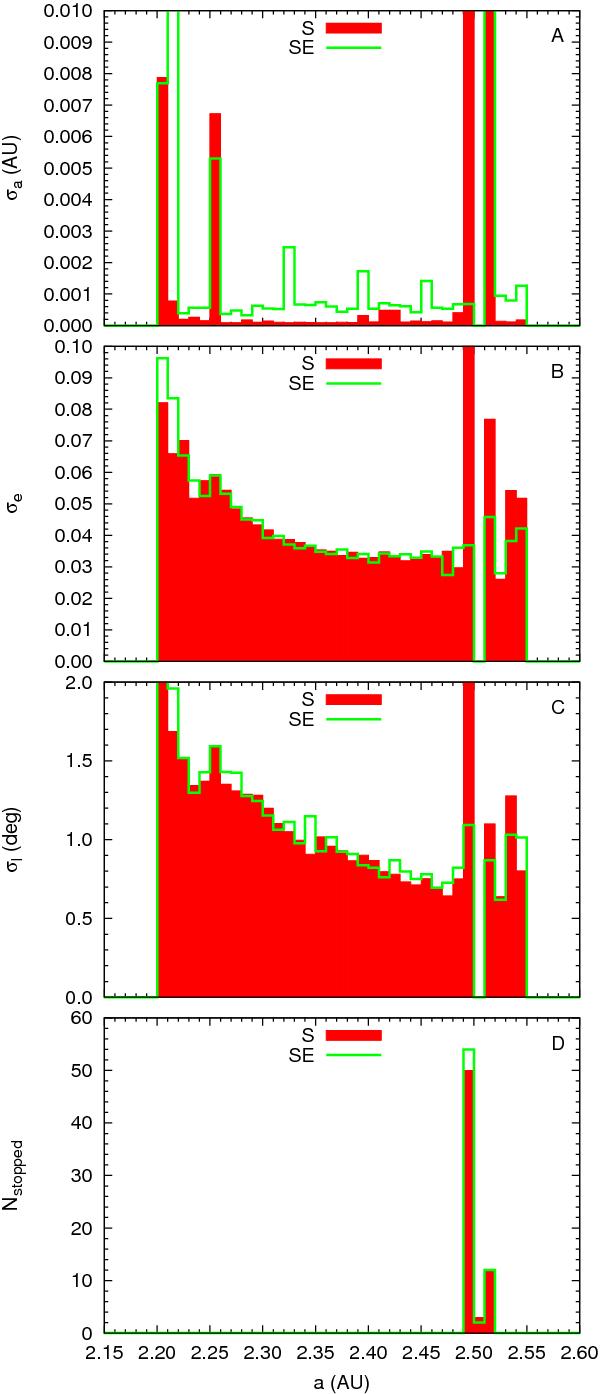
Semi-major axis dependency of the diffusion in semi-major axis (A), eccentricity (B), and inclination (C) in S and SE. For each band of 0.01 AU, we plot the standard deviation of the average of the minimum and the maximum values of a (respectively e and I) during the last 10 kyr of the simulations with respect to the initial values (see Eq. (1)). Some of the particle’s orbits are not integrated on the total duration of the simulation because of their instability. We plot the number of these fragments for each band of initial semi-major axis (D). For bands containing unstable fragments (in both simulations: around 2.5 AU, i.e., around the 3:1 resonance with Jupiter) the calculation of standard deviations is underestimated and comparisons between both simulations are meaningless.
Current usage metrics show cumulative count of Article Views (full-text article views including HTML views, PDF and ePub downloads, according to the available data) and Abstracts Views on Vision4Press platform.
Data correspond to usage on the plateform after 2015. The current usage metrics is available 48-96 hours after online publication and is updated daily on week days.
Initial download of the metrics may take a while.