| Issue |
A&A
Volume 678, October 2023
|
|
|---|---|---|
| Article Number | A70 | |
| Number of page(s) | 10 | |
| Section | Planets and planetary systems | |
| DOI | https://doi.org/10.1051/0004-6361/202347224 | |
| Published online | 06 October 2023 | |
Gravitational study of escape routes and residence regions of Ceres and Vesta fragments
1
Instituto de Astrofísica de La Plata, CCT La Plata-CONICET-UNLP,
Paseo del Bosque S/N
(1900),
La Plata, Argentina
e-mail: This email address is being protected from spambots. You need JavaScript enabled to view it.
2
Facultad de Ciencias Astronómicas y Geofísicas, Universidad Nacional de La Plata,
Paseo del Bosque S/N
(1900),
La Plata, Argentina
Received:
18
June
2023
Accepted:
31
August
2023
Abstract
Aims. Ceres and Vesta are the two largest bodies in the main asteroid belt (MB) and have been extensively studied, particularly since the DAWN mission. Vesta is known to have an associated asteroid family, while the existence of a Ceres family is uncertain. This study investigates the fate of multi-kilometre fragments ejected from Ceres and Vesta due to impacts over a timescale of several hundred million years.
Methods. We performed purely gravitational N-body simulations to investigate the dynamical evolution of multi-kilometre-sized fragments ejected from Ceres and Vesta. We tracked the trajectories of these fragments and identified their residence regions within the MB. We analysed the escape routes and end states of the fragments that manage to leave the MB, including the delivery to the near-Earth asteroids (NEAs). We also estimated the number of collisions with Earth that could be attributed to large fragments ejected from Ceres and Vesta.
Results. Our simulations show that the Ceres fragments are dispersed over a larger region in the MB compared to Vesta fragments due to their higher ejection velocities. We identified the escape routes of the fragments that leave the MB, which for the Ceres fragments are the 5:2 and 8:3 mean-motion resonances (MMR), and for the Vesta fragments are the 3:1 MMR and ν6 secular resonance, where they can be delivered to the NEA region. We also find that the Pristine region, located between the 5:2 and 7:3 MMR, is the most likely place to find any surviving member of a Ceres family. There were no collisions of large Ceres or Vesta fragments with Earth over the age of the Solar System, suggesting that, under the model considered here, the howardite–eucrite–diogenite meteorites originate from smaller NEAs from Vesta.
Key words: minor planets, asteroids: general / minor planets, asteroids: individual: Ceres / methods: numerical / minor planets, asteroids: individual: Vesta / methods: statistical
© The Authors 2023
 Open Access article, published by EDP Sciences, under the terms of the Creative Commons Attribution License (https://creativecommons.org/licenses/by/4.0), which permits unrestricted use, distribution, and reproduction in any medium, provided the original work is properly cited.
This article is published in open access under the Subscribe to Open model. This email address is being protected from spambots. You need JavaScript enabled to view it. to support open access publication.
1 Introduction
Ceres and Vesta are the largest and most massive objects in the main asteroid belt (MB). Although asteroids in the MB are widely distributed in semi-major axis a between about 2 au and 3.4 au from the Sun, they can be divided into at least three regions (inner, middle, and outer) due to their different physical and dynamical properties. Ceres, with a semi-major axis a of 2.767 au, and Vesta, with a semi-major axis of 2.364 au, are the dominant members of the middle and inner regions, respectively. They both have low eccentricity e orbits (0.0786 for Ceres and 0.0884 for Vesta) and moderate inclinations i (10.587° for Ceres and 7.14° for Vesta). Similar to all asteroids, they have suffered impacts throughout their lifetimes in the MB, resulting in craters on their surfaces and the ejection of fragments into the MB.
The NASA Dawn space mission recently visited Ceres and Vesta, obtaining significant results regarding their physical properties, such as shape, composition, and interior structure, as well as their surface characteristics. In the case of Vesta, Dawn showed that it is a triaxial ellipsoid with radii of 286.3 × 278.6 × 223.2 km, a mean radius of 262.7 km, and a mean density of 3456 kg m−3 (Russell et al. 2012). As was already supposed, (e.g. McCord et al. 1970) Vesta has a basaltic surface and has experienced a regional or even global melting, implying that it should be a differentiated body with a crust, mantle, and core (Russell et al. 2012). The most prominent surface features are the two large impact basins located in the southern hemisphere, Rheasilvia and Veneneia, with diameters of ~500 km and ~400 km, respectively (Thomas et al. 1997; Schenk et al. 2012). The existence of these large basins, together with the characteristic basaltic surface, links Vesta to other asteroids in the MB with similar spectral characteristics, known as V-type asteroids.
In fact, Vesta has an identified asteroid family that has been extensively studied over the years (Williams 1979; Zappala et al. 1994; Nesvorný et al. 2015). The dynamical evolution of the Vesta family was studied by Carruba et al. (2005) to explain the orbits of V-type asteroids in the inner belt, such as (956) Elisa and (809) Lundia, whose orbits seemed rather distant from Vesta. They found that the combination of the Yarkovsky effect and the secular resonances explains the orbits of these bodies if the age of the Vesta family is at least 1 Gyr. Nesvorný et al. (2008) later found that the dynamical evolution of the Vesta family can explain the orbits of most V-type asteroids in the inner regions. These works were used to constrain the age of the Vesta family to be 1 Gyr. Delisle & Laskar (2012) explored the effect of close encounters between Vesta family asteroids and massive bodies. They investigated whether the chaotic diffusion caused by these close encounters contributes to the present flux of V-type asteroids transitioning from the MB to near-Earth orbits. Their findings indicate that close encounters play a more significant role in larger asteroids (those exceeding 40 km), while for smaller asteroids, the Yarkovsky effect primarily influences the diffusion of their semi-major axes. Additionally, The Dawn mission confirmed that Vesta is the source of the howardite–eucrite–diogenite (HED) meteorites, (McSween et al. 2013), which represent ~3% of the meteorites on Earth (Binzel et al. 2019).
In the case of dwarf planet Ceres, Dawn showed that it is a triaxial ellipsoid of 483.1 × 481.0 × 445.9 km size with a mean radius of 469.7 km. Ceres has a low mean density of 2162 kg m−3 (Russell et al. 2016), which had already suggested that about 25% of its mass could be water ice. Different studies using Dawn observations suggest that Ceres is partially differentiated, with a rocky core, water ice in the upper mantle, and a crust composed of a rock-ice mixture, (Buczkowski et al. 2016; Bland et al. 2016; Hiesinger et al. 2016; Platz et al. 2016; Prettyman et al. 2017). In fact, Ceres has a C-type taxonomic class, formed by objects with an absorption band that can be associated with a process of aqueous alteration (e.g. Lazzaro et al. 2004).
The high definition observations performed by Dawn of the surface of Ceres allowed cratering counts for the entire surface down to a size of 1 km (Marchi et al. 2016; Hiesinger et al. 2016; Gou et al. 2018; Otto et al. 2019). Marchi et al. (2016) showed that the largest visible crater on Ceres is ~280 km wide but that there is evidence of a huge 800 km diameter depression located on the northern hemisphere. This large feature could be a relict impact basin in a region called Vendimia Planitia. They also suggested the presence of two other depressions of 500 and 800 km.
Ceres and Vesta have never suffered catastrophic collisions, but they have been targets of impact events throughout the age of the solar system (Marchi et al. 2012; Gou et al. 2018). In particular the two large craters on Vesta and the impacts that produced the large depressions on Ceres could have been the sources of large fragments ejected from both bodies. Regarding the dynamical families, while Vesta has well-identified members, no such family has been detected for Ceres (Milani et al. 2014). The hypothesis put forward by Milani et al. (2014) and expanded upon by Rivkin et al. (2014) suggests that fragments ejected from Ceres, potentially rich in ice, may have undergone sublimation or erosion through collisional evolution in the MB. However, from Dawn observations, the ice content of Ceres outer shell would not be enough to erode or disintegrate the fragments.
Ceres, as the most massive body in the MB, exerts significant dynamical influence in the environment through secular resonances (Novaković et al. 2015) and mean-motion resonances (MMRs; Christou & Wiegert 2012). In this context, Carruba et al. (2016) performed dynamical simulations of a fictitious Ceres family, assuming fragments of different sizes and ejection velocities. The authors found that, as Ceres is a large and massive object, different situations may occur than in the case of asteroid families from smaller parent bodies. They argue that secular resonances and close encounters with Ceres are capable of dispersing family members and making them difficult to detect beyond timescales of 400 Myr. Also, since the ejection velocities should have been larger than in smaller parent bodies, the fragments would have been scattered further away, and members of the Ceres family would be more distant from each other, making their identification difficult. In fact, they propose that if there are surviving members of a Ceres family, a significant fraction of multi-kilometre fragments could have been injected into the Pristine region of the MB. The Pristine region is limited by the 5:2 and 7:3 MMR with Jupiter that act as dynamic barriers, and consequently, little material could enter from the other regions (Brož et al. 2013). Therefore, the local asteroid density is much lower than in other regions of the MB, and only small C-type families, such as Naema, Terpsichore and Terentia, are present in the region (Nesvorný et al. 2015). So, the work of Carruba et al. (2016) proposes that if any body from Ceres was injected into the Pristine region, large enough not to have been significantly affected by the Yarkovsky effect, then it would still be present there and could be detected.
Recently, Zain et al. (2021) studied the collisional history of Ceres and Vesta using a multipart collisional evolution model of the MB (Zain et al. 2020). They found that both Ceres and Vesta were impacted by large bodies from different regions of the MB over the course of 4 Gyr, and estimated the total number of fragments ejected in these events. Additionally, they showed that even fragments tens of kilometres in diameter could have been ejected from both Ceres and Vesta. Taking this into account, it is important to study the dynamical evolution of these fragments through N-body simulations to determine where they may be located in the solar system and whether they could be a source of near-Earth asteroids (NEAs). Additionally, it is interesting to investigate the possible existence of a family associated with Ceres, even in the Pristine region as suggested by Carruba et al. (2016). Given the physical link between Vesta and HED meteorites, it is also relevant to study the dynamical connection between them.
Based on these motivations, this paper presents N-body simulations of the dynamical evolution of fragments ejected from Ceres and Vesta after a large impact. We consider multi-kilometre-sized fragments, which are not significantly affected by the Yarkovsky effect. Our focus is on identifying escape routes of fragments ejected from Ceres and Vesta from the MB, as well as the potential delivery to the NEA region and their residence regions. The paper is structured as follows: Sect. 2 explains the calculation of initial conditions of all the bodies in the simulations, which includes finding appropriate orbital configurations to define work scenarios, as well as the starting positions and velocities of the ejected fragments. Section 3 presents the results of our dynamical simulations. Finally, Sect. 4 contains the conclusions and discussions.
2 Initial conditions
The N-body code used in our study is MERCURY, developed by Chambers (1999). This code can evolve the orbits of both planetary-sized and small massless bodies, and allows for close encounters, ejections, and collisions to occur. We used the RADAU integrator1 with a tolerance smaller than 10−12. To reduce CPU time, we assumed that the more massive bodies gravitationally interact with all other bodies in the simulations, while small bodies are not self-interacting.
The initial conditions in N-body simulations include the physical and orbital parameters of the bodies involved in the simulation, such as individual masses, physical densities, and heliocentric positions and velocities. In this section, we describe how we defined the work scenarios and constructed the initial conditions of the simulations.
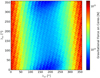 |
Fig. 1 Gravitational force on Ceres, according to the angular separations λJC between Jupiter and Ceres, and between Saturn and Ceres λSC. The maximum values of the gravitational force are associated with λJC ~ 0° and the minimum values with λJC ~ 180°. Similar results are obtained for Vesta. |
2.1 Work scenarios
In the history of the Solar System, large impacts on Ceres and Vesta occurred at specific times, orbital positions, and locations for each object. However, it is impossible to determine the exact location of these impacts, and thus, the starting orbital positions of the planets, Ceres, and Vesta during a large impact event are considered free parameters. Different starting positions may lead to different results due to the chaotic nature of the dynamics of small bodies in the Solar System. Therefore, the first step in our work is to define appropriate work scenarios, which are associated with initial orbit configurations.
As a first step towards defining appropriate work scenarios, we performed a short numerical simulation using the MERCURY code that includes Ceres, Vesta and the eight planets in the Solar System for 0.1 Myr. The ephemeris used for the initial conditions in this first simulation were obtained from NASA’s Horizons System2 in JD = 2 459 156.5.
From this simulation, we calculated the total gravitational force exerted on Ceres and Vesta by the eight planets over time. This force was calculated as the magnitude of the vector sum of the gravitational force exerted by each planet. We find that the strength of this force is primarily determined by the positions of Jupiter and Saturn relative to Ceres and Vesta, as the gravitational forces exerted by the other planets are much weaker. Figure 1 shows the variation of the gravitational force with respect to the angular separations between Jupiter and Ceres λJC, and between Saturn and Ceres λSC. Here, these angular separations are calculated as the difference between the mean longitudes of the bodies involved. We observe that the maximum values of the force occur when λJC ~ 0°, while the minimum values occur when λJC ~ 180°. These results apply equally to the gravitational force acting on Vesta.
The dynamical evolution of the ejected fragments is first affected by the gravitational attraction of the planets on the given configuration, and later by the secular resonances and MMR in the MB (e.g. Bottke et al. 2005). Therefore, we decided to explore two distinct and extreme study scenarios related to the absolute maximum and minimum of the gravitational force on Ceres and Vesta. We refer to the scenario associated with the maximum force as MaxS and the one associated with the minimum force as MinS. The heliocentric positions and velocities obtained from the first simulation of the planets, Ceres, and Vesta at the times associated with each scenario are the initial conditions of the second set of simulations performed in this work.
2.2 Fragment velocities
In cratering events, the ejected fragments that escape from the target after an impact do so in specific directions, associated with the location of the impact (Marchi et al. 2001). However, since it is not possible to know when and where all impacts occurred, we studied the fragment ejection process considering fragments ejected isotropically in random directions from the surface of the parent body3. This assumption implies that over the age of the Solar System, collisions on different locations on the target surface give rise to the ejection of fragments in all directions. We consider this to be good approximation to the real problem and a way to study it statistically, which is the objective of this work.
We consider the dynamical evolution of large multi-kilometre fragments, which are not significantly affected by the Yarkovsky effect over long timescales. According to Zain et al. (2020), the remotion timescales due to the combined effect of the Yarkovsky effect and resonances are of the order of the age of the Solar System for sizes larger than 5 km. Therefore, we assume a characteristic size of 5 km for all fragments in our simulations.
We consider a total of 1000 fragments from each body, out of which 500 are associated with each of the scenarios (MaxS and MinS). In order to set the initial conditions in the MERCURY code, we need to obtain the initial heliocentric position and velocity vectors of each fragment. These vectors were obtained for each scenario as the vectorial sum of the heliocentric positions and velocities of Ceres and Vesta, with the position and velocity vectors of the fragments with respect to their parent body. As mentioned, we assume that the fragments are ejected isotropically in random directions from the surface of the parent body. The ejection velocities of the fragments, with respect to their the parent body, were calculated using a Gaussian distribution (Vokrouhlický et al. 2006; Carruba et al. 2016; Carruba & Nesvorný 2016) with mean value 0 and a standard deviation given by:
 (1)
(1)
where D = 5 km is the fragment size and VEY describes the width of the velocity field. To determine the value of VEY, Carruba et al. (2016) uses a factor β = VEY/Vesc, where Vesc is the escape velocity with respect to the parent body. Only fragments with velocities greater than Vesc are ejected. The escape velocities for Ceres and Vesta were calculated using the values shown in Table 1, which give escape velocities of ~512 m s−1 for Ceres and ~366 m s−1 for Vesta.
The parameter β can take values between 0.5 and 1.5, according to Nesvorný et al. (2015). However, in Carruba et al. (2016), a low value of β = 0.2 was assumed to focus the study of the dynamical evolution in the neighbourhood of Ceres. In our study, we chose a higher value of β = 1, which allows the fragments to reach larger escape velocities and wider orbits than in Carruba et al. (2016).
Figure 2 shows the initial distribution of semi-major axis a, eccentricities e, and inclinations i of the ejected fragments from Ceres in the top panel and Vesta in the bottom panel in MaxS4. These orbital elements were derived from the initial position and velocity vectors of the fragments using the equations of the Two-Body Problem. The eccentricities reach maximum values of ~0.22 in the case of Ceres and ~0.17 in the case of Vesta, while the inclinations remain between 8°–14° for Ceres and 2°–8° for Vesta. The fragments from Ceres are widely distributed in the MB, due to the high ejection velocities. However, ~90% of the fragments remain in the Middle (~70%) and Pristine (~20%) regions of the MB, while the remaining ~10% of bodies, with larger velocities, are injected in the Inner and Outer regions. Similarly for Vesta, ~95% of the fragments remain in the Inner region, where Vesta itself is located, while the few remaining bodies with velocities larger than ~700 m s−1 are injected into the Middle region.
Physical parameters of Ceres (Park et al. 2016), Vesta (Konopliv et al. 2014) and 8 additional asteroids Carry (2012) used in N-body simulations.
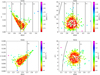 |
Fig. 2 Initial distributions of semi-major axis a, eccentricity e and inclination i of the ejected fragments from Ceres (top panels) and Vesta (bottom panels) in MaxS. The colourbar indicates the ejection velocities with respect to the parent body in km s−1, where red colour indicates slower speeds, while blue and violet colour indicate higher speeds. Black lines indicate the position of MMR with Jupiter and the ν6 resonance with Saturn. Black dots indicates the position of the parent body. |
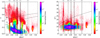 |
Fig. 3 Maps of the dynamical evolution of the ejected Ceres fragments in the (a,e) plane (left panel) and (a,i) plane (right panel) in MaxS. The colourbar indicates the normalised time each cell was occupied by a fragment, relative to the maximum integration time of Τ ~ 700 Myr. The vertical lines indicate the position of the main MMR with Jupiter. The curves in the (a, e) plane indicate the regions with q < 1.665 au and q < 1.3 au, associated with the MC and NEAs, respectively. The curve in the (a,i) plane indicates the position of the v6 resonance. |
3 Dynamical evolution of Ceres and Vesta fragments
In this section, we present the results and analysis of the N-body simulations we performed for the defined scenarios and conditions of fragments ejected from Ceres and Vesta. The simulations consist of the planets in the Solar System, except for MERCURY, which was excluded to reduce computation time, along with Ceres and Vesta, and eight additional asteroids listed in Table 1, to act as gravitational perturbers. These eight asteroids are the most massive members of the MB after Ceres and Vesta. The simulations also include the ejected fragments from both Ceres and Vesta as massless particles that do not self-interact gravitationally with each other.
3.1 Ceres fragments
Here we describe the results for the dynamical evolution of the ejected fragments from Ceres. The numerical simulations were conducted for a maximum time of 700 Myr in MaxS and 500 Myr in MinS. We find no significant differences in the long-term evolution of the ejected fragments between the MaxS and MinS scenarios, in terms of their dynamical paths and final states. Therefore, an interesting result is that the long-term evolution of the ejected fragments, and thus their implantation places in the Solar System, does not depend on the orbital configuration of Ceres relative to the planets. This allows us to consider the simulations carried out in the two scenarios (MaxS and MinS) together and thus improve the statistics for studying the dynamic evolution of the ejected fragments.
Figure 3 displays the maps of the dynamical evolution of the ejected Ceres fragments in MaxS, in the (a, e) (left panel) and (a, i) (right panel) planes, representing the history of their evolution in the Solar System. These maps were generated by dividing the (a, e, i) space into 1000 linear cells, with the colourbar indicating the time each cell was occupied by a fragment, normalised with respect to the maximum integration time (700 Myr). Thus, Fig. 3 shows the dynamical paths of the fragments, their escape routes, and their residence regions.
We find that a total of 109 fragments out of 1000, considering both scenarios, escaped the MB, of which 54 corresponded to MaxS and 55 to MinS5. The left panel of Fig. 4 shows the end states of the escaped Ceres fragments from both scenarios. We find that ~75%6 of the escaped Ceres fragments were ejected from the Solar System after close encounters with Jupiter, while ~35% of them collided with the Sun. The Ceres fragments were able to escape the MB from different routes, which are identified in Fig. 3 as red vertical stripes in the (a,e) plane. These escape routes are associated with the location of strong MMR with Jupiter, where the fragments go through oscillations in eccentricity, which allows them to enter the Mars-Crossing (MC) and then the ΝΕΑ regions. In particular, the right panel of Fig. 4 shows the number of escaped fragments from Ceres with respect to their dynamical route.
We find that an early phase of removal of bodies took place during the first 5 Myr, during which ~30% of the escaped fragments left the MB. The fragments located near the strong resonances with Jupiter, such as the 5:2, 7:3, and 3:1 MMRs, were the first to be removed. The primary escape route during this early stage is the 5:2 MMR at ~2.8 au. As shown in the right panel of Fig. 4, the 5:2 MMR is the main escape route during the entire integration time.
We find a late escape route that emerges after ~20 Myr. This escape route is located in a chaotic region governed by the effect of weaker MMR, and it can be seen as a broad vertical stripe between ~2.66 au and ~2.74 au in the left panel of Fig. 3. The strongest MMR in this region is the 8:3 MMR with Jupiter, but there are also several other MMRs in the vicinity, including the 19:7 MMR with Jupiter, 2:9 MMR with Earth, and 3:7 and 5:12 MMRs with Mars, among many others (Gallardo 2006). Bodies located in this region undergo long-term oscillations in their eccentricities that eventually make them available for escape from the MB by entering the MC and NEA regions. The right panel of Fig. 4 shows that over 30% of the escaped fragments left the MB via this route, while the left panel indicates that the most common fate for these bodies is to collide with the Sun, as the percentage of such events increases rapidly after 20 Myr.
The vast majority of the Ceres fragments did not escape the MB and remained, during most of the integration time, in the regions where they were injected after being ejected from Ceres. The residence regions can be identified in Fig. 3 as violet and blue zones with low eccentricities, which are widely spread throughout the MB. As shown in the right panel of Fig. 3, the fragments that did not escape kept their inclinations limited between ~6° and ~12°. There, the fragments undergo an evolution influenced by the gravitational forces exerted by the planets and the asteroids that we have considered as massive bodies. This evolution engages in intricate dynamical mechanisms, including both close encounters and secular resonances. These complex processes can ultimately result in the fragments finding their way into the aforementioned escape routes at late times. Among the massive non-planetary bodies listed in Table 1, we find that Ceres is the most influential one that is capable of inducing relevant shifts in the fragments’ semi-major axis through close encounters.
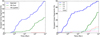 |
Fig. 4 Left: end states of the escaped Ceres fragments represented as a percentage of the total number of ejected fragments as a function of time. The different curves indicate the final states reached by the fragments, including ejection from the Solar System, collision with the Sun, and collision with Jupiter. Right: escape routes of Ceres fragments represented as a percentage of the total number of escaped fragments as a function of time. The different curves indicate the main MMR by which the Ceres fragments escaped the MB. |
3.1.1 Potential Ceres family
In our initial distribution of orbital elements, shown in Fig. 2, we found that -22% of the ejected Ceres fragments were injected in the Pristine region of the MB, where the only escape routes are the 5:2 and 7:3 MMR that bound the region. As can be seen in Fig. 3, the orbits of the fragments in that region have not been significantly perturbed throughout the integration time. In fact, the eccentricities reached values of at most ~0.15, while the inclinations remained in the range ~7°–13.5°.
This is an interesting result since due to the dynamical stability and the low number of bodies in the Pristine region (Brož et al. 2013), Carruba et al. (2016) proposes that members of an ancient Ceres family may survive in that region. Carruba et al. (2016) performed a statistical study over a sample of 133 C-type asteroids of the Pristine region smaller than 20 km in diameter. The authors argue that some of these asteroids could be remaining members of a Ceres family due to their spectral features. Moreover, they selected 45 of these asteroids as potential candidates after performing a statistical analysis and removing possible contamination from other families like Charis, Eos and Koronis.
Figure 5 shows the portion of the (a,i) map of Fig. 3 associated with the Pristine region. We find that the proper inclinations of 16 of the candidates proposed by Carruba et al. (2016) larger than 5 km fall within the most populated range of inclinations reached by the fragments in our N-body simulations which are shown as black dots in Fig. 5. The proper orbital elements of these specific asteroids are listed in Table 2. However, caution must be taken when directly comparing proper and instantaneous orbital elements. Nevertheless, this agreement between both orbital distributions may support the hypothesis that these candidates could be remnants of an ancient Ceres family. Further observations and spectroscopic analysis of these particular asteroids may either confirm or dismiss this idea in the future.
3.1.2 NEAs from Ceres and collisions with Earth
We have seen that the Ceres fragments were able to escape the MB mainly through the 5:2 MMR and a chaotic region we associate with the 8:3 MMR. Figure 3 shows that these fragments, when escaping, had incursions into the MC and NEA regions after having their eccentricities increased by the effect of the MMR. For bodies that escape through the 5:2 MMR, the average times in the MC and NEA regions are 1.70 Myr and 0.22 Myr, respectively, while for the bodies that escape through 8:3 the times are 6.89 and 1.14 Myr, respectively.
These escaped Ceres fragments had close encounters with the terrestrial planets during their time in the MC and NEA regions before reaching their end states. In particular, we focus on the close encounters with Earth in order to estimate the number of impacts with Earth of Ceres fragments over the age of the Solar System. Using MERCURY, we obtained the orbital elements a, e and i of the fragments that entered the Hill sphere of Earth at their minimum approach distance. Thus, from the number of encounters with Earth, it is possible to calculate the number of collisions NT. To do so, we follow the ‘particle in a box’ approximation, described in detail in Di Sisto & Brunini (2011). In our simulations, 92 out of 1000 Ceres fragments underwent 1766 close encounters within the Earth’s Hill sphere during a maximum time of ~700 Myr. Therefore, if we assume that the encounter rates inside RH are constant, the number of collisions of Ceres fragments with Earth during 4000 Myr can be estimated as:
 (2)
(2)
where vi is the mean relative impact velocity, vH is the mean relative encounter velocity of the fragments when they enter Earth’s Hill sphere of radius RH, RT is the terrestrial radius. N5 is the total number of Ceres fragments larger than 5 km produced over 4 Gyr, which was estimated as 2533 by Zain et al. (2021) from collisional evolution.
The relative velocities vi and vH are not quantities that can be obtained directly from MERCURY. However, inspecting the Eq. (2) we see that, for there to be a collision with Earth, the fraction λ = vi/vH must be greater than 2.14. We estimate λ using the semi-major axis a of the fragments on their minimum distance to Earth, recorded by MERCURY. With this, we calculate the two-body problem heliocentric velocities vi at 1 au and vH at 1 au + RH, and then the relative velocities with respect to Earth. In this way, by taking mean values of the velocities, we find that λ = 1.03. Therefore, we conclude that there were no collisions of Ceres fragments larger than 5 km with Earth over the age of the Solar System.
However, we might expect that collisions of smaller fragments would have occurred. Indeed, the small Ceres fragments would be vastly more numerous and thus more would be able to reach the escape routes from the MB due to the radiation forces. We are not able to quantify it in this work, but from Eq. (2), we can expect the number of possible collisions with Earth to be higher.
Proper orbital elements of the 16 potential candidates of a Ceres family (Carruba et al. 2016) larger than 5 km which lie in the inclination range 7°–13.5° reached by the bodies in our N-body simulations.
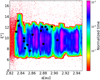 |
Fig. 5 Portion of the (a,i) map, from Fig. 3, associated with the Pristine region of the MB. Black circles indicate the proper a and i of the potential candidates of a Ceres family in the range 7°–13.5° (Carruba et al. 2016). |
3.2 Vesta fragments
Here we present the results of the dynamical evolution of the ejected Vesta fragments. We performed numerical simulations with integration times of ~700 Myr for the MaxS scenario and ~500 Myr for the MinS scenario. However, we find no significant differences in the long-term evolution between the two scenarios. Therefore, we show in Fig. 6 the maps that illustrate the dynamical paths of the Vesta fragments in the (a,e) and (a,i) planes in the MaxS scenario, which are representative of the overall evolution of these fragments. These maps were obtained in the same manner as those for Ceres shown in Fig. 3.
The bottom panels of Fig. 6 show that the dynamical evolution of the Vesta fragments was more stable than that of the Ceres fragments. In fact, the bodies that were located in a range of semi-major axis close to Vesta, namely between ~2.26 au-~2.47 au, kept their eccentricities smaller than ~0.2 and inclinations smaller than ~10° during the whole simulations. On the contrary, the bodies outside the mentioned range of semimajor axis had more perturbed orbits, and such perturbations are manifested in larger oscillations of their eccentricities and inclinations. On one hand, fragments with a > 2.47 were highly perturbed by the effect of the 3:1 MMR, while those injected initially in the Middle region suffered even larger oscillations in their eccentricities, reaching values of up to ~0.35. On the other hand, fragments with a < 2.26 were under the effect of many higher order MMR, like 11:3 and 7:2 with Jupiter, along with the ν6 resonance with Saturn. These fragments underwent large oscillations in their eccentricities, which allowed them to reach the MC and NEA regions and finally escape the MB.
We find that the escape of Vesta fragments is significantly less efficient than in the case of Ceres. Only 22 Vesta fragments out of 1000 escaped the MB, 13 in MaxS and 9 in MinS. As with Ceres, the long-term evolution of ejected fragments from Vesta does not depend on the initial orbital configuration relative to the planets. Therefore, we consider the results carried out under both the MaxS and MinS scenarios together.
The left panel of Fig. 7 shows the end states of the escaped fragments, where we see that about 75%7 of them collided with the Sun, while about 25% were ejected from the Solar System. The right panel of Fig. 7 shows that about 70% escaped through the 3:1 MMR, while the rest escaped through ν6. It can be appreciated in both panels that the escape of bodies was higher in late times. Indeed, almost half of the bodies that escaped did so after about 100 Myr.
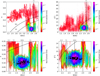 |
Fig. 6 Maps of the dynamical evolution of the Vesta fragments in the (a,e) plane (left panels) and (a,i) plane (right panels) in MaxS. The colourbar indicates the time each cell was occupied by a fragment, normalised with respect to the maximum integration time of T ~ 700 Myr. The top panels show the maps in a wide range of semi-major axis that display the dynamical path of escaped Vesta fragments in the MC and NEA regions, while the bottom panels zoom in the region where most fragments remained during the N-body simulations. The vertical lines indicate the positions of MMR with Jupiter. The curves in the (a, e) planes indicate the regions with q < 1.665 au and q < 1.3 au, associated with the MC and NEA regions, respectively. The curve in the (a,i) plane indicates the position of the ν6 resonance. Black dots in the right panels indicate the proper orbital elements of members of the Vesta family larger than 5 km (Nesvorný et al. 2015). |
3.2.1 NEAs from Vesta and the HED meteorites
We find that, while the escape of Vesta fragments was lower than that of Ceres fragments, the former spent longer times in the planet-crossing region. The bottom panels of Fig. 6 display the dynamical paths of the Vesta fragments in the MC and NEA spaces, identified as red dots. These maps show that the Vesta fragments were capable of reaching very inner orbits, with a semi-major axis down to 1.2 au, and eccentricities greater than 0.35 and inclinations up to 30°. The bodies that escaped through 3:1 spent an average time of ~2.47 Myr and ~1.08 in the MC and NEA spaces, respectively, while those that escaped through ν6 spent a mean time of ~6.89 Myr in the NEA region, a value consistent with Granvik et al. (2018).
This, together with the fact that the main end state of these fragments is to collide with the Sun (Fig. 7), suggests that there could be higher probability of an impact of a Vesta fragment with Earth than in the case of Ceres. Doing the same analysis as in the case of the NEAs from Ceres, we obtain that in our simulations, 20 fragments had 5005 close encounters with Earth in 700 Myr, with a mean value of λ = 1.06. Using N5 = 956 for Vesta (Zain et al. 2021) we obtain, by adapting Eq. (2), that NT was 0.56. Therefore, there were no collisions of multi-kilometre Vesta fragments with Earth. This implies that the HED meteorites must have originated from smaller NEAs originating from Vesta.
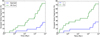 |
Fig. 7 Left: end states of the escaped Vesta fragments, represented as the percentage with respect to the total number of ejected fragments as a function of time. The different curves indicate the end states reached by the fragments, which are the ejection from the Solar System or a collision with the Sun. Right: escape routes from the MB of Vesta fragments, represented as the percentage with respect to the total number of escaped fragments as a function of time. The escape routes are the 3:1 MMR and the ν6 secular resonance. |
3.2.2 Comparison with the Vesta family
The top panel of Fig. 6 shows the proper elements a, e and i of the identified members of the Vesta family larger than 5 km as black dots (Nesvorný et al. 2015). We see that the proper elements of the Vesta family members are contained within the range of osculating elements where the fragment density in our simulations is larger. Moreover, most of the bodies remained in a narrow region close to Vesta, between ~2.27 au and ~2.46 au, where the dynamical evolution was more stable.
In Sect. 2, we found that a small portion of the Vesta fragments were initially injected into the Middle region after the impact event. These fragments were able to reach this orbital position beyond the 3:1 resonance due to their high ejection velocity of ~700 m s−1. The presence of V-type asteroids that are not members of the Vesta family is a topic of discussion, as they have been observed in the Middle and Outer regions of the MB (Duffard & Roig 2009; Moskovitz et al. 2008; Licandro et al. 2017). However, it is assumed that none of this asteroids are members of the Vesta family. On one hand, according to Asphaug (1997), a 42 km projectile on Vesta is capable to eject fragments with a maximum speed of 600 m s−1 without inverting the local stratigraphy, while in this work we did not place an upper limit on the ejection velocities. On the other hand, these bodies may not have reached these orbits via the Yarkovsky effect, due to the low probability of crossing the 3:1 resonance (Roig et al. 2008). So, these V-type asteroids could come from a different basaltic parent body, such as Eunomia or Merxia (Carruba et al. 2014). In our simulations, as Fig. 6 shows, the orbits of the fragments starting in the Middle region are highly perturbed and thus they are able to reach high eccentricities close to the MC region. Therefore, they could potentially escape the MB in longer integration times.
4 Conclusions and discussions
In this work, we performed N-body simulations using the MERCURY code to investigate the dynamical evolution of ejected fragments from Ceres and Vesta after impact events. Specifically, we studied the large (d > 5 km) members from a fictitious asteroid family from each parent body, in two distinct scenarios defined by the starting gravitational force. The results of our work can be summarised as follows:
The Ceres fragments are widely spread through the MB due to their high ejection velocities. The majority of the fragments survive in the Middle and Pristine regions of the MB.
Approximately 10% of the Ceres fragments were able to escape the MB and reach the MC and NEA regions. The main escape route is through the 5:2 MMR, while a secondary route exists through a narrow region between ~2.66 au and ~2.71 au, where the 8:3 MMR with Jupiter and other diffusive resonances with the terrestrial planets are located. The remaining Ceres fragments are widely spread throughout the MB, with the majority surviving in the Middle and Pristine regions of the belt.
The Ceres fragments with initial positions inside the Pristine region have not been significantly perturbed during the integration time. This is consistent with the idea that the surviving members of the Ceres family, if any, may reside and might be found in the Pristine region (Carruba et al. 2016).
The dynamical evolution of Vesta fragments was more stable compared to Ceres fragments, and the escape of bodies was significantly lower. During the integration time, the orbits of most bodies remained close to Vesta’s position, while the bodies located further away from Vesta were able to escape and reach the NEA region through the 3:1 and ν6 resonances. The simulations were able to reproduce the orbits of the detected members of the Vesta family larger than 5 km.
Based on our simulations, we did not observe any collisions of large Ceres or Vesta fragments with Earth in 4 Gyr. This is consistent with the idea that the HED meteorites, which are believed to originate from Vesta, were not the result of direct impacts by large fragments, but rather from smaller ones that were ejected from Vesta and subsequently collided with Earth, or from second-generation fragments resulting from collisional evolution in the MB.
The results presented in this work were obtained from 700 Myr of orbital integration, which is shorter than the estimated age of the Vesta family of ~1 Ga (Marchi et al. 2012; Spoto et al. 2015), and the assumed age of the large structures in Ceres associated with relict impact craters (Marchi et al. 2016). However, it is possible that longer integration times would reveal a larger number of fragments escaping the MB. Nonetheless, the main escape events took place in earlier times, and the overall conclusions of the study would not change significantly.
It is noteworthy that, while our sample size of 1000 particles per parent body might seem relatively modest in light of the extensive ejection field and orbital phase space, it remains sufficient to yield meaningful and representative outcomes. We determined that this selected sample size has effectively enabled us to address crucial research inquiries, particularly regarding the escape routes of fragments from their parent bodies and their associated residence regions.
It is also important to note that the N-body simulations performed in this work were restricted to large multi-kilometre asteroids only. Additionally, we did not consider radiation forces such as the Yarkovsky and YORP effects, which produce secular variations of orbital elements of asteroids smaller than a few kilometres. However, the inclusion of such forces could potentially extend our findings to smaller fragments. The Yarkovsky effect may cause the fragments to spread out more widely across the MB, but it has been observed that it can effectively deliver smaller asteroids into MMRs, where they may eventually escape the MB and reach the NEA region (Granvik et al. 2016, 2018). Therefore, N-body simulations that incorporate the Yarkovsky effect may lead to a greater number of fragments reaching the escape routes identified in this study. This could be achieved in future works using a new recent public implementation of the Yarkovsky and YORP effects into MERCURY (Fenucci & Novakovic 2022).
The study we conducted on the dynamical evolution of ejected fragments from Ceres and Vesta shows that both processes have distinct characteristics. Most of the Vesta fragments remained in a region close to Vesta, which is consistent with the observed positions of the Vesta family members. In contrast, the Ceres fragments were dispersed over larger regions in the MB due to Ceres’ higher mass, resulting in larger ejection velocities. Additionally, Ceres is surrounded by strong MMR, and thus its fragments are constantly affected by Jupiter’s perturbations, while Vesta is further away from strong resonances, resulting in dynamically shielded fragments. These factors imply that any surviving members of an ancient Ceres family may be challenging to locate today, as they may have already been depleted from the MB. Nonetheless, as in Carruba et al. (2016), we suggest that the Pristine region, located between the 5:2 and 7:3 resonances, is the most probable location to discover any surviving members of a Ceres family.
In conclusion, the findings of our study provide valuable insights into the complex dynamics of Ceres and Vesta fragments in the MB, and can guide future efforts aimed at identifying potential remnants of these ancient asteroid families. We look forward to see further research develop in this field, using complementary approaches such as collisional evolution models, spectroscopic analysis and observational studies, in order to provide a more complete picture of the evolution of the MB over the history of the Solar System.
Acknowledgements
The current research received partial funding from Universidad Nacional de La Plata (UNLP) under PID G172. We extend our acknowledgment to Facultad de Ciencias Astronómicas y Geofísicas de La Plata (FCAGLP) and Instituto de Astrofísica de La Plata (IALP) for providing extensive computational resources. We would like to express our gratitude to Dr. Gonzalo de Elía for his valuable contributions and unwavering support throughout the development of this work.
References
- Asphaug, E. 1997, Meteor. Planet. Sci., 32, 965 [NASA ADS] [CrossRef] [Google Scholar]
- Binzel, R. P., DeMeo, F. E., Turtelboom, E. V., et al. 2019, Icarus, 324, 41 [Google Scholar]
- Bland, M. T., Raymond, C. A., Schenk, P. M., et al. 2016, Nat. Geosci., 9, 538 [NASA ADS] [CrossRef] [Google Scholar]
- Bottke, W. F., Durda, D. D., Nesvorný, D., et al. 2005, Icarus, 179, 63 [Google Scholar]
- Brož, M., Morbidelli, A., Bottke, W. F., et al. 2013, A & A, 551, A117 [CrossRef] [EDP Sciences] [Google Scholar]
- Buczkowski, D. L., Schmidt, B. E., Williams, D. A., et al. 2016, Science, 353, aaf4332 [NASA ADS] [CrossRef] [Google Scholar]
- Carruba, V., & Nesvorný, D. 2016, MNRAS, 457, 1332 [NASA ADS] [CrossRef] [Google Scholar]
- Carruba, V., Michtchenko, T. A., Roig, F., Ferraz-Mello, S., & Nesvorný, D. 2005, A & A, 441, 819 [NASA ADS] [CrossRef] [EDP Sciences] [Google Scholar]
- Carruba, V., Huaman, M. E., Domingos, R. C., Santos, C. R. D., & Souami, D. 2014, MNRAS, 439, 3168 [Google Scholar]
- Carruba, V., Nesvorný, D., Marchi, S., & Aljbaae, S. 2016, MNRAS, 458, 1117 [NASA ADS] [CrossRef] [Google Scholar]
- Carry, B. 2012, Planet. Space Sci., 73, 98 [CrossRef] [Google Scholar]
- Chambers, J. E. 1999, MNRAS, 304, 793 [Google Scholar]
- Christou, A. A., & Wiegert, P. 2012, Icarus, 217, 27 [NASA ADS] [CrossRef] [Google Scholar]
- Delisle, J. B., & Laskar, J. 2012, A & A, 540, A118 [NASA ADS] [CrossRef] [EDP Sciences] [Google Scholar]
- Di Sisto, R. P., & Brunini, A. 2011, A & A, 534, A68 [CrossRef] [EDP Sciences] [Google Scholar]
- Duffard, R., & Roig, F. 2009, Planet. Space Sci., 57, 229 [CrossRef] [Google Scholar]
- Fenucci, M., & Novaković, B. 2022, Serbian Astron. J., 204, 51 [NASA ADS] [CrossRef] [Google Scholar]
- Gallardo, T. 2006, Icarus, 184, 29 [Google Scholar]
- Gou, S., Yue, Z., Di, K., & Liu, Z. 2018, Icarus, 302, 296 [CrossRef] [Google Scholar]
- Granvik, M., Morbidelli, A., Jedicke, R., et al. 2016, Nature, 530, 303 [Google Scholar]
- Granvik, M., Morbidelli, A., Jedicke, R., et al. 2018, Icarus, 312, 181 [CrossRef] [Google Scholar]
- Hiesinger, H., Marchi, S., Schmedemann, N., et al. 2016, Science, 353, aaf4758 [NASA ADS] [CrossRef] [Google Scholar]
- Konopliv, A. S., Asmar, S. W., Park, R. S., et al. 2014, Icarus, 240, 103 [NASA ADS] [CrossRef] [Google Scholar]
- Lazzaro, D., Angeli, C. A., Carvano, J. M., et al. 2004, Icarus, 172, 179 [NASA ADS] [CrossRef] [Google Scholar]
- Licandro, J., Popescu, M., Morate, D., & de León, J. 2017, A & A, 600, A126 [NASA ADS] [CrossRef] [EDP Sciences] [Google Scholar]
- Marchi, S., Dell’Oro, A., Paolicchi, P., & Barbieri, C. 2001, A & A, 374, 1135 [NASA ADS] [CrossRef] [EDP Sciences] [Google Scholar]
- Marchi, S., McSween, H. Y., O’Brien, D. P., et al. 2012, Science, 336, 690 [NASA ADS] [CrossRef] [Google Scholar]
- Marchi, S., Ermakov, A. I., Raymond, C. A., et al. 2016, Nat. Commun., 7, 12257 [NASA ADS] [CrossRef] [Google Scholar]
- McCord, T. B., Adams, J. B., & Johnson, T. V. 1970, Science, 168, 1445 [NASA ADS] [CrossRef] [Google Scholar]
- McSween, H. Y., Binzel, R. P., de Sanctis, M. C., et al. 2013, Meteor. Planet. Sci., 48, 2090 [NASA ADS] [CrossRef] [Google Scholar]
- Milani, A., Cellino, A., Kneževic, Z., et al. 2014, Icarus, 239, 46 [NASA ADS] [CrossRef] [Google Scholar]
- Moskovitz, N. A., Jedicke, R., Gaidos, E., et al. 2008, Icarus, 198, 77 [NASA ADS] [CrossRef] [Google Scholar]
- Nesvorný, D., Roig, F., Gladman, B., et al. 2008, Icarus, 193, 85 [CrossRef] [Google Scholar]
- Nesvorný, D., Brož, M., & Carruba, V. 2015, Asteroids IV, Identification and Dynamical Properties of Asteroid Families (Tucson: University of Arizona Press), 297 [Google Scholar]
- Novaković, B., Maurel, C., Tsirvoulis, G., & Knežević, Z. 2015, ApJ, 807, L5 [CrossRef] [Google Scholar]
- Otto, K. A., Marchi, S., Trowbridge, A., Melosh, H. J., & Sizemore, H. G. 2019, J. Geophys. Res. Planets, 124, 1188 [CrossRef] [Google Scholar]
- Park, R. S., Konopliv, A. S., Bills, B. G., et al. 2016, Nature, 537, 515 [NASA ADS] [CrossRef] [Google Scholar]
- Platz, T., Nathues, A., Schorghofer, N., et al. 2016, Nat. Astron., 1, 0007 [NASA ADS] [CrossRef] [Google Scholar]
- Prettyman, T. H., Yamashita, N., Toplis, M. J., et al. 2017, Science, 355, 55 [NASA ADS] [CrossRef] [Google Scholar]
- Rivkin, A. S., Asphaug, E., & Bottke, W. F. 2014, Icarus, 243, 429 [NASA ADS] [CrossRef] [Google Scholar]
- Roig, F., Nesvorný, D., Gil-Hutton, R., & Lazzaro, D. 2008, Icarus, 194, 125 [NASA ADS] [CrossRef] [Google Scholar]
- Russell, C. T., Raymond, C. A., Coradini, A., et al. 2012, Science, 336, 684 [NASA ADS] [CrossRef] [Google Scholar]
- Russell, C. T., Raymond, C. A., Ammannito, E., et al. 2016, Science, 353, 1008 [NASA ADS] [CrossRef] [Google Scholar]
- Schenk, P., O’Brien, D. P., Marchi, S., et al. 2012, Science, 336, 694 [CrossRef] [Google Scholar]
- Spoto, F., Milani, A., & Knežević, Z. 2015, Icarus, 257, 275 [NASA ADS] [CrossRef] [Google Scholar]
- Thomas, P. C., Binzel, R. P., Gaffey, M. J., et al. 1997, Science, 277, 1492 [NASA ADS] [CrossRef] [Google Scholar]
- Vokrouhlický, D., Brož, M., Morbidelli, A., et al. 2006, Icarus, 182, 92 [CrossRef] [Google Scholar]
- Williams, J. G. 1979, Asteroids, Proper elements and family memberships of the asteroids, eds. T. Gehrels & M. S. Matthews (Tucson: University of Arizona Press), 1040 [Google Scholar]
- Zain, P. S., de Elía, G. C., & Di Sisto, R. P. 2020, A & A, 639, A9 [NASA ADS] [CrossRef] [EDP Sciences] [Google Scholar]
- Zain, P. S., Di Sisto, R. P., & de Elía, G. C. 2021, A & A, 652, A122 [NASA ADS] [CrossRef] [EDP Sciences] [Google Scholar]
- Zappala, V., Cellino, A., Farinella, P., & Milani, A. 1994, AJ, 107, 772 [NASA ADS] [CrossRef] [Google Scholar]
While we chose the RADAU method, we recognise that the use of a hybrid integrator could also be appropriate given the statistical nature of our work.
From now on in this section, parent body refers to either Ceres or Vesta.
The results for the MinS are very similar.
Although the integration time was shorter for MinS than MaxS, we note that most of the fragments that escaped the MB did so in times smaller than 300 Myr.
From now on, we consider the percentage of bodies with respect to the total number of escaped Ceres fragments, which in this case is equal to 109.
From now on, we consider the percentage of bodies with respect to the total number of escaped Vesta fragments, which in this case is equal to 22.
All Tables
Physical parameters of Ceres (Park et al. 2016), Vesta (Konopliv et al. 2014) and 8 additional asteroids Carry (2012) used in N-body simulations.
Proper orbital elements of the 16 potential candidates of a Ceres family (Carruba et al. 2016) larger than 5 km which lie in the inclination range 7°–13.5° reached by the bodies in our N-body simulations.
All Figures
|
Fig. 1 Gravitational force on Ceres, according to the angular separations λJC between Jupiter and Ceres, and between Saturn and Ceres λSC. The maximum values of the gravitational force are associated with λJC ~ 0° and the minimum values with λJC ~ 180°. Similar results are obtained for Vesta. |
| In the text | |
|
Fig. 2 Initial distributions of semi-major axis a, eccentricity e and inclination i of the ejected fragments from Ceres (top panels) and Vesta (bottom panels) in MaxS. The colourbar indicates the ejection velocities with respect to the parent body in km s−1, where red colour indicates slower speeds, while blue and violet colour indicate higher speeds. Black lines indicate the position of MMR with Jupiter and the ν6 resonance with Saturn. Black dots indicates the position of the parent body. |
| In the text | |
|
Fig. 3 Maps of the dynamical evolution of the ejected Ceres fragments in the (a,e) plane (left panel) and (a,i) plane (right panel) in MaxS. The colourbar indicates the normalised time each cell was occupied by a fragment, relative to the maximum integration time of Τ ~ 700 Myr. The vertical lines indicate the position of the main MMR with Jupiter. The curves in the (a, e) plane indicate the regions with q < 1.665 au and q < 1.3 au, associated with the MC and NEAs, respectively. The curve in the (a,i) plane indicates the position of the v6 resonance. |
| In the text | |
|
Fig. 4 Left: end states of the escaped Ceres fragments represented as a percentage of the total number of ejected fragments as a function of time. The different curves indicate the final states reached by the fragments, including ejection from the Solar System, collision with the Sun, and collision with Jupiter. Right: escape routes of Ceres fragments represented as a percentage of the total number of escaped fragments as a function of time. The different curves indicate the main MMR by which the Ceres fragments escaped the MB. |
| In the text | |
|
Fig. 5 Portion of the (a,i) map, from Fig. 3, associated with the Pristine region of the MB. Black circles indicate the proper a and i of the potential candidates of a Ceres family in the range 7°–13.5° (Carruba et al. 2016). |
| In the text | |
|
Fig. 6 Maps of the dynamical evolution of the Vesta fragments in the (a,e) plane (left panels) and (a,i) plane (right panels) in MaxS. The colourbar indicates the time each cell was occupied by a fragment, normalised with respect to the maximum integration time of T ~ 700 Myr. The top panels show the maps in a wide range of semi-major axis that display the dynamical path of escaped Vesta fragments in the MC and NEA regions, while the bottom panels zoom in the region where most fragments remained during the N-body simulations. The vertical lines indicate the positions of MMR with Jupiter. The curves in the (a, e) planes indicate the regions with q < 1.665 au and q < 1.3 au, associated with the MC and NEA regions, respectively. The curve in the (a,i) plane indicates the position of the ν6 resonance. Black dots in the right panels indicate the proper orbital elements of members of the Vesta family larger than 5 km (Nesvorný et al. 2015). |
| In the text | |
|
Fig. 7 Left: end states of the escaped Vesta fragments, represented as the percentage with respect to the total number of ejected fragments as a function of time. The different curves indicate the end states reached by the fragments, which are the ejection from the Solar System or a collision with the Sun. Right: escape routes from the MB of Vesta fragments, represented as the percentage with respect to the total number of escaped fragments as a function of time. The escape routes are the 3:1 MMR and the ν6 secular resonance. |
| In the text | |
Current usage metrics show cumulative count of Article Views (full-text article views including HTML views, PDF and ePub downloads, according to the available data) and Abstracts Views on Vision4Press platform.
Data correspond to usage on the plateform after 2015. The current usage metrics is available 48-96 hours after online publication and is updated daily on week days.
Initial download of the metrics may take a while.