Fig. 2
Download original image
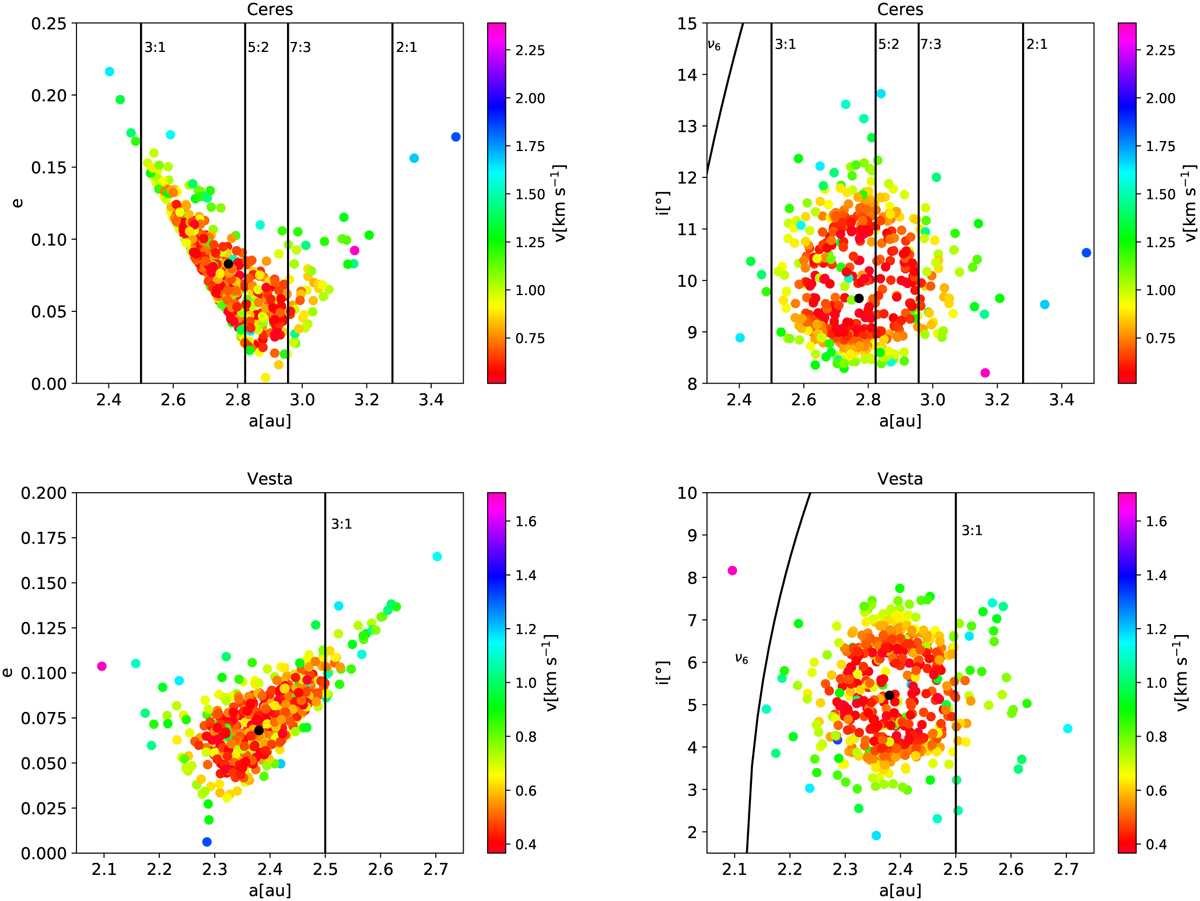
Initial distributions of semi-major axis a, eccentricity e and inclination i of the ejected fragments from Ceres (top panels) and Vesta (bottom panels) in MaxS. The colourbar indicates the ejection velocities with respect to the parent body in km s−1, where red colour indicates slower speeds, while blue and violet colour indicate higher speeds. Black lines indicate the position of MMR with Jupiter and the ν6 resonance with Saturn. Black dots indicates the position of the parent body.
Current usage metrics show cumulative count of Article Views (full-text article views including HTML views, PDF and ePub downloads, according to the available data) and Abstracts Views on Vision4Press platform.
Data correspond to usage on the plateform after 2015. The current usage metrics is available 48-96 hours after online publication and is updated daily on week days.
Initial download of the metrics may take a while.