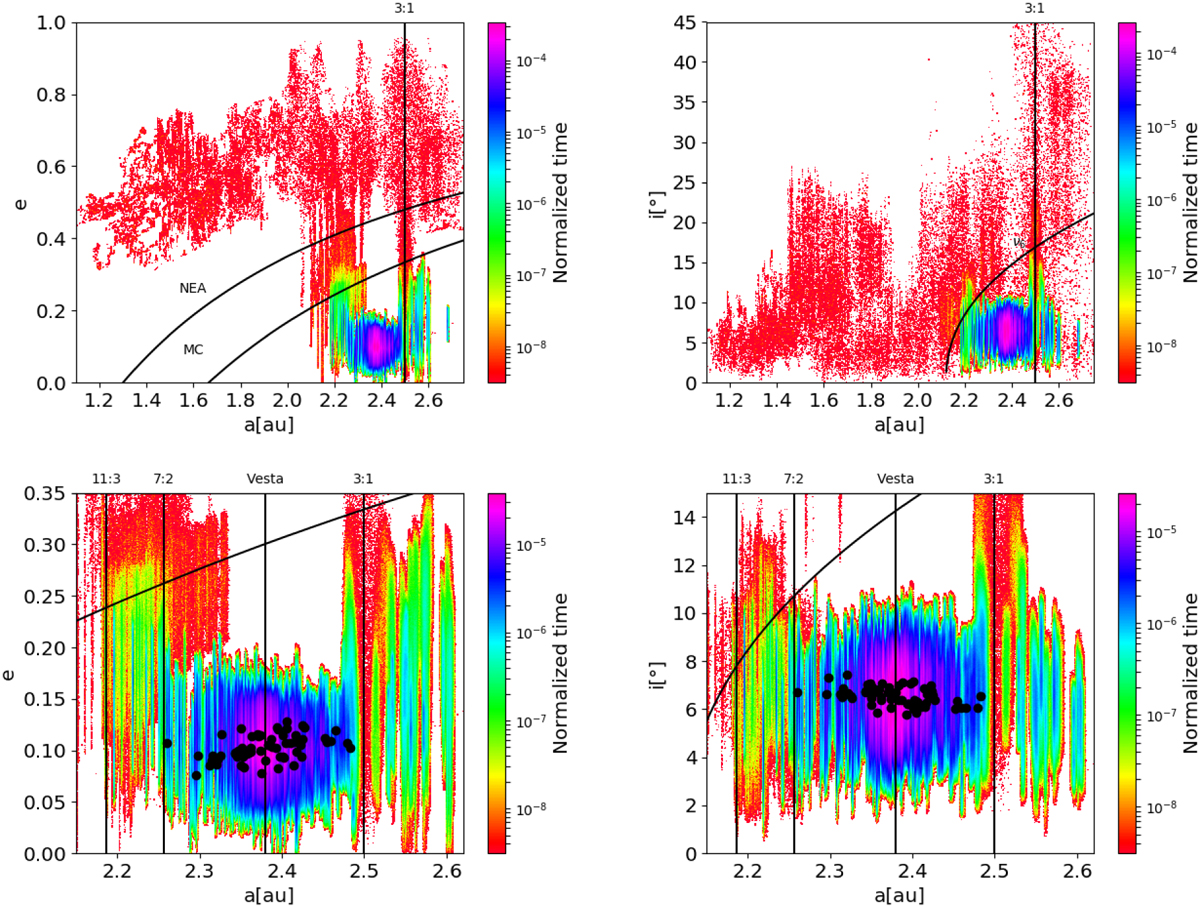
Fig. 6
Download original image
Maps of the dynamical evolution of the Vesta fragments in the (a,e) plane (left panels) and (a,i) plane (right panels) in MaxS. The colourbar indicates the time each cell was occupied by a fragment, normalised with respect to the maximum integration time of T ~ 700 Myr. The top panels show the maps in a wide range of semi-major axis that display the dynamical path of escaped Vesta fragments in the MC and NEA regions, while the bottom panels zoom in the region where most fragments remained during the N-body simulations. The vertical lines indicate the positions of MMR with Jupiter. The curves in the (a, e) planes indicate the regions with q < 1.665 au and q < 1.3 au, associated with the MC and NEA regions, respectively. The curve in the (a,i) plane indicates the position of the ν6 resonance. Black dots in the right panels indicate the proper orbital elements of members of the Vesta family larger than 5 km (Nesvorný et al. 2015).
Current usage metrics show cumulative count of Article Views (full-text article views including HTML views, PDF and ePub downloads, according to the available data) and Abstracts Views on Vision4Press platform.
Data correspond to usage on the plateform after 2015. The current usage metrics is available 48-96 hours after online publication and is updated daily on week days.
Initial download of the metrics may take a while.